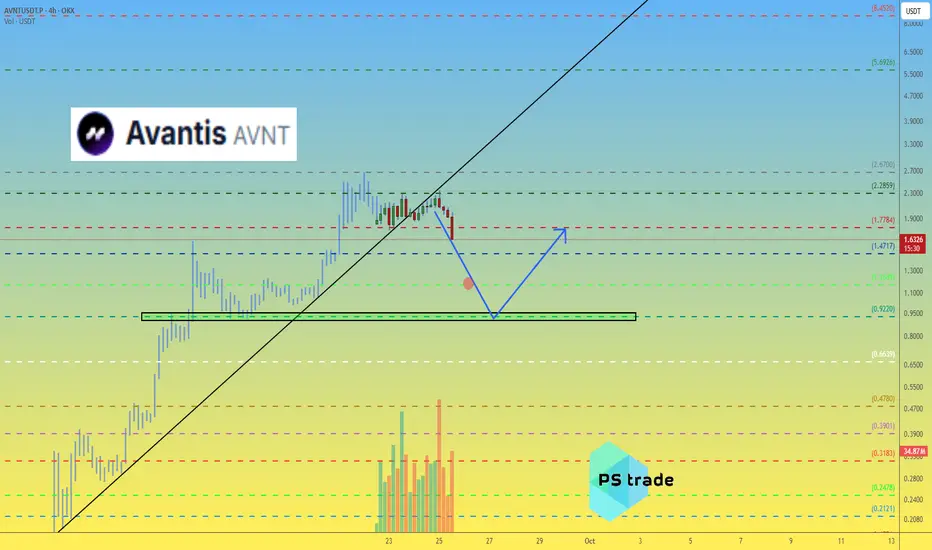
AVNT has to make a decision.... or else!The Avantis price has stopped free falling and is now compressing between a clear support zone below and heavy resistance overhead. Buyers have stepped in at this demand area before and for now it continues to hold.
Above price sits a major resistance zone tied to prior breakdown structure and high volume. Every push into this area has been rejected so far. This is the level that needs to be reclaimed for momentum to shift.
At the moment this looks more like consolidation than continuation.
If support holds price can continue ranging and attempt to form a higher low. A clean reclaim of resistance would open the door for a larger relief move. Losing support would put downside continuation back in play.
This is a patience zone. Confirmation matters more than anticipation. Watching to see which side breaks first.
AVNT

AVNTUSDT Forming Falling WedgeAVNTUSDT is forming a clear falling wedge pattern, a classic bullish reversal signal that often indicates an upcoming breakout. The price has been consolidating within a narrowing range, suggesting that selling pressure is weakening while buyers are beginning to regain control. With consistent volume confirming accumulation at lower levels, the setup hints at a potential bullish breakout soon. The projected move could lead to an impressive gain of around 90% to 100% once the price breaks above the wedge resistance.
This falling wedge pattern is typically seen at the end of downtrends or corrective phases, and it represents a potential shift in market sentiment from bearish to bullish. Traders closely watching AVNTUSDT are noting the strengthening momentum as it nears a breakout zone. The good trading volume adds confidence to this pattern, showing that market participants are positioning early in anticipation of a reversal.
Investors’ growing interest in AVNTUSDT reflects rising confidence in the project’s long-term fundamentals and current technical strength. If the breakout confirms with sustained volume, this could mark the start of a fresh bullish leg. Traders might find this a valuable setup for medium-term gains, especially as the wedge pattern completes and buying momentum accelerates.
✅ Show your support by hitting the like button and
✅ Leaving a comment below! (What is your opinion about this Coin?)
Your feedback and engagement keep me inspired to share more insightful market analysis with you!

$AVNT Breakout AttemptAvantis is trying to break out of its descending wedge and just made a strong push higher, tagging around $0.41.
On the daily chart, this marks the second test of the channel. Price has been grinding higher with clear higher lows, and if volume continues to hold up, there’s room for a squeeze toward the $0.50–0.60 area.
That said, any strong rejection around $0.50 could set up a decent short, with the downside opening back up toward the $0.20 area as an initial target.

AVNTUSDT UPDATEAVNT
UPDATE
AVNT Technical Setup
Pattern: Falling Wedge Pattern
Current Price: 0.3514 USDT
Target Price: 0.7814 USDT
Target % Gain: 285.80%
Technical Analysis: AVNT is breaking out of a falling wedge pattern on the 1D chart, indicating bullish potential. The price has recently pushed above the descending resistance trendline after a prolonged downtrend, supported by expanding price action. This breakout structure validates a potential upside move toward the 0.7814 USDT resistance zone.
Time Frame: 1D
Risk Management Tip: Always use proper risk management.

AVNTUSDT Forming Falling WedgeAVNTUSDT is forming a clear falling wedge pattern, a classic bullish reversal signal that often indicates an upcoming breakout. The price has been consolidating within a narrowing range, suggesting that selling pressure is weakening while buyers are beginning to regain control. With consistent volume confirming accumulation at lower levels, the setup hints at a potential bullish breakout soon. The projected move could lead to an impressive gain of around 190% to 200% once the price breaks above the wedge resistance.
This falling wedge pattern is typically seen at the end of downtrends or corrective phases, and it represents a potential shift in market sentiment from bearish to bullish. Traders closely watching AVNTUSDT are noting the strengthening momentum as it nears a breakout zone. The good trading volume adds confidence to this pattern, showing that market participants are positioning early in anticipation of a reversal.
Investors’ growing interest in AVNTUSDT reflects rising confidence in the project’s long-term fundamentals and current technical strength. If the breakout confirms with sustained volume, this could mark the start of a fresh bullish leg. Traders might find this a valuable setup for medium-term gains, especially as the wedge pattern completes and buying momentum accelerates.
✅ Show your support by hitting the like button and
✅ Leaving a comment below! (What is your opinion about this Coin?)
Your feedback and engagement keep me inspired to share more insightful market analysis with you!

AVNT Testing Key Resistance After Trendline BreakNYSE:AVNT is testing a key resistance zone after breaking above the descending trendline. While this bounce looks promising, price needs to hold above this level for any sustained upside.
A rejection here could lead to another pullback, so confirmation is key.
DYOR, NFA

AVNTUSDT Forming Falling WedgeAVNTUSDT is forming a clear falling wedge pattern, a classic bullish reversal signal that often indicates an upcoming breakout. The price has been consolidating within a narrowing range, suggesting that selling pressure is weakening while buyers are beginning to regain control. With consistent volume confirming accumulation at lower levels, the setup hints at a potential bullish breakout soon. The projected move could lead to an impressive gain of around 190% to 200% once the price breaks above the wedge resistance.
This falling wedge pattern is typically seen at the end of downtrends or corrective phases, and it represents a potential shift in market sentiment from bearish to bullish. Traders closely watching AVNTUSDT are noting the strengthening momentum as it nears a breakout zone. The good trading volume adds confidence to this pattern, showing that market participants are positioning early in anticipation of a reversal.
Investors’ growing interest in AVNTUSDT reflects rising confidence in the project’s long-term fundamentals and current technical strength. If the breakout confirms with sustained volume, this could mark the start of a fresh bullish leg. Traders might find this a valuable setup for medium-term gains, especially as the wedge pattern completes and buying momentum accelerates.
✅ Show your support by hitting the like button and
✅ Leaving a comment below! (What is your opinion about this Coin?)
Your feedback and engagement keep me inspired to share more insightful market analysis with you!

Avantis middle term targets! AVNT after listing perform pretty good! But its not a mistake always after 100% withdraw initial deposit! I dont't know why and how people buying this type of tokens after crazy uptrend! Maybe they are greedy and 2 dollar is not enough! zones of interest based on IAP model shared before! BITGET:AVNTUSDT
Here is a current levels what i would like to see! Test of marked levels where we will almost close wick after 10 october! And than we will see bounce back to October open and Equilibrium of downtrend since end of september! After we will come back to this idea again!
Lowes point for correction marked with rectangle under key levels! If price will go lower than its will be invalidation and price discovery mode
Thanks for support

Avantis is still in a free-fall. Keep an eye on the shift. AVNT Price is sitting right on a major historical support, with momentum showing early signs of seller exhaustion. We’ve got a bullish divergence forming, Oscillators slowing its bleed, and price pressing against a key horizontal level.
But the trend is still down — no confirmation until this level flips back into support. Reclaim it, and price has a clear path into the next liquidity pocket on the VPVR. Fail it, and we stay in the low-volume zone below.
A classic high-risk, high-reward inflection point.
#AVNT Update — RWA Sector Watch Chart shows
Nice falling wedge forming here.
AVNT is sitting between two options:
hold the current range and attempt a breakout following Aster’s movement,
or make a short-term breakdown with a wick toward 0.32 – 0.27.
Both zones are solid buy regions in my view.
🔑 Key Levels
Support zone: 0.32 – 0.27
Recovery line: 0.90 – 1.20
Breakout path: 2.20 – 3.50 (ATH recovery range)
Max investment on AVNT → 3 % of portfolio.
Trade it as a rotation play with clear stops and staged exits.
🧾 About Avantis
Avantis is the largest RWA perpetuals DEX in DeFi, built and backed on Base.
It allows trading of crypto and real-world assets (FX, commodities, indices, equities).
Supported by Pantera and Coinbase, it’s currently the top DEX on Base by volume,
offering institutional-grade products and up to 500× leverage in a transparent, permissionless way.
Avantis introduced Zero-Fee Perpetuals (ZFP) — traders pay fees only when they profit.
It also brought leveraged RWAs on-chain, driving rapid growth:
over 20 billion USD in cumulative volume and 15 million run-rate revenues since February 2024.
(See CMC for more background.)
✅ Quick Recap
Pattern: Falling wedge
Buy zones: 0.32 – 0.27
Recovery line: 0.90 – 1.20
Breakout targets: 2.20 – 3.50
Allocation: 3 % max
Trend bias: Bullish recovery if wedge holds
⚓ Renzo Tip
“When a wedge tightens, patience becomes your best entry signal; force it, and you miss the release.”
🤲 Prayer
May Allah bless us with calm decisions, protect our trades from haste,
and grant us the clarity to wait for confirmation before every move.
I’ve traded this coin from the early base around 0.30 → 1.80,
so returning to these levels offers a strong risk-to-reward window.
📈

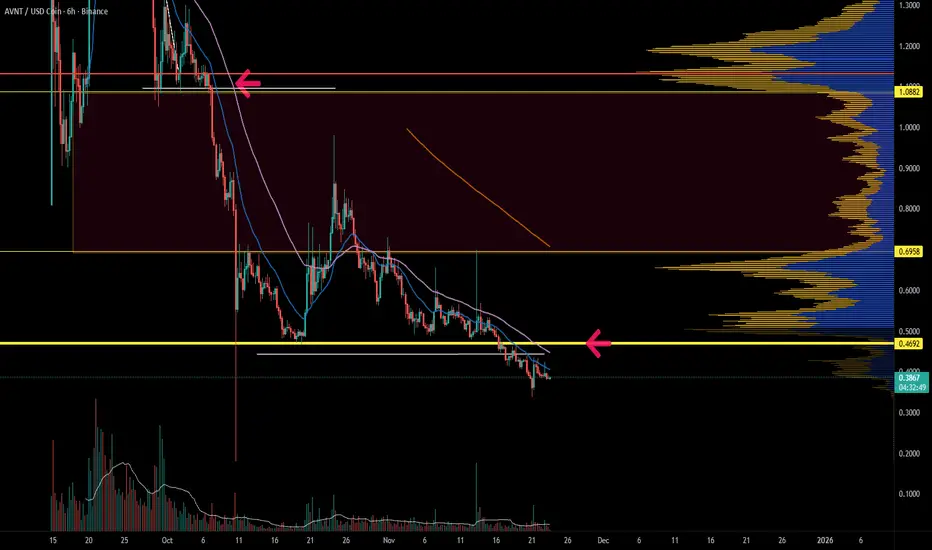
$AVNT – Testing the demand zone againAfter a prolonged correction from the $1.5 resistance zone, NYSE:AVNT has once again found support at the same demand zone that previously triggered strong reversals.
Price is respecting the green support area around 0.45–0.50
The descending trendline has been tested multiple times, showing weakening bearish pressure
Each time price entered this zone, buyers stepped in with momentum
If NYSE:AVNT manages to hold this area, a potential bounce or short-term recovery could follow.
However, a clean breakdown below 0.45 would invalidate the setup and open the door for deeper downside.
Key levels:
🟢 Support: 0.45–0.50
🔴 Resistance: 1.20–1.50
Watching closely for confirmation of a reversal.

AVNTUSDT Forming Bullish WaveAVNTUSDT is showing a promising bullish wave pattern, indicating a potential continuation of upward momentum after a healthy consolidation phase. This technical setup often highlights renewed buyer strength and signals that the asset could be preparing for its next leg higher. The pattern’s structure suggests that market sentiment is gradually turning optimistic, with buyers stepping in to accumulate at key support levels.
The trading volume remains solid, confirming growing participation and interest from investors who are positioning for potential upside. With an expected gain of 50% to 60%+, AVNTUSDT could soon break through its current resistance zone, triggering a wave of bullish momentum across the chart. Such setups are often followed by short-term rallies driven by technical traders and breakout enthusiasts, making this an attractive pair to watch closely in the coming sessions.
Investor sentiment toward AVNT has been improving as confidence builds around its long-term potential and market cover outlook. The combination of strong fundamentals and a bullish technical structure makes this pair one to monitor for potential gains. If the momentum continues to build, AVNTUSDT could outperform several mid-cap crypto assets in the near term, offering traders a valuable opportunity for strategic entry.
✅ Show your support by hitting the like button and
✅ Leaving a comment below! (What is You opinion about this Coin)
Your feedback and engagement keep me inspired to share more insightful market analysis with you!

THE RETURN OF AVNTDepending on the low time frame, this coin shows an increasing view, which data shows that there is a high chance this coin will return, we will follow the confirmations in the coming time frames

AVNTNYSE:AVNT - price update:
Daily view remain bearish and under resistances 📉
Neutral area H4.
I see a possible bull setup here , with a possible triangle break & retest📈
Bull consolidation valid above 1.150$
Price structure looks good for another bull move toward upper resistances (pevious supports) HTF;
1.500$ next step? 🎯
Lower supports:
$1.150
$1.10
$1.060
$1.00

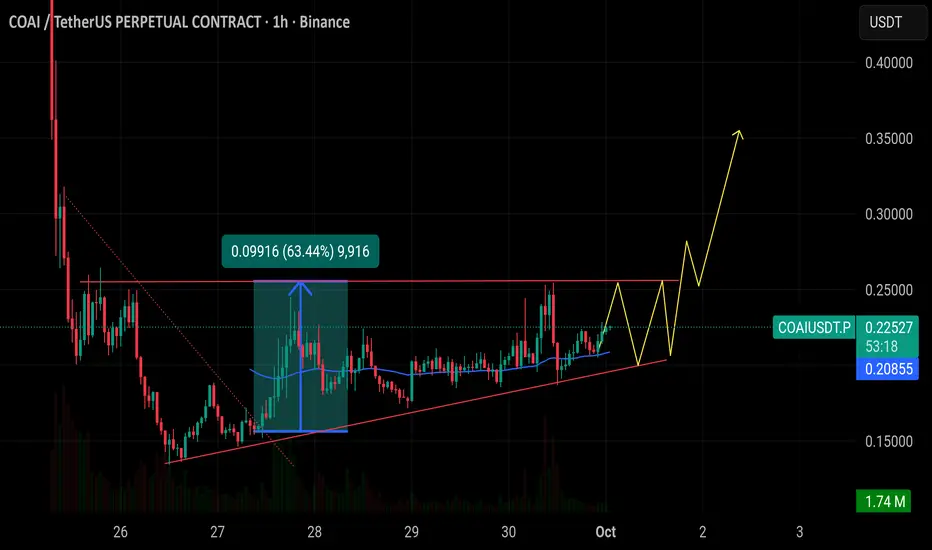
$COAI after a 63% pump is now trading in an Ascending Triangle $COAI after a 63% pump is now trading in an Ascending Triangle with resistance around 0.25 and rising support near 0.20. A breakout above 0.25 could push the price toward 0.35–0.40, while losing the rising support would risk a sharp drop back under 0.19.
AVNT USD Dca Alpha Call
📊 AVNT/USDT Analysis (4H Chart)
Currently, AVNT is trading around 1.39 USDT, sitting right near the 0.618 Fibonacci retracement (1.4492) – a critical area that often decides the next move.
🔑 Key Support Level: 1.3350
As long as this level holds, the chance for a bullish reversal remains strong.
🎯 Potential Targets:
1.62 (Fibo 0.5)
1.90 – 2.00 (next bullish continuation)
📌 Scenarios:
If price holds above 1.3350, upside momentum may push it back toward 1.62 and beyond.
A breakdown below support could drag the price lower to 1.2280 (Fibo 0.786).
💡 Conclusion:
AVNT is now sitting in a key demand zone. Aggressive traders may consider early entries, while conservative ones should wait for a clear rebound confirmation.

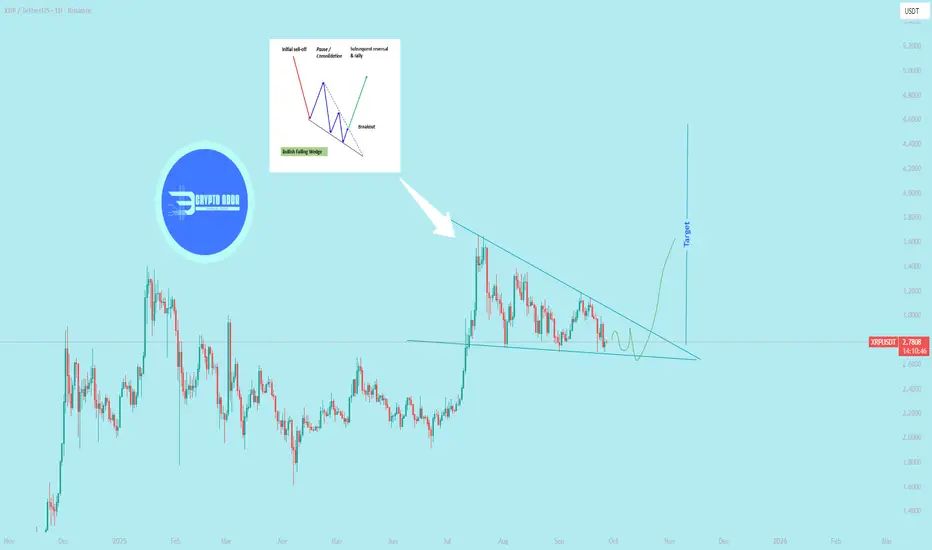
$XRP Performing falling wedge pattern in 1D
> Falling wedge as a reversal vs. continuation pattern
`As a reversal pattern`
`Location:` Occurs at the end of a prolonged downtrend.
Signal: The narrowing price action and declining volume suggest that sellers are exhausting their momentum. The pattern is completed when the price breaks above the upper resistance line, signaling a potential bullish reversal.
`As a continuation pattern`
`Location: `Appears after a strong uptrend.
Signal: The falling wedge acts as a temporary consolidation or pause in the current trend. The price then breaks out to the upside, continuing the original uptrend. @everyone
$AVNT Avantis — Potential Correction LevelsThe available chart history of OKX:AVNTUSDT.P suggests a corrective move is likely. Based on technical observation:
First key support: $1.16–1.20
Deeper retracement zone: $0.90–0.95
#Avantis remains a very young project with limited track record. Market participants should be prepared for heightened volatility as liquidity builds.
👉 What’s your outlook — consolidation above $1.20, or another leg down toward $0.90?
______________
◆ Follow us ❤️ for daily crypto insights & updates!
🚀 Don’t miss out on important market moves
🧠 DYOR | This is not financial advice, just thinking out loud.
avntThis is the 26% zone, the important zone for me is 1.7317 to 1.9346, which is my main support, but if it breaks, I think the greens will be more attractive.

$AVNT Perform of a bullish pennantWhat the pattern indicates
A bullish pennant is a continuation pattern, meaning that it signals the market is likely to continue its current trend after a brief pause. It suggests that the buying pressure that caused the initial rally is gathering strength for another push upward.
How to trade the pattern
Traders can use this pattern to plan entry and exit points:
Entry: A common strategy is to enter a long position (buy) when the price breaks above the pennant's resistance trendline.
Profit target: The typical price target for the trade is determined by measuring the height of the initial flagpole and projecting that distance from the breakout point.
Stop-loss: To manage risk, a stop-loss order can be placed just below the pennant's lower trendline.

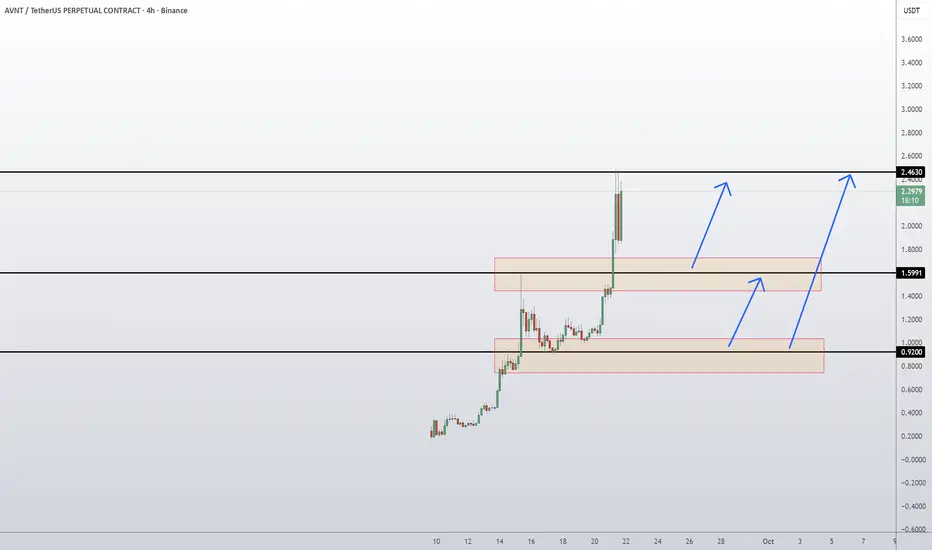
AVNT Coin Avantis Token Price Prediction and Technical AnalysisAVNT/USDT has surged with strong momentum, breaking out above the 1.5991 resistance and extending gains toward the 2.4630 zone, where sellers are now showing pressure. If buyers defend the breakout level at 1.5991, continuation toward the 2.9353 resistance looks likely. On the downside, a pullback into the 1.5991 demand zone would still be healthy, while deeper retracement into 0.9200 support would test the strength of the current bullish trend.
📈 Key Levels:
Buy trigger: Retest/hold above 1.5991 support
Buy zone: 1.60 – 1.65 region (secondary at 0.92 if deeper pullback)
Target 1: 2.4630 resistance
Target 2: 2.9353 resistance
Invalidation: Daily close below 0.9200 (would weaken bullish outlook)
👉 Follow me for More Real Time Opportunities.
Share your Thoughts if you have any?
#AVNT breakout on fire! Price blasted more than 50% #AVNT breakout on fire! Price blasted more than 50% in less than 24h. Unstoppable momentum is driving the rally. Buyers are flooding in with strong demand. Resistance levels are getting tested fast.
Bulls fully in control.

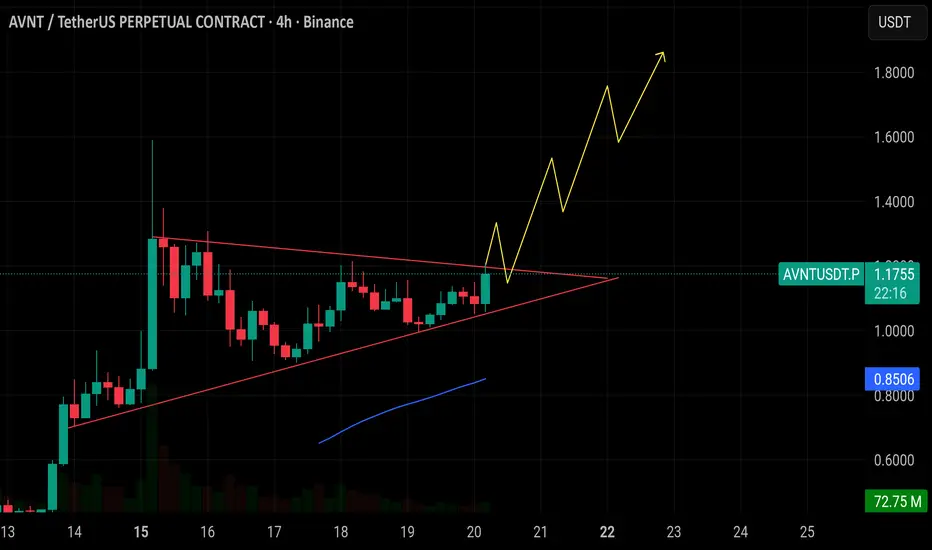
$AVNT is breaking out of a tightening wedge. If momentum holds NYSE:AVNT is breaking out of a tightening wedge. If momentum holds above 1.17, the next leg higher could target 1.40–1.80.
Support remains strong at 0.85, making this a key level to watch.
Bullish continuation in play. 🚀