AXS OutlookGiven the current market conditions, I think AXS could move above $2 at any time with a single move.
Axieinfinity

Axie Infinity Trades Within Opportunity Buy Zone · (PP: 16,253%)Right now Axie Infinity is trading within the "opportunity buy zone," this is a level just below the support zone from 2024, 2023 and 2022. It is trading in this zone searching for liquidity. Once this move is over, AXSUSDT will never be available at these prices in the future. The lowest will be the long-term support zone from 2022-2024.
Can Axie Infinity hit a new all-time high in 2025 or 2026? It is possible. But, in this chart setup and analysis we are focusing on high probability conservative targets.
"Back to baseline" is the very easy target. The first target after that sits around $20 for 677%. The main target goes higher, $32 for 1,111%. A strong target is $55 and this one opens up 1,983% profits potential.
A new all-time high can be $268 & $435. Really huge numbers. Just to give you an idea, the second one would be equal to 16,253% profits potential. The first one, $268 would be equal to 9,975%. This is theoretically possible so I don't want to commit to it but is good to keep an open mind with market conditions improving at the speed of light. If we can say there is such a thing.
Technical analysis
The bottom in 2025 matches the mid-way stop of the 2021 bull market. So this is an interesting and valid zone for a reversal.
We don't need to go any deeper in looking for reversal signals because a marketwide bullish bias is already confirmed. We've been bullish since 7-April 2025. Some pairs move first others later though and that's why some are already very high while others are very low. This is good because it gives us time to adapt to the market. If everything were to move together at the same time on the same date, it would be too late to buy anything low. Because the market cycles through different sectors, groups and pairs, we can buy the ones that are low now knowing that they will eventually move ahead. Everything grows. Everything will grow. The 2025 bull market is already confirmed.
Thanks a lot for your continued support.
Namaste.

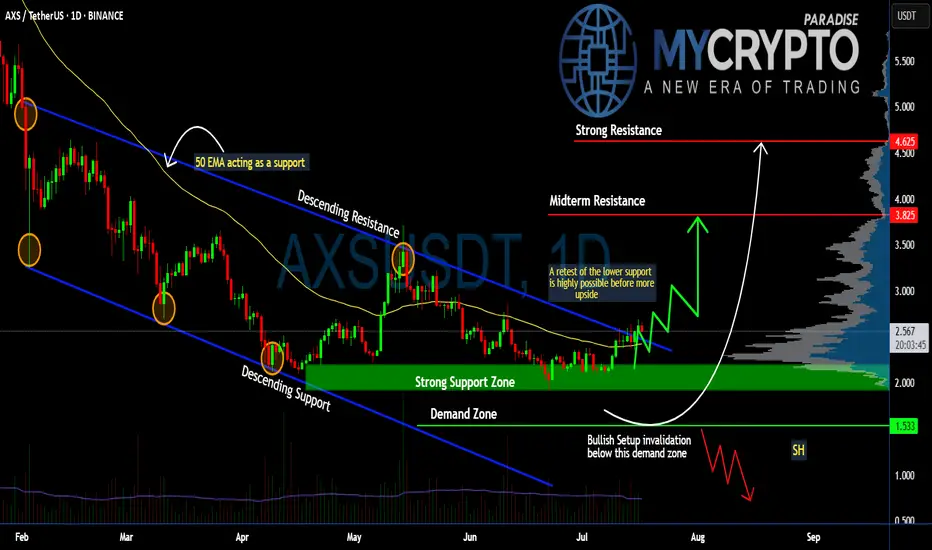
Can #AXS Bulls Sustain the Momentum or Will it Fall? Key LevelsYello, Paradisers! Will #AXS finally deliver a strong upside move, or are we just seeing another setup to trap impatient bulls before a deeper drop? Let’s break down the latest #AXSUSDT structure:
💎After months inside a descending channel, #AxieInfinity has finally broken above the descending resistance, showing early signs of a potential trend reversal. The current price trades around $2.56, but history tells us a retest of lower levels is still highly possible before any sustained upside move. The soaring volume and a positive broader market outlook reinforce our bullish bias.
💎The structure is clear: the strong support zone sits between $2.20–$2.00, and this is the first critical level to watch. A healthy retest here would provide a high-probability continuation setup for bulls. Below that, the demand zone at $1.53 is the last stronghold—losing this level would invalidate the bullish scenario completely.
💎If buyers maintain control, the first upside target stands at the midterm resistance of $3.82, where some profit-taking and selling pressure are expected. A clean breakout above this zone could push the price toward the strong resistance at $4.62, where major distribution could occur.
💎However, the bullish setup becomes invalid if #AXSUSD loses the $1.53 demand zone. A confirmed daily close below this level would flip the structure bearish and open the door for a move to new lows.
Stay patient, Paradisers. Let the breakout confirm, and only then do we strike with conviction.
MyCryptoParadise
iFeel the success🌴
#AXSUSDT #4h (Bitget Futures) Falling wedge breakout and retestAxie Infinity just pulled back to 50MA support where it's bouncing, looks ready for recovery towards 200MA resistance and more.
⚡️⚡️ #AXS/USDT ⚡️⚡️
Exchanges: Bitget Futures
Signal Type: Regular (Long)
Leverage: Isolated (4.0X)
Amount: 4.7%
Current Price:
2.509
Entry Zone:
2.489 - 2.407
Take-Profit Targets:
1) 2.758
2) 2.991
3) 3.224
Stop Targets:
1) 2.189
Published By: @Zblaba
NYSE:AXS BITGET:AXSUSDT.P #4h #AxieInfinity #P2E axieinfinity.com
Risk/Reward= 1:1.2 | 1:2.1 | 1:3.0
Expected Profit= +50.7% | +88.7% | +126.8%
Possible Loss= -42.3%
Estimated Gaintime= 1-2 weeks

AXS: Bullish Possibility for Axie Infinity#AXS was one of the top performers during the 2021 bull run delivering nearly 100,000% returns that year, followed by a 4-years long correction.
Passing $10 shifts the long-term bearish trend into a bullish phase. Breaking $2.22 invalidates this bullish idea.
#AxieInfinity

Can Axie Infinity Grow 8,000%? Let's Ask The ChartAxie Infinity is recovering from a final flush episode this week. The action just turned green after AXSUSDT hit the lowest price in 4 years, since May 2021.
First, it is still early for buyers and Cryptocurrency traders. Why? Because the action is happening at bottom prices. Just look at the chart, truly low prices as AXSUSDT is still trading below its 3-Feb. low but recovered above its March low already.
The recovery above the 10-March 2025 low within a single candle reveals that the bottom is already in. The final drop, which was a strong shakeout or stop-loss hunt event, not a bearish impulse, is over.
On the left side we can see the bear market wave. It lasted an entire year from November 2021 through November 2022.
This bear market is followed by a neutral-sideways market. This is the transition period.
Now the market is set to turn ultra-bullish but before this bullish cycle there is one final shakeout and that's the drop from December 2024 until April 2025. This move is intended to activate the stop-loss of thousands of traders. Once these people sell lower than what they bought, the market changes course. This is why I do not recommend using a limit stop-loss.
As soon as the multi-year low is hit, the market turns green. This is what is happening now, just watch! Axie Infinity is set to grow long-term.
Buy low to sell high.
Never set a stop-loss limit order on an exchange, it is a recipe for disaster. It is better to wait patiently because the market will recover and will produce strong, sustained, long-term growth.
I have two set of targets, the easy-local targets and the "global" targets.
The easy targets are 560%, 927% and 1,660%. The global targets include the potential for a new All-Time High. We will have to wait and see. I don't know of these purple targets will hit, but is good to be prepared.
Hope for the best and prepare for the best.
Thank you for reading.
Namaste.

TradeCityPro | AXS: Gaming Token at Risk of New Lows or Rebound?👋 Welcome to TradeCity Pro!
In this analysis, I want to review the AXS coin for you. The AXS project is one of the crypto gaming projects, currently ranked 124 on CoinMarketCap with a market cap of $357 million.
⚡️ This project was highly hyped during the previous bull run in 2021, but after a while, the hype faded and we witnessed severe declines in this coin. It is still in a downtrend.
📅 Daily Time Frame
In the daily time frame, as I mentioned, this coin has been in a long-term downtrend, and recently, with the break of the 4.193 level, the next leg of the trend has begun, and the price has moved downward.
✔️ In the previous analysis , if you remember, I told you that to buy this coin, you should wait for the price to stabilize above the 7.366 level, and if it stabilizes below 5.439, a drop could occur.
📉 As you can see, the price never stabilized above 7.366, and after breaking 5.439, a strong bearish trend began. I hope you used this trigger and made good profits from this bearish move.
⭐ We can draw a trendline from the price lows, and in every move the price has made, it has reacted to this dynamic area and started a new leg after some correction.
🧩 Currently, the price is near an important support at the 2.2 area, and both volume and RSI strongly indicate momentum. If this support breaks and RSI enters the oversold zone, we can expect a sharp bearish move from the price.
🎲 The next support the price has is at the 1.355 level, which is the most important price support, and in my opinion, if the price makes another bearish leg, it will react to this area.
⏳ 4-Hour Time Frame
In the 4-hour time frame, as you can see, the price is in a descending channel and has now formed a range box at the bottom of the channel.
💫 The bottom of the box is at 2.2 and the top is at 2.431. A break of the box bottom can bring the price back to the box low again. A break of the box top can start a bullish leg up to the top of the channel.
💥 On the other hand, usually when a box forms at the bottom of a descending channel, the price goes through some time-based correction and likely ranges toward the channel midline.
🔍 Also, pay attention to the RSI oscillator. RSI entering the oversold zone confirms a short position, and a break of the 50 level confirms a long position.
📝 Final Thoughts
This analysis reflects our opinions and is not financial advice.
Share your thoughts in the comments, and don’t forget to share this analysis with your friends! ❤️

Axie Infinity (AXS)🎯 Introduction
AXS (Axie Infinity Shards) is the native token of the Axie Infinity ecosystem, a popular blockchain-based game operating on the "Play-to-Earn" model. Players can earn AXS tokens by breeding, battling, and trading digital creatures known as "Axies." This token is also used in governance mechanisms, staking, and in-game transactions. The growth in AXS’s value is tied to the ongoing development of the game and its wider adoption within the cryptocurrency world.
📊 AXS Technical Analysis
Current Status:
On the weekly timeframe, AXS is in a long-term range-bound zone:
📈 Range High: Red zone (11.186 - 12.605)
📉 Range Low: Gray zone (3.840 - 4.414)
Key Support and Resistance Zones:
Daily Support: Purple zone (5.581 - 5.932)
This zone has acted as a key support level. If lost, the price is likely to fall toward the lower range (gray zone).
Daily Resistance: Yellow zone (6.910 - 7.328)
Breaking through this level could trigger a price move towards the range high (red zone).
Upcoming Scenarios:
🟢 Bullish Scenario:
If the purple support zone holds and the yellow resistance is broken:
Move towards the range high (red zone).
A breakout above the red zone will lead to price targets based on Fibonacci levels:
🎯 TP1: 20.007 - 24.056
🎯 TP2: 41.929 - 48.315
🎯 TP3: 67.896 - 77.108
Important Note: At each of these targets, profit-taking 💵 is strongly advised.
🔴 Bearish Scenario:
If the purple support zone is lost, the price may drop towards the lower range (gray zone).
🎯 Suggested Entry Points:
Break above the daily yellow resistance with a stop loss below the gray zone.
Break above the red resistance with a stop loss below the purple zone.
Indicators and Volume:
RSI:
Crossing above the midpoint of the RSI may indicate a bullish move.
Entering the Overbought region could lead to sharp upward movements 🚀.
📊 Volume Analysis:
Increased volume during resistance breaks is crucial; otherwise, there’s a higher risk of false breakouts.
📌 Summary:
AXS is currently at a critical level. Price behavior in relation to the identified support and resistance zones will determine the future trend. Effective risk management through stop-loss and close monitoring of trading volume are key to success in trading this coin. 💡
Recommendation: Always consider the overall market conditions and any related news regarding the Axie Infinity project before making trading decisions.

Axie Infinity to Surge 87%Axie Infinity (AXS) is ready to roar with a projected 87% price surge from its current level of $6.25. If it continues its current upward trajectory, we could see price reach $11.70, representing a substantial gain.

AXS-4h- Accumulation RangeAXS-4h- Accumulation Range
REMEMBER that a lot of investors sell stocks or crypto for fiscal conditions in 2024 to close the year.
For that, we have low buy liquidity , and even with that pressure on the price , AXS is trying to remaning in the same range as 1 week ago, so a breakout can restart a new HH , so patience.
Im bullish on AXS if 7.0 will be broken and confirmed as support.

$ AXS | How do I expect to see AXS in coming weeksLet’s dive into another crypto asset analysis from the gaming sector to see if it has any chance to make us more money. This time I picked Axie Infinity with the AXS ticker. Most have heard of this famous project, but for those who have not known about the project, here is the CMC info on BINANCE:AXSUSDT
Axie Infinity is a blockchain-based trading and battling game that is partially owned and operated by its players.
Inspired by popular games like Pokémon and Tamagotchi, Axie Infinity allows players to collect, breed, raise, battle and trade token-based creatures known as Axies.
These Axies can take various forms, and there are more than 500 different body parts available, including aquatic, beast, bird, bug, plant and reptile parts. Parts from each type class come in four different rarity scales: common, rare, ultra rare and legendary — and Axies can have any combination of body parts, making them highly variable and often rare and unique.
Each Axie is a non-fungible token (NFT) with different attributes and strengths and can be entered into 3v3 battles, with the winning team earning more experience (exp) points that are used to level up an Axie's stats or evolve their body parts. These Axies can be bred together to produce new and unique offspring, which can be used or sold on the Axie marketplace.
The Axie Infinity ecosystem also has its own unique governance token, known as Axie Infinity Shards (AXS). These are used to participate in key governance votes and will give holders a say in how funds in the Axie Community Treasury are spent.
BINANCE:AXSUSDT
Market Cap: $ 1.45 B
Market Cap Rank: 95
Market Price: 9.31 $
ATH: $ 165 (-94%)
ATL: $ 0.1234 (+7414%)
Technical highlights:
- W1:
Trend:
Price has been in a parallel channel for 800 days. We had the last LL in Nov.2022 at $ 4. After that price tested that level twice and both times bounced. Price managed to break local resistance level from $ 6.00 to $ 6.6 with sharp candle and good volume. That was a clean break through but price remains in the parallel channel. The point is, price trend from downtrend turned to sideways and many times (not all times) sideways after a long downtrend means accumulation phase. Still we need to check volume and I checked OBV. OBV increased in this sideway phase (769m to 885m) so people bought more in this 800 days.
the next hints.
MA: Price holding above MA20 in monthly time frame. In the weekly time frame, MA20 located below MA50 but with the help and support of MA20, price jumped above MA50 at $ 6.94. MA50 acted as support and been tested successfully last week. On the other hand, in the daily time frame, price hovers above MA20, 50, and 200 and says bulls are in control.
RSI: The value is around 67.9 and is strong in the weekly time frame, which supports the local bullish trend direction. The RSI value in the daily time frame is 68 and it’s almost at the same value of W1. The difference is the RSI in D1 turned into overbought twice and printed a bearish divergence. So, I think there will be a cooldown before any major growth for a healthier growth.
Stoch RSI: The Stochastic RSI in W1 is in the overbought zone. That’s another reason to expect a retracement.
The Darvas Box:
Charts sometimes create patterns with repeating results. That’s why we use them to predict the next move of the trend. In the accumulation phase, there are many patterns that can help us earn profit by following them, but most of them need to be observed and backtested every day to see if they’re still working and reliable. The Dravas box is one of the patterns that can be seen in accumulation periods. Simply put, it’s a sideways (trend must clarify the range high and low) move that eventually breaks above the 52-week high with increased volume. In this chart, the price is still located below the 52-week high ($13.5) and it is still early to call it a box, but if that happens anytime, then the price will most of the time increase for days.
In addition to volume increase, we must observe the absorption of supply at 52 weeks' high. Meaning the price needs to stick right below that level for a few days before the breakout, and it’s better to see OBV increase for more confirmation.
Gaming tokens are still underwater and haven’t moved like other assets like MEME coins, but I believe this is a good time to pick some of the best gaming tokens with real use cases and a well-known team.
In my point of view, channels play an important role in trend direction and targets.
Supports:
$ 8.00 at Ma20 in D1
$ 7.00 at Ma50 in W1
$ 6.00 last known resistance break
Resistances:
$ 10.7 D1 Supply zone
$ 13.50 Range high / 52 weeks high
$ 19.00
$ 23.00 MA200 in W1
$ 45.00
$ 65.00 W1 local high
$ 100 W1 supply
Conclusion:
All these opinions are mine and can be wrong, so please DYOR.
This token is one of the best gaming token with many users and strong community. I will buy partially on the possible pullback. Please always do the risk management.
** In addition to the volume increase, we must observe the absorption of supply at the 52-week high. This means that the price needs to stick right below that level for a few days before I need more energy to carry on, which is provided by your support. Don't forget to hit boost, share, and comment on your point of view with me. **
My strategy goes as below:
🛒 Pair: AXS/ USDT 🛒
👑 Bitcharge 👑
🕰 08/12/2024 🕰
POSITION: 🟢"Buy"🟢
2 % of capital
🛒 Buy: $ 9.3 (10%) – $ 8 (20%) – $ 7 (30%) - $6 (40%)🛒
👉Sell Targets👈
🎯TP1: $ 10.6 🥉
🎯TP2: $ 12 🥈
🎯TP3: $ 13.4 🥇
🎯TP4: $ 15 🚁
🎯TP5: $ 17 ✈️
🎯TP6: $ 19 🚀
🎯TP7: $ 23 🛰
🎯TP8: $ 33 🛰
🎯TP9: $ 45 ✨
🎯TP10: $ 55 ⭐️
🎯TP11: $ 65 💫
🎯TP12: $ 75 🪐
🎯TP13: $ 85 🌞
🎯TP10: $ 98 ⭐️
🎯TP11: $ 110 💫
⛔️ SL: $ 5.10 ⛔️ by closing W1 Below
--Stay rich--

#AXSUSDT #1D (Bybit) Big falling wedge breakoutAxie Infinity regained 50MA support after a long downtrend, looks ready for mid-term recovery towards 200MA resistance.
⚡️⚡️ #AXS/USDT ⚡️⚡️
Exchanges: ByBit USDT
Signal Type: Regular (Long)
Leverage: Isolated (2.0X)
Amount: 4.6%
Current Price:
5.202
Entry Targets:
1) 4.854
Take-Profit Targets:
1) 6.947
Stop Targets:
1) 3.805
Published By: @Zblaba
NYSE:AXS BYBIT:AXSUSDT.P #Axie #NFT #P2E axieinfinity.com
Risk/Reward= 1:2.0
Expected Profit= +86.2%
Possible Loss= -43.2%
Estimated Gaintime= 1-2 months

Axie Infinity (AXS)Axie Infinity is a blockchain-based trading and battling game in which you can collect, breed, raise, battle, and trade NFT token-based creatures known as Axies. Anyway, after the super upward wave of AXS finished, it entered into a correction, a long one. Now, it seems AXS is trying to break the downtrend line. If successful, the next impulse wave might have begun.

Trading opportunity for AXSUSDTBased on technical factors there is a Buy position in :
📊 AXSUSDT
🔵 Buy Now
🪫Stop loss 5.300
🔋Target 1 6.500
🔋Target 2 7.500
🔋Target 3 8.600
💸RISK : 1%
We hope it is profitable for you ❤️
Please support our activity with your likes👍 and comments📝

#axs is getting ready for moving up! #axs is gaining momentum for increase continuation. While scores by ScorehoodAI seems positive, a try for resistance test will not be a surprise. Let's follow closer!

#AXSUSDT On the Edge of a Major Breakout From Descending ChannelYello, Paradisers! Are you ready for what could be a game-changing move in the #AXS market? Let's look at the latest analysis of #AXSUSDT:
💎We're closely monitoring the strong potential for a bullish continuation from a critical support zone at $4.47. For those tracking #AXS, the signs are clear—#AxieInfinity is gearing up for a breakout from the descending channel formation, and it could happen soon.
💎Currently, NYSE:AXS is following a descending channel pattern, and a breakout from this structure could send prices soaring. The first key target after a breakout is the minor resistance at $6.01. If #AXS holds steady above $6.018, we could be on the verge of a significant rally.
💎Historically, we’ve seen explosive moves like this, and a breakout above the critical $7.63 resistance could pave the way for even higher resistance zones.
💎But if momentum weakens near this key demand zone, we could witness a pullback to the lower demand area around $3.82. A daily close below $3.82 would invalidate the bullish setup and open the door to further declines.
Stay focused, patient, and disciplined Paradisers.
MyCryptoParadise
iFeel the success🌴

AXS (Axie Infinity) Falling WedgeTrade setup : Price is in a Downtrend, however, it's trading in a Falling Wedge pattern, which typically resolves in a bullish breakout and a trend reversal. We wait for such a breakout.
Patterns : Falling Wedge Usually results in a bullish breakout . When price breaks the upper trend line the price is expected to trend higher. Emerging patterns (before a breakout occurs) can be traded by swing traders between the convergence lines; however, most traders should wait for a completed pattern with a breakout and then place a BUY order. Learn to trade chart patterns in Lesson 8.
Trend : Short-term trend is Strong Down, Medium-term trend is Strong Down and Long-term trend is Strong Down.
Momentum : Price is Oversold currently, based on RSI-14 levels (RSI < 30).
Support and Resistance : Nearest Support Zone is $4.00. Nearest Resistance Zone is $7.00, then $9.00.

AXSUSDT Axie Infinity 1W-TIMEFRAME ANALYSIS💥AXSUSDT Axie Infinity 1W-TIMEFRAME ANALYSIS
💗Hello ladies and gentlemen
This is my new idea for 💥AXS Axie Infinity
I hope my idea is clear
Support me by like and share thank you
Stay Safe💯💲💲💲
Good luck💰😍

Axie Infinity: Seems extremely bullish!AXS is now down almost 96% from its previous ATH and is about to reach an important support level, which is a strong demand zone at $4. It can recover to its ATH of around $164, and if there is significant hype and AXS performs exceptionally well in the upcoming bull run, hitting targets above $1,000 is not impossible, IMO.

AXSIt seems that according to the maintenance of the upward trend line (we do not have a LL on the price chart), if the resistance range of $8.7 is completely consumed; The probability of the continuation of the upward trend similar to the scenario is high.
If this specified resistance area is not completely consumed, we expect a downward trend and the bullish scenario is invalid.
At the moment, we do not have a signal for a bearish trend on the price chart. On the other hand, a relatively attractive candlestick pattern tangential to the upward trend line has been formed for us.
What do you think?

Critical $8.5 ResistanceAXS is currently moving along its upward trend line, which serves as strong support. It is gradually approaching a key resistance level around the $8.5 mark. Traders should pay close attention to the price action as it nears this resistance. A successful break above this level could lead to a continuation of the upward trend, while failure to break through may result in a price correction. Careful monitoring of the price behavior around this resistance level is crucial for making informed trading decisions.

AXSUSDT - 4H Bullish signsThe AXSUSDT 4-hour chart indicates a significant bullish breakout from a descending triangle pattern, typically a continuation pattern but here suggesting a reversal.
The price has breached the upper trendline of the triangle, signaling a potential upward movement.
The target for this breakout is set at approximately $9.40, as depicted by the green highlighted zone.
This target aligns with previous resistance levels observed in early April. The overall bullish momentum is supported by increasing volume, indicating strong buying interest.

Axie Infinity breaking above inverse head and shoulders necklineAs with other gaming and metaverse cryptos, it appears Axie Infinity is waking up from its slumber as well. No guarantee yet that it wont take another temporary dip below the neckline before fully validating the breakout but it seems pretty likely that validation is near. It appears all the metaverse and gaming cryptos want to take the reigns of the market over from the meme coins and may even do so here soon. *not financial advice*
