Axis Bank | Gann Square of 9 – 45° Reaction Zone | 12 Apr 2022This idea highlights a historical intraday case study on Axis Bank Ltd, demonstrating how Gann Square of 9 price-degree mapping helps identify logical reaction zones.
On 12 April 2022, Axis Bank showed a textbook example of degree-based price behavior using Gann’s geometric framework.
📈 Price–Degree Structure
0° reference: ₹777.80
45° projection: ₹791.81
90° projection: ₹805.94
Price advanced from the 0° base and completed the 45° distance well within the intraday time window.
⏱️ Gann Time Principle
As per Gann’s intraday methodology:
When 45° is reached before 2:30 PM, it often acts as a reaction or resistance zone
In this session, price touched the 45° level and showed a clear reaction, validating the relevance of degree-based price geometry.
📐 Key Observation
Although price later moved toward the 90° level, it remained confined between the 45°–90° range, illustrating how Gann degrees often act as natural market boundaries rather than arbitrary levels.
🧠 Conclusion
This case demonstrates how converting price into degrees using the Gann Square of 9 allows traders to:
Anticipate logical reaction zones
Avoid emotional decision-making
Understand structure instead of chasing momentum
Disclaimer:
This idea is shared strictly for educational and analytical purposes only. It does not constitute any investment advice or trade recommendation.
AXISBANK

Axis Bank | Gann Square of 9 – No-Trade Case Study This idea presents a historical intraday case study on Axis Bank Ltd, highlighting how Gann Square of 9 degree rules help traders identify non-tradable sessions with clarity.
On 8 April 2022, Axis Bank initiated an upward move from the 0° reference near ₹789.
Using Gann Square of 9 calculations, the next key projection was the 45° level near ₹803.
Throughout the session, price failed to complete the 45° movement within the intraday time window, and no meaningful interaction occurred at the projected degree level.
As per Gann’s methodology, when price does not reach the expected degree within time, the session is classified as a no-trade day.
📐 Observed Gann Levels
0° → ₹789
45° → ₹803
🧠 Key Learning
Gann theory is not only about finding trades — it is equally about avoiding low-probability conditions.
This chart demonstrates:
Respect for degree boundaries
Absence of forced entries
Importance of patience and structure
Sometimes, no trade is the best trade.
Disclaimer:
This chart is shared strictly for educational and analytical purposes. It does not represent any trading recommendation.

Axis Bank | Gann Square of 9 – 45° Reversal Case Study | 4 Apr 2This idea documents a historical intraday case study on Axis Bank Ltd, demonstrating how Gann Square of 9 degree levels act as precise resistance zones.
On 4 April 2022, Axis Bank initiated an upward move from the 0° reference near ₹767. Using the Gann Square of 9 calculation, the 45° projection was identified near ₹781.
Price advanced steadily and formed a high at ₹780.55, coming within 0.5 points of the calculated 45° level.
This reaction fell well within the acceptable tolerance range and resulted in a clear intraday rejection from the 45° degree zone.
📐 Key Gann Levels Observed
0° → ₹767
45° → ₹781
🧠 Concept Highlight
According to Gann’s price-degree structure, when price approaches a 45° level within the intraday time window, it often behaves as a temporary resistance or reversal zone.
This example shows:
Respect for angular resistance
Precision of degree-based levels
How small deviations can still validate Gann structure
Disclaimer:
This chart is shared for educational and analytical purposes only. It does not constitute a buy or sell recommendation.

Axis Bank | Major Gann Levels – Neutral Day Case Study | 31 Mar This idea presents a historical intraday case study on Axis Bank Ltd, highlighting how Gann degree levels help traders identify when to stay out of the market.
On 31 March 2022, Axis Bank respected Gann geometry on both the upside and downside, but no valid degree completion occurred, resulting in a neutral, no-trade session.
🔹 Downside Analysis
Initial 0° reference was marked near ₹760.95
Price moved lower but failed to reach 45° at ₹751
As per Gann Totaliser rules, no long trade was allowed
🔹 Upside Analysis
After rebounding near ₹751.30, this low became the new 0°
Upside 45° was calculated near ₹765
Price did not touch the 45° level
Hence, no short trade was triggered
📐 Major Gann Degree Levels Used
Upside Degrees
0° → 751
45° → 765
90° → 779
135° → 793
180° → 807
Downside Degrees
0° → 761
45° → 747
90° → 734
135° → 720
180° → 707
🧠 Key Learning
Gann’s method is not about constant trading.
When price does not complete a degree within time, the correct decision is no trade.
This session clearly demonstrates:
Respect for angular boundaries
Market neutrality
Discipline over prediction
Disclaimer:
This idea is shared strictly for educational and chart-analysis purposes only. It is not a buy or sell recommendation.

Axis Bank | Gann Numbers – No Trade Day Case Study | 29 Mar 2022This idea shares an intraday historical case study on Axis Bank Ltd, demonstrating how Gann Numbers and price geometry help traders decide when NOT to trade.
On 29 March 2022, Axis Bank opened near the 0° reference level at ₹741.50. Using Gann Number calculations, the following degree-based levels were projected for the session:
0° = ₹741
45° = ₹727
90° = ₹714
135° = ₹701
180° = ₹688
During the session, price moved lower from the 0° zone but failed to reach the 45° level within the valid time window. As per Gann Circle rules, no angular completion meant no valid trade setup.
This resulted in a NO-TRADE DAY, which is an equally important outcome in rule-based trading.
📌 Gann Rule Highlighted
Trade consideration only when:
45° is reached before 14:30
or 90° is reached before 14:45
If no degree is completed → stand aside
🧠 Key Learning
Gann’s methodology is not about trading every day.
It is about waiting for mathematical alignment between price and time.
When conditions are not met, discipline protects capital.
Disclaimer:
This idea is shared strictly for educational and analytical purposes only. It is not a trading recommendation.

Axis Bank | Gann Square of 9 – Intraday Case Study | May 20, 202This idea shares a historical intraday case study on Axis Bank Ltd using WD Gann’s Square of 9 to observe price movement through angular degrees.
On 20 May 2022, Axis Bank began the session near ₹658, which was treated as the 0° reference level for the day. From this base, price started a steady upward movement.
Using Gann Square of 9 calculations, the 45° level for the session was derived at ₹671.
By mid-session, the stock reached this 45° degree value, completing its normal angular rotation. Although there was no sharp rejection at that moment, price respected the 45° level and continued to trade around it, eventually closing near the same angular zone.
This behavior aligns with Gann’s principle that markets often move in measured geometric steps, where completion of key degrees highlights areas of balance, pause, or potential reaction.
📌 Key Observations
0° reference at ₹658 guided the session structure
45° level at ₹671 acted as an important angular milestone
Price respected the degree level even without a strong reversal
Degree completion reflects market rhythm, not prediction
📘 Educational Insight
This example demonstrates how price–angle geometry can help traders study intraday behavior logically. Gann methods focus on structure and timing, allowing traders to analyze market movement without emotional bias.
Disclaimer:
This idea is shared strictly for educational and analytical purposes only. It is not a trading recommendation.

Axis Bank | Gann Degrees & Intraday Reversal | May 25, 2022This idea presents a historical intraday case study on Axis Bank using WD Gann degree calculations to analyze price behavior and reversal zones.
On 25 May 2022, Axis Bank opened with a downward bias. The intraday reference was established using the day’s high at ₹672, marked as the 0-degree (0°) level.
Based on Gann degree progression, the following levels were derived:
0° → ₹672
45° → ₹659
90° → ₹646
As price declined during the session, it approached the 45° level but did not complete the full degree movement before the late afternoon. Around 12:45 PM, the stock reacted sharply from ₹660.05, which was within 1 point of the calculated 45° level (₹659).
This reaction occurred inside acceptable price tolerance and aligned with Gann’s concept of degree-based support, after which the stock moved higher toward ₹667, forming a clean intraday recovery.
📌 Key Observations
Degree levels help define logical support and resistance
Minor deviations around exact levels are normal
Time + price alignment improves trade structure
Not every move needs indicators to be explained
📘 Educational Takeaway
This example shows how Gann geometry converts price movement into measurable zones, helping traders analyze intraday behavior with structure instead of emotion.
Disclaimer:
This chart study is shared for educational and analytical purposes only. It is not a trade recommendation.

Axis Bank | Gann Numbers & 45° Reversal – Intraday Case Study | This idea presents a historical intraday case study on Axis Bank Ltd, highlighting the use of Gann Numbers and angular price movement to study reversals.
On 14 September 2022, Axis Bank opened with bullish momentum. The 0° reference level for the session was identified at ₹794, based on the day’s price structure.
Using Gann Number calculations, the next key angular projection was derived:
0° = ₹794
45° = ₹808
As the session progressed, price advanced steadily and completed the 45° level before 14:30, which aligns with Gann’s time–price principles. After reaching this degree, Axis Bank showed clear rejection from the 45° zone, indicating a potential intraday SELL setup.
Although the full downside target was not achieved, price respected the angular level, validating the mathematical structure behind Gann’s approach.
📌 Key Takeaways
0° acts as the base reference for intraday structure
Completion of 45° before 14:30 often signals exhaustion
Rejection from degree levels reflects market balance
Focus is on geometry and timing, not prediction
📘 Educational Note
WD Gann’s methodology emphasizes that markets move in measured degrees, where price and time work together. Such case studies help traders analyze logical reversal zones without relying on indicators or emotions.
Disclaimer:
This idea is shared strictly for educational and analytical purposes only and is not investment advice.

Axis Bank | Gann Square of 9 Intraday Case Study | 15 Sept 2022This idea documents a historical intraday study of Axis Bank using the WD Gann Square of 9 to understand how price reacts at degree-based levels.
On 15 September 2022, Axis Bank showed downward momentum, with the day’s high at ₹806 taken as the 0-degree (0°) reference point.
Using Square of 9 calculations, the important projected levels were:
45° → ₹792
90° → ₹778
By before 2:30 PM, price completed its 45° movement and reached ₹792, aligning with Gann’s concept of normal intraday capacity. At this level, price stabilized and showed a supportive reaction, leading to a short-term upward move.
Although the rebound was limited and did not extend significantly beyond the intraday range, the price behavior respected the mathematical structure of the Square of 9, reinforcing how degree-based levels can act as logical support zones.
This case demonstrates that:
Not every setup produces large profits
Structure, timing, and discipline matter more than outcome
Gann levels help traders avoid emotional decision-making
📌 Key Square of 9 Levels
0° → ₹806
45° → ₹792
90° → ₹778
📘 Educational Notes
45° completion before 2:30 PM often marks a reaction zone
Minor tolerance around levels is common
Square of 9 provides price clarity, not prediction certainty
Disclaimer:
This idea is shared strictly for educational and chart-study purposes only. It is not trading advice.

Axis Bank | Gann Square of 9 Intraday Case Study | 6 Apr 2023This idea presents a historical intraday case study on Axis Bank, analysed using the WD Gann Square of 9 to observe price behavior near degree-based levels.
On 6 April 2023, Axis Bank began the session with downward momentum, and the day’s high at ₹863 was considered the 0-degree (0°) reference point.
Using Square of 9 calculations, the next important level was:
45° → ₹848
According to Gann’s price–degree relationship, when price approaches the 45° level within a small tolerance, it often acts as a temporary support or reversal zone.
By around 2:15 PM, Axis Bank reached ₹849, which was within 1 point of the calculated 45° level (₹848). This aligned with the commonly observed tolerance range in Gann-based studies.
From this area, price showed a modest upward reaction, moving toward the ₹854 zone before the session ended.
This example highlights how mathematical price mapping using Square of 9 can help traders identify logical intraday reaction zones, even when the move is limited in size.
📌 Key Square of 9 Levels
0° → ₹863
45° → ₹848
📘 Educational Observations
Square of 9 defines measured price capacity
Small tolerance near degree levels is common
Not every reaction becomes a large trend
Structure and consistency matter more than outcome size
Disclaimer:
This idea is shared strictly for educational and chart-study purposes only. It is not trading advice.

Axis Bank | Gann Square of 9 Intraday Case Study | 16 Sep 2022This idea documents a historical intraday case study on Axis Bank, analysed using the WD Gann Square of 9 to understand price behavior and logical reversal zones.
On 16 September 2022, Axis Bank opened with upward momentum, and the day’s low at ₹776 was taken as the 0-degree (0°) reference point.
Using Square of 9 calculations, the following degree-based price levels were identified:
0° → ₹776
45° → ₹790
90° → ₹804
As per Gann’s price–time relationship, when price approaches or completes the 45° level before the 2:30 PM time threshold, it often signals temporary exhaustion and a potential reversal zone.
At around 12:30 PM, Axis Bank reached the 45° level near ₹790 and faced clear rejection within the expected tolerance range. Following this, price reversed sharply toward the downside, reacting down to the ₹778 region.
This case highlights how degree-based price mapping, combined with time awareness, helps define structured intraday resistance zones, allowing traders to assess opportunities logically instead of reacting emotionally.
📌 Key Square of 9 Levels
0° → ₹776
45° → ₹790
90° → ₹804
📘 Educational Takeaways
Square of 9 helps quantify normal price capacity
45° often acts as a decision or reversal zone
Time confirmation improves probability
Structured levels reduce emotional trading
Disclaimer:
This idea is shared strictly for educational and chart-study purposes only. It does not constitute trading advice.

Axis Bank | Gann Square of 9 Intraday Case Study | 20 Sep 2022This idea presents a historical intraday case study on Axis Bank, analysed using the WD Gann Square of 9 to understand price behavior and reversal zones.
On 20 September 2022, Axis Bank initiated an upward move from the 0-degree (0°) reference level at ₹802.
Using Square of 9 calculations, the 45-degree (45°) level was identified at ₹816, representing the stock’s normal intraday price capacity.
By around 12:30 PM, Axis Bank reached the 45° level well before the 2:30 PM time threshold.
At this level, price faced clear rejection and reversed, validating the importance of the 45° degree as a resistance and potential reversal zone.
As per WD Gann’s price–time geometry, early completion of a degree-based move often signals exhaustion, increasing the probability of a counter-move.
This case demonstrates how degree-based price mapping, when combined with time awareness, can help traders identify logical intraday resistance zones instead of relying on guesswork or lagging indicators.
📌 Key Square of 9 Levels
0° → ₹802
45° → ₹816
📘 Educational Insights
Square of 9 defines price symmetry
Time confirms strength or exhaustion
Early 45° completion increases reversal probability
Structured levels reduce emotional decision-making
Disclaimer:
This idea is shared strictly for educational and chart-study purposes only. It is not trading advice.

Axis Bank | Gann Square of 9 Intraday Case Study | 29 Sep 2022This idea demonstrates a historical intraday case study using the WD Gann Square of 9 to identify price capacity and reversal zones.
On 29 September 2022, Axis Bank started the session near ₹730, which was used as the 0-degree (0°) reference on the Square of 9.
Using Square of 9 calculations, the next important degree levels were identified as:
45° → ₹717
90° → ₹703
During the mid-session decline, price reached the 45-degree level (₹717) well before the 2:30 PM time threshold, completing its normal intraday price capacity.
As per Gann’s price–time geometry, early completion of a degree move often leads to a temporary reaction or reversal.
Axis Bank respected this level and reacted from the ₹717 zone, confirming the validity of the Square of 9 projection.
This case highlights how degree-based price mapping, when combined with time awareness, can help traders define logical intraday reaction zones instead of relying on lagging indicators.
📌 Key Square of 9 Levels
0° → 730
45° → 717
90° → 703
📘 Educational Takeaways
Square of 9 defines price symmetry
Time confirms strength or exhaustion
Early degree completion increases reaction probability
Structure replaces emotional trading decisions
Disclaimer:
This idea is shared for educational and chart-study purposes only. It does not constitute trading advice.

Axis Bank | Gann Angle Intraday Case Study | 03 Oct 2022This idea presents a historical intraday study using WD Gann’s price–degree (angle) concept to identify normal price capacity and reaction zones.
On 03 October 2022, Axis Bank opened with upward momentum.
The intraday low near ₹726 was selected as the 0-degree (0°) reference point, following classical Gann methodology.
Using the Gann Angle projection, the next important degree level was calculated as:
45° → ₹740
Price reached this 45-degree level very early in the session, completing its normal intraday price capacity well before the 2:30 PM time threshold.
According to Gann’s price–time balance principle, early completion of a degree move often indicates temporary exhaustion.
From this zone, Axis Bank reacted precisely and moved lower, validating the 45° level as a short-term reaction area.
This case demonstrates how degree-based price projections help traders define logical reaction zones in advance, instead of relying on indicators or emotional decision-making.
📌 Key Gann Angle Levels
0° → 726
45° → 740
📘 Educational Notes
Gann Angles measure price capacity
Time confirms strength or exhaustion
Early degree completion increases reaction probability
Geometry offers structure over guesswork
Disclaimer:
This analysis is shared for educational and chart-study purposes only. It is not a recommendation to buy or sell any security.

Axis Bank | Gann Angle Intraday Case Study | 23 Mar 2023This idea demonstrates the Gann Angle (price–degree) method for identifying normal intraday price capacity and potential reversal zones using market geometry.
On 23 March 2023, Axis Bank opened with upward momentum.
The initial intraday low near ₹845 was selected as the 0-degree (0°) reference point, following standard Gann angle principles.
Using the Gann Angle projection, the 45-degree level was calculated at:
45° → ₹860
Price reached this 45-degree level around 10:30 AM, completing its normal intraday price capacity well before the 2:30 PM timing window.
As per Gann’s price–time relationship, early completion of a degree level often signals temporary exhaustion.
From this zone, Axis Bank reacted precisely and moved lower, offering a logical intraday downside move.
This case highlights how price–angle analysis can help traders anticipate reaction zones in advance, instead of responding emotionally to market fluctuations.
📌 Key Gann Angle Levels
0° → 845
45° → 860
🔍 Educational Insights
Gann Angles define price capacity
Time confirms strength or exhaustion
Early degree completion increases reversal probability
Structure > indicators
Disclaimer:
This chart is shared for educational and analytical purposes only and does not constitute trading or investment advice.

Axis Bank | Gann Square of 9 Intraday Case Study | 21 Apr 2023This idea illustrates how WD Gann’s Square of 9 helps identify normal intraday price capacity and high-probability reversal zones using price–time geometry.
On 21 April 2023, Axis Bank started showing downside momentum from the second 15-minute candle.
To measure the expected intraday decline, the day’s high near ₹873.85 was selected as the 0-degree (0°) reference point, following standard Gann methodology.
Using the Gann Square of 9, the stock’s normal intraday downside level was projected at:
45° → ₹858
Price reached the 45-degree level around 1:00 PM, completing its normal price capacity well before the ideal Gann timing window near 2:30 PM.
According to Gann’s time–price principles, early completion of a degree level often signals temporary exhaustion.
From this zone, Axis Bank reacted strongly and reversed upward, offering clean intraday recovery movement.
This case demonstrates how price geometry combined with time awareness can help traders define logical reaction zones, rather than relying on indicators or guesswork.
📌 Key Gann Levels
0° → 873.85
45° → 858
🔍 Educational Takeaways
Square of 9 defines price capacity
Time determines when reactions are likely
Early completion increases reversal probability
Structure > indicators
Disclaimer:
This idea is shared strictly for educational and analytical purposes only. It does not constitute trading or investment advice.

ICICI Bank | Gann Square of 9 Intraday Case Study | 06 Apr 2023This chart presents a classical WD Gann Square of 9 intraday setup, where price completed its normal capacity early in time, leading to a high-probability reversal.
On 06 April 2023, ICICI Bank started gaining upside momentum from the third 15-minute candle.
The intraday low at ₹875 was selected as the 0-degree (0°) reference point, following standard Gann methodology.
Using the Gann Square of 9, the stock’s normal intraday upside level was projected at:
45° → ₹890
Price reached the 45-degree level around 11:15 AM, which is significantly earlier than the ideal Gann time window near 2:30 PM.
As per Gann’s time–price relationship, early completion of a degree level often indicates temporary exhaustion.
The stock reacted precisely from this zone and reversed lower, offering clear intraday downside movement.
This case highlights how price geometry combined with time analysis helps traders identify logical reaction zones, rather than depending on indicators or assumptions.
📌 Key Gann Levels
0° → 875
45° → 890
🔍 Learning Points
Square of 9 defines price capacity
Time determines when that capacity becomes effective
Early completion = higher probability of reaction
Structure > indicators
Disclaimer:
This idea is shared for educational and analytical purposes only. It is not a trading or investment recommendation.

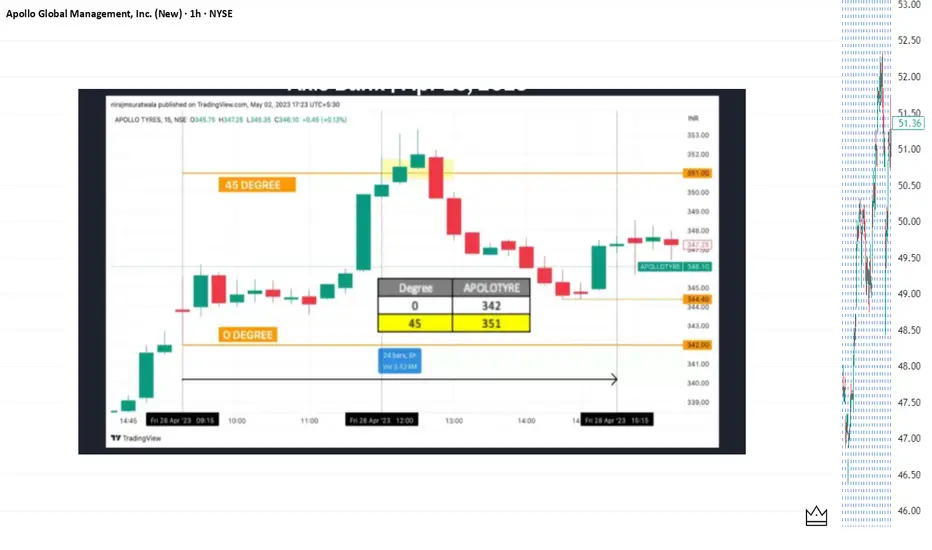
Apollo Tyres | Gann Square of 9 Intraday Case Study | 28 Apr 202This chart demonstrates a classic Gann Square of 9 intraday application, where price reached its normal capacity early in time, leading to a logical reversal.
On 28 April 2023, Apollo Tyres opened with strong upward momentum.
The low of the first 15-minute candle (₹342) was selected as the 0-degree (0°) reference point, following standard WD Gann methodology.
Using the Gann Square of 9, the stock’s normal intraday upside capacity was projected at:
45° → ₹351
Price reached the 45-degree level around 12:00 PM, which is well before the ideal Gann timing window near 2:30 PM.
According to Gann’s time–price relationship, early completion of a degree level increases the probability of exhaustion.
The market reacted immediately from this zone and moved lower, offering clear and logical intraday selling opportunities.
This example highlights how price geometry combined with time analysis helps traders identify high-probability reaction zones, rather than relying on guesswork.
📌 Key Gann Levels
0° → 342
45° → 351
🔍 Key Takeaways
Square of 9 defines price capacity
Time defines when that capacity matters
Early degree completion often signals exhaustion
Geometry + time = structured intraday decisions
Disclaimer:
This idea is shared strictly for educational and analytical purposes. It does not constitute investment or trading advice.
Axis Bank | Gann Square of 9 Failure Case Study | 10 Jul 2023This chart highlights an important learning example of the Gann Square of 9 — where price alignment occurred, but time confirmation failed.
On 10 July 2023, Axis Bank started a downside move.
The day’s high at 986 was selected as the 0-degree (0°) reference point, following standard Gann price–angle methodology.
Using the Square of 9, the following intraday levels were projected:
45° → 970
90° → 955
The stock reached the 45-degree level (970) around 1:00 PM, which is earlier than the ideal Gann timing window (around 2:30 PM).
While a short-term reaction is often expected near the 45° level, price failed to hold and continued lower, eventually trading near 965, moving toward the next degree zone.
This case reinforces a critical Gann principle:
Price alone is not sufficient — time confirmation is equally important.
Studying such failure structures improves discipline, expectation management, and probabilistic thinking in intraday trading.
🔍 Key Learning Points
Square of 9 defines price structure
Time determines probability
Early achievement of a degree level does not guarantee reversal
Failure cases are essential for refining execution rules
📌 Key Gann Levels
0° → 986
45° → 970
90° → 955
Disclaimer:
This idea is shared strictly for educational and analytical purposes. It does not constitute trading or investment advice.

Axis Bank | Gann Square of 9 Intraday Case Study | 18 Aug 2023This chart presents a classical intraday application of the Gann Square of 9, focusing on price–degree balance rather than indicators.
On 18 August 2023, Axis Bank shifted into an upward structure after the 6th 15-minute candle.
The lowest price of that swing (931) was taken as the 0-degree (0°) reference, following traditional Gann methodology.
Using Square of 9 calculations, the 45-degree level was projected at:
45° → 946
This level represents the stock’s normal intraday upside capacity.
Price reached 946 by 10:30 AM, significantly earlier than the 2:30 PM time window.
According to Gann principles, early completion of price capacity often signals temporary exhaustion.
The market respected the 45-degree level, showing controlled reaction from that zone and offering a logical intraday decision area based on structure rather than assumption.
🔍 Key Observations
Square of 9 defines measured price objectives
Time acts as a confirmation factor
Early achievement of capacity increases reaction probability
Focus remains on price–degree geometry
📌 Key Gann Levels
0° → 931
45° → 946
Disclaimer:
This analysis is shared for educational purposes only and does not constitute trading or investment advice.

Axis Bank | Gann Square of 9 Intraday Case Study | 28 Jun 2023This chart demonstrates a pure intraday application of Gann Square of 9 using price–degree structure.
On 28 June 2023, Axis Bank showed upward continuation after the second 15-minute candle.
The lowest price of that structure (967) was taken as the 0-degree (0°) reference point, in line with classical Gann methodology.
Using Square of 9 calculations, the 45-degree level was projected at:
45° → 983
This level represents the normal intraday upside capacity of price.
By 2:15 PM, Axis Bank reached the 45-degree level, slightly ahead of the ideal 2:30 PM timing window.
As per Gann rules, early completion of price capacity often leads to reaction or reversal.
Price reacted precisely from the 983 zone, confirming the price–degree balance and providing a clear intraday reaction area.
🔍 Key Observations
Square of 9 defines measured price capacity
Time plays a confirming role, not a prediction
Early arrival at capacity increases reaction probability
Focus remains on structure, not signals
📌 Key Gann Levels
0° → 967
45° → 983
Disclaimer:
This analysis is shared for educational purposes only and does not constitute trading or investment advice.

Axis Bank | Gann Square of 9 Intraday Case Study | 20 Oct 2023This idea highlights an intraday price-reaction study in Axis Bank using the Gann Square of 9 and classical price–angle logic.
On 20 October 2023, Axis Bank started the session with downward momentum.
The first 15-minute structure defined the reference point, where 993 was used as the 0-degree (0°) base.
Using Square of 9 calculations, the 45-degree level was projected at:
45° → 977
This level represented the stock’s normal intraday downside capacity.
Price reached 977.75 around 12:45 PM, reacting precisely within a 1-point tolerance, which aligns with standard Gann accuracy ranges.
From this zone, Axis Bank showed a clear intraday bounce, moving back toward 985+ levels, validating the projected price-angle support.
🔍 Key Observations
Square of 9 helps define logical intraday capacity
Angle levels act as reaction zones, not predictions
Price respected the calculated level within normal variance
Focus is on structure and price behavior, not signals
📌 Key Gann Levels
0° → 993
45° → 977
Disclaimer:
This chart is shared strictly for educational and analytical purposes. It does not constitute trading or investment advice.
