AXSUSDT Ready to Explode? Channel Break Could Trigger Relief!The Axie Infinity / USDT pair on the 4H timeframe is still within a mid-term downtrend structure after failing to hold the supply area around 2.9 – 3.0 USDT.
Price action continues forming consistent Lower Highs (LH) and Lower Lows (LL), indicating strong seller dominance. Currently, price is consolidating right above a crucial support block following rejection from the main trendline resistance.
---
Structure & Pattern Formation
1. Descending Channel / Falling Wedge Hybrid
Two descending trendlines are visible:
Resistance trendline (red) → connecting LHs.
Support trendline (yellow) → holding LLs.
Structure is tightening → indicates volatility compression.
This type of pattern often results in:
Continuation if breakdown occurs.
Reversal if an upside breakout happens.
2. Support Block Demand Zone
The strong demand area is located at:
1.30 – 1.35 USDT
Key confluence factors:
Previous base before impulsive rally.
Multiple wick rejections.
Volume absorption showing buyer defense.
---
Key Levels
Resistance:
1.54 → Minor resistance / latest rejection.
1.65 → Mid-channel resistance.
1.90 → Horizontal resistance.
2.11 → Supply flip area.
2.65 → Major resistance.
2.94 – 3.00 → Macro supply / swing high.
Support:
1.30 – 1.35 → Major support block.
1.15 → Minor channel support.
0.91 → Extreme low / liquidity target.
---
Bullish Scenario
Bullish confirmation requires:
1. Breakout above the red resistance trendline.
2. Strong candle close above 1.54.
3. Successful retest turning resistance into support.
Upside targets:
1.65
1.90
2.11
2.65
2.94
Additional confirmation:
Volume expansion on breakout.
Bullish RSI divergence (if present).
Market structure shift from LH → HH.
Meaning:
Buyers escape channel pressure and initiate a mid-term reversal phase.
---
Bearish Scenario
Bearish continuation activates if:
1. The 1.30 – 1.35 support block breaks.
2. Candle closes below the demand zone.
3. Retest fails to reclaim the area.
Downside targets:
1.15
1.00 psychological level
0.91 (liquidity sweep zone)
A breakdown would confirm a new Lower Low, continuing the downtrend structure.
---
Conclusion
Primary trend: Bearish (mid-term)
Current position: Above key demand
Structure: Descending channel compression
Potential: Reversal on breakout / Dump on support loss
This is a decision zone.
Price reaction between 1.30 – 1.54 will determine whether AXS:
Starts a relief rally.
Or continues distribution lower.
#AXSUSDT #AXSAnalysis #CryptoTechnicalAnalysis #AltcoinSetup #DescendingChannel #SupportResistance #DemandZone #BreakoutSetup #TradingViewAnalysis #CryptoTrading #AltcoinSeason #PriceAction
Axsusdtlong

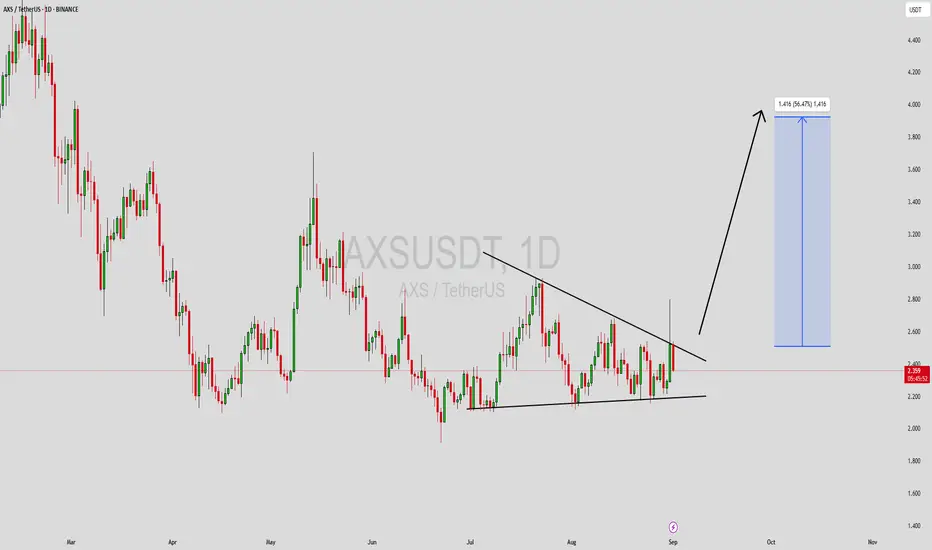
AXS: two 40% pumps are coming...Hi!
AXS remains in a clear uptrend, trading cleanly inside a rising channel. Price held the mid-range support and is now pushing higher, suggesting buyers are still in control. As long as the lower channel support holds, the structure favors continuation.
The next upside objectives align with the marked resistance zones, with the first target near the prior high and a higher extension toward the upper channel. Overall bias stays bullish while price remains above support.
the first target area: $2.65
the second target area: $3.3

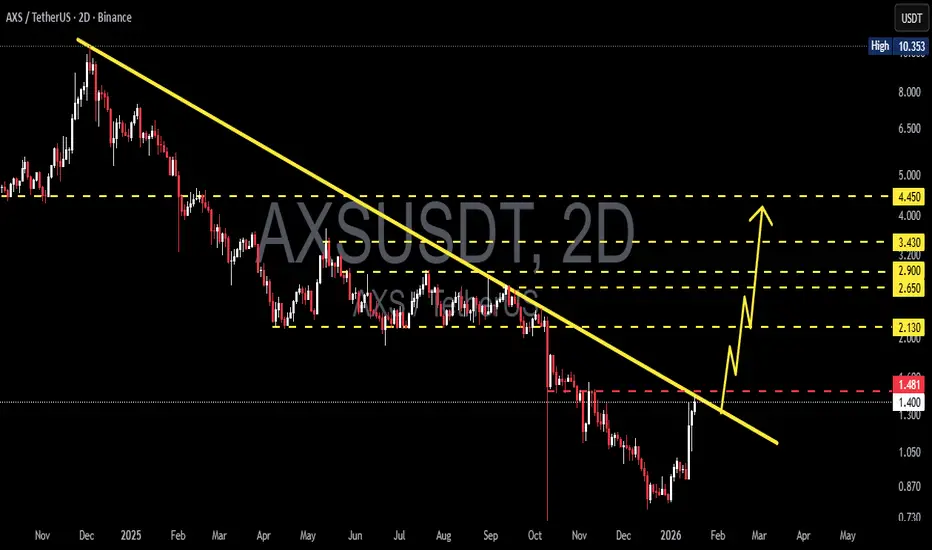
AXS/USDT at Decision Zone: Trendline Break or Bearish?On the 2-Day (2D) timeframe, AXS/USDT remains in a medium to long-term bearish trend. Since topping near the 10 USDT area, price has consistently formed lower highs and lower lows, confirming strong selling pressure. However, recent price action shows an aggressive rebound from the lower demand zone, bringing price back toward the descending trendline resistance.
---
Pattern & Price Structure
Descending Trendline (Bearish Structure):
The yellow descending trendline has capped price action since late 2024, acting as the main dynamic resistance.
Bearish Continuation Structure:
The bearish structure remains valid as long as price fails to break and close decisively above the trendline.
Rebound from Demand / Base Formation:
Price bounced from the lower demand area (around 0.8–0.9), forming a short-term higher low, but this alone is not sufficient to confirm a major trend reversal.
---
Key Levels
Resistance (Supply):
1.48 USDT → minor resistance & current reaction zone
2.13 USDT → key structural resistance
2.65 – 2.90 USDT → mid-range supply zone
3.43 – 4.45 USDT → major supply zone / previous distribution area
Support (Demand):
1.30 USDT → nearest support
0.87 – 0.75 USDT → strong demand zone & recent bounce area
---
Bullish Scenario
The bullish scenario is only valid with proper confirmation, not just a temporary spike.
Price breaks above the descending trendline and closes firmly above 1.48 USDT
Further upside targets:
2.13 USDT
2.65 – 2.90 USDT
With strong momentum and volume, extended targets lie at:
3.43 – 4.45 USDT
Note:
Without a confirmed close above resistance, the current move still carries a high risk of a bull trap.
---
Bearish Scenario
Bearish bias remains dominant as long as the descending trendline holds.
Rejection near 1.48 USDT / trendline
Price may revisit:
1.30 USDT
0.87 – 0.75 USDT
A breakdown below the lower demand zone would signal bearish continuation toward new lows.
---
Conclusion
AXS/USDT is currently at a critical decision zone. The recent rebound is still considered corrective until price clearly breaks and holds above the long-term descending trendline. Traders should wait for clear breakout or rejection confirmation, as the risk of a fake breakout remains elevated.
#AXS #AXSUSDT #CryptoAnalysis #Altcoin #TechnicalAnalysis #BearishTrend #Trendline #PriceAction #SupportResistance
AXSUSDT Forming Potential BreakoutAXSUSDT is showing signs of forming a potential breakout structure after a long period of consolidation. The chart setup indicates a tightening range with higher lows and lower highs, which often precedes a strong move in either direction. With the current market sentiment improving and investors beginning to accumulate positions, the probability of an upside breakout appears favorable. If momentum builds, this setup could drive AXS toward a strong bullish run.
The trading volume has been supportive, suggesting that market participants are closely watching this level for confirmation. A decisive breakout from the resistance trendline could trigger a wave of buying pressure, unlocking a move of around 40% to 50%+ from the current levels. This makes AXSUSDT an attractive opportunity for traders looking for short to mid-term gains.
Market participants are increasingly paying attention to projects like AXS, which have established strong use cases and community support. The technical structure combined with renewed investor interest creates a promising environment for further upside potential. Should the breakout confirm, the momentum could drive price action into a new bullish phase.
✅ Show your support by hitting the like button and
✅ Leaving a comment below! (What is You opinion about this Coin)
Your feedback and engagement keep me inspired to share more insightful market analysis with you!
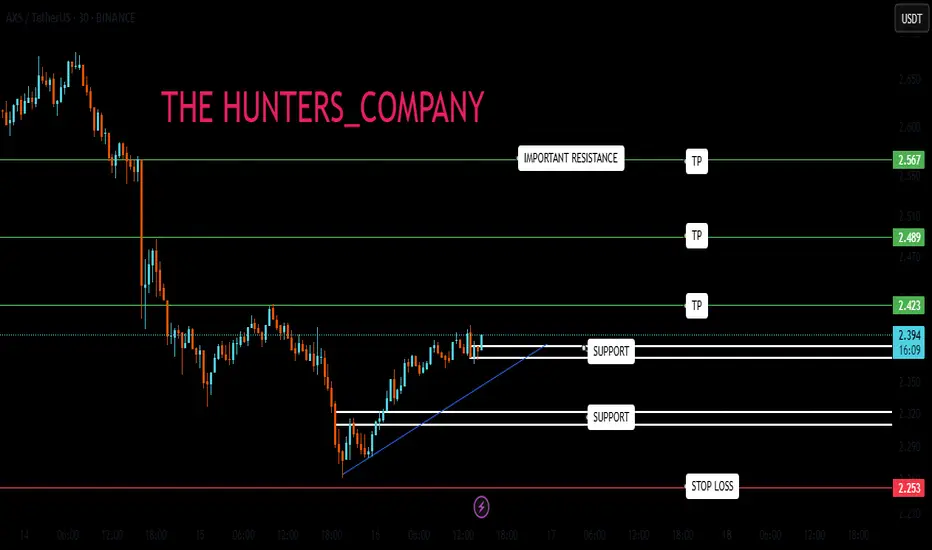
AXS : Buy signal?Hello friends
Given the decline we had, the price has recovered well and gone up.
Now, if the specified support area is maintained, it can move to the specified resistances.
If it continues to decline, we have a more important support below, which can be a good support, but if it declines further and the stop loss is broken, it means that our trend is down.
*Trade safely with us*
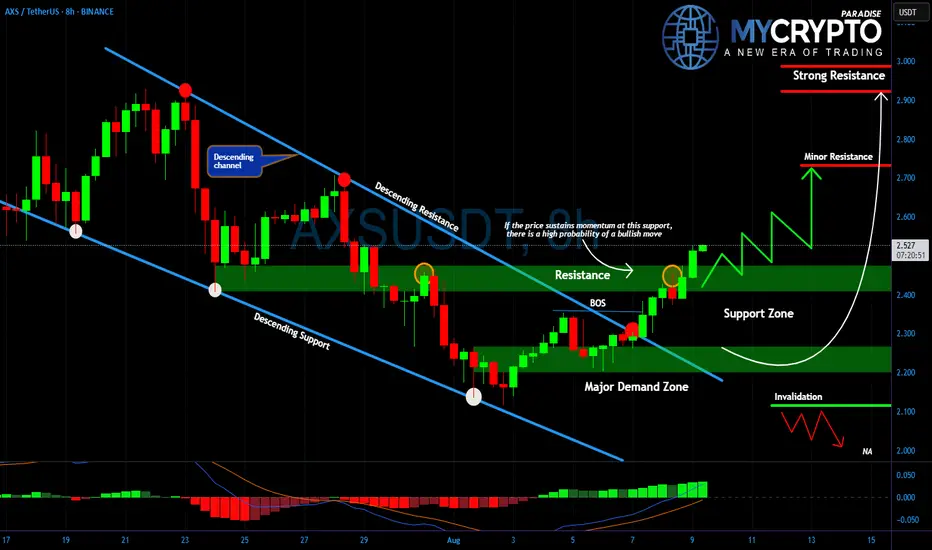
AXS :Breakout to Glory or Just Another Painful Bull Trap Ahead?Yello could this #AXSUSDT breakout be the start of something big, or is it the perfect setup to liquidate the impatient before the real move? After weeks of being trapped inside a grinding descending channel, price has finally punched through resistance… but the market is never that generous without a catch.
💎For nearly a month, #AXS kept bouncing between descending resistance and support, with every bullish attempt slapped back down. That pattern ended when price broke cleanly above $2.40, flipping a stubborn resistance level into fresh support. This is a textbook Break of Structure (BOS) and a sign that buyers are finally stepping in with force.
💎The $2.10 to $2.20 demand zone remains the ultimate foundation for bulls. As long as it holds, market sentiment stays in their favor. The newly reclaimed $2.40 to $2.45 area now acts as immediate support, and losing it could invite a quick reversal back into the previous bearish structure. On the upside, $2.70 stands as the first key level where sellers might reappear, while a decisive breakout above $2.90 could trigger a rapid rally. If price closes below $2.10, the bullish case collapses entirely and the downtrend resumes.
💎The MACD has just printed a bullish cross with rising histogram bars, reinforcing the breakout momentum. Still, experienced traders know that such breakouts often retrace sharply before continuing higher, shaking out weak hands along the way.
🎖Strive for consistency, not quick profits. Treat the market as a businessman, not as a gambler.
MyCryptoParadise
iFeel the success🌴
AXSUSDT 1D Analysis AXS ~ 1D Analysis
#AXS Buy gradually from here if you still have confidence in this coin with a short term target of at least 15%++

AXS/USDT (6H) – Downtrend Resistance Test in Progress AXS/USDT (6H) – Downtrend Resistance Test in Progress
Pattern: Descending Trendline Breakout
Timeframe: 6-Hour ⏱️
Pair: AXS/USDT 💱
Published: June 11, 2025 📅
Technical Overview:
AXS/USDT is approaching a key descending trendline that has capped price action since early June. Price is testing this dynamic resistance and showing signs of potential breakout momentum 📈
Potential Trade Setup:
Bullish Scenario ✅
Entry: On breakout and 6H candle close above 2.800–2.850
Targets:
* TP1: 3.000–3.100 🎯
* TP2: 3.300–3.400 🎯
Stop-loss: Below 2.600–2.650 🛑
Risk Management ⚠️
Wait for volume confirmation to avoid fakeouts. Rejection at the trendline could lead to more downside or consolidation.
Conclusion:
AXS is at a critical resistance zone. A clean breakout above the trendline may lead to a bullish reversal and upside continuation 📊🔍

#AXS/USDT#AXS
The price is moving within a descending channel on the 1-hour frame, adhering well to it, and is heading for a strong breakout and retest.
We are seeing a bounce from the lower boundary of the descending channel, which is support at 3.11.
We have a downtrend on the RSI indicator that is about to be broken and retested, supporting the upward trend.
We are looking for stability above the 100 Moving Average.
Entry price: 3.16
First target: 3.23
Second target: 3.45
Third target: 3.65

AXSUSDT 1D AnalysisAXS ~ 1D Analysis
#AXS Buy after successfully penetrating this resistant line with a short -term target of at least 10%+ from here.

AXSUSDT 1WAXS ~ 1W Analysis
#AXS If you still have a Conviction on this coin, maybe this support you can consider to start buying again from here.

AXSUSDT 6DAXS ~ 6D
#AXS Retesting this support would be a very good buying place for now,. Buy in stages with a minimum target of 20%+

#AXS/USDT#AXS
The price is moving in a descending channel on the 1-hour frame and is expected to continue upwards
We have a trend to stabilize above the moving average 100 again
We have a descending trend on the RSI indicator that supports the rise by breaking it upwards
We have a support area at the lower limit of the channel at a price of 6.71
Entry price 6.73
First target 6.90
Second target 7.06
Third target 7.20

AXSUSDT Rectangle PatternAXSUSDT Breaks Out of Rectangle PatternAXSUSDT Technical Analysis update
AXSUSDT has formed a rectangle pattern at the bottom near its major yearly support level. The price has broken the rectangle pattern resistance on the daily chart, indicating a potential bullish move from the current level. The price is trading above the 100 and 200 EMAs on the daily chart, with a noticeable rise in volume in recent candles is also considered strongly bullish.

AXSUSDTAXS ~ 1W
#AXS Continuing to maintain this support block,. If you still have Conviction on this coin. This support block would be a very good buying place for now. at least for a 20%++ increase in the short term.

AXSUSDT Bulls Take Control! Key Levels in Sight.Analysis for AXSUSDT 15m Timeframe – Long Trade
Current Position:
Entry: $4.677
Current Status: Target 1 (TP1) at $4.823 has been successfully achieved. Awaiting further momentum to hit higher targets.
Technical Overview:
Risological Dotted Trend Line: The upward curve of the trend line indicates positive momentum and a strong bullish sentiment in this timeframe.
Volume Analysis: Current volume stands at 1.03M, lower than the 30-day average of 1.91M. Despite the lower volume, the price has sustained its upward trajectory, suggesting underlying buying interest and potential accumulation.
Key Performance Metrics:
Short-Term Weakness: The asset has shown negative returns over the last 1 week (-5.63%) and 1 month (-9.62%), reflecting recent downtrends.
Long-Term Resilience: Despite the short-term declines, AXS has a slight positive return over the past year (+2.12%), indicating resilience in its long-term outlook.
Target Levels:
TP1: $4.823 (Achieved)
TP2: $5.060
TP3: $5.296
TP4: $5.442
Stop Loss (SL): Placed at $4.559, providing a balanced risk-to-reward ratio for this trade setup.
Outlook: The trade remains bullish, with further targets potentially reachable, provided AXSUSDT can maintain momentum. Keep an eye on volume trends for additional confirmation of sustained buying pressure.
This setup aligns well with a continuation in the bullish trend, leveraging favorable price action to target the next levels.

#AXS/USDT#AXS
The price is moving in a descending channel on the 12-hour frame and is sticking to it very well and is about to break upwards
We have a bounce from the lower limit of the channel at a price of 4.00
We have an upward trend on the RSI indicator that is about to break, which supports the rise
We have a trend to stabilize above the moving average 100
Entry price 4.80
First target 5.80
Second target 6.40
Third target 7.17

AXSUSDT Forms Bullish Falling Wedge PatternAXSUSDT technical analysis update
AXS is moving towards the wedge resistance trendline, signaling a potential breakout. Once the breakout is confirmed on the daily chart, we can expect a strong bullish move in AXS.
Regards
Hexa

AXSUSDTAXS ~ 1W
#AXS If you have Conviction on this coin,. You should get a good price to start buying from here.

AXSUSDT Axie Infinity 1W-TIMEFRAME ANALYSIS💥AXSUSDT Axie Infinity 1W-TIMEFRAME ANALYSIS
💗Hello ladies and gentlemen
This is my new idea for 💥AXS Axie Infinity
I hope my idea is clear
Support me by like and share thank you
Stay Safe💯💲💲💲
Good luck💰😍

AXS gold signal#AXS is currently moving in a bullish Channel , which serves as strong support. price gradually approaching a key resistance level around the $8.50 - $8.16 mark.
It seems that according to the maintenance of the bullish Channel. if the resistance range of $8.5 is completely consumed; The probability of the continuation of the upward trend similar to the scenario is high.
If this specified resistance area is not completely consumed, we expect a downward trend and the bullish scenario is invalid.
A successful break above resistance level could lead to a continuation of the upward trend, while failure to break through may result in a price correction. Careful monitoring of the price behavior around this resistance level is crucial for making informed trading decisions.
At the moment, we do not have a signal for a bearish trend on the price chart.

#AXS/USDT#AXS
The price is moving within a 1-day ascending channel pattern, which is a retracement pattern
We have a support area at 6.00 and we bounced from it at the lower border of the channel
We have a tendency to stabilize above the Moving Average 100
We have an upward trend on the RSI indicator that supports the rise and gives greater momentum
Entry price is 7.40
The first goal is 9.57
The second goal is 10.70
Third goal 12.00

AXSUSD 1WAXS ~ 1W 📈
#AXS Pattern H&S Formed here. this is the Bull Pattern. We will be buying in stages here with small trades, with a minimum target of 15%+
