BakeryToken BAKE Coin Price Prediction🔥 Price on the 4H chart might come at these support area and we might get a potential bounce🔥
Potential bounce areas for Buying 0.5723 and 0.4770 and 0.3704
👉 Follow me for More Real Time Opportunities.
Share your Thoughts if you have any?
Bake

Don't miss CAKEHello guys,
PancakeSwap reduced the max token supply of NASDAQ:CAKE from 750M to 450M.
Less supply will definitely increase the price so it's great for buy and hold cake.
Don't miss CAKE ;)

We are currently in an upward trend (BAKE)❤️❤️Thanks for boosting 🚀 and supporting us!
📈We are currently in an upward trend, and this trend needs a small correction to go again.
📊 (Buy) :0.260
🔴 Stop Loss : 0.2055
🎯 Take Profit : 0.324-0.416-0.459
🔗 For more communication with us, In the footnote and send a message in TradingView.
👨🎓 Experience and Education: Our trading team has five years of experience in financial markets, especially cryptocurrencies.

BAKEUSDT.1DBased on the market data provided, the BAKE/USDT pair appears to be in a strong uptrend. This is indicated by the high Relative Strength Index (RSI) values across the 4-hour, 1-day, and 7-day periods, all of which are above 70. The Moving Average Convergence Divergence (MACD) values also support this bullish sentiment, as they are positive across all three timeframes, suggesting that the upward momentum is strong.
The Bollinger Bands (BB) on the 4-hour, 1-day, and 7-day charts also indicate a bullish trend, with the current price of 0.4462 being above the middle band in all cases, suggesting the price is trending upwards.
The support and resistance levels indicate potential levels at which the price might bounce back or face resistance. The nearest support level on the 4-hour chart is at 0.3176 USDT, while the nearest resistance is at 0.4650 USDT. On the 1-day and 7-day charts, the nearest support levels are at 0.3002 USDT and 0.1659 USDT respectively, and the nearest resistances are at 0.4867 USDT and 0.4820 USDT respectively.
In conclusion, based on the technical indicators, BAKE/USDT appears to be in a strong bullish trend. However, it's important to note that these indicators do not guarantee future price movements, and they should be used in conjunction with other forms of analysis and risk management techniques. Always invest wisely and only risk what you can afford to lose.

BAKE Coin Price Prediction🔥 Price on the 4H chart might come at these support area and we might get a potential bounce🔥
Potential bounce areas for Buying 0.2764 and 0.2194
👉 Follow me for More Real Time Opportunities.
Share your Thoughts if you have any?

"BAKE/USDT Long Trade Analysis: Falling Wedge Breakout Signals RTrade Setup for BAKE/USDT: Long Position
Analysis:
BAKE has broken out of a falling wedge pattern, indicating a potential reversal.
The current market situation involves a retest after the breakout.
Entry:
Entry Point: Current Market Price (CMP)
Additional Positions: Consider adding more if the price drops to $0.2228.
Targets:
$0.255
$0.277
$0.2944
$0.32
$0.38
Stop Loss (SL):
Set the Stop Loss at $0.2138 to limit potential losses.
Leverage:
Use leverage cautiously: 5x to 10x.
Risk-Reward Ratio (R:R):
Risk-Reward Ratio is 1:6 (Lucrative).
Caution:
Use leverage in accordance with your risk appetite and be conservative to mitigate significant losses.
Perform your own research (DYOR) before making any trading decisions.
This information is not financial advice.

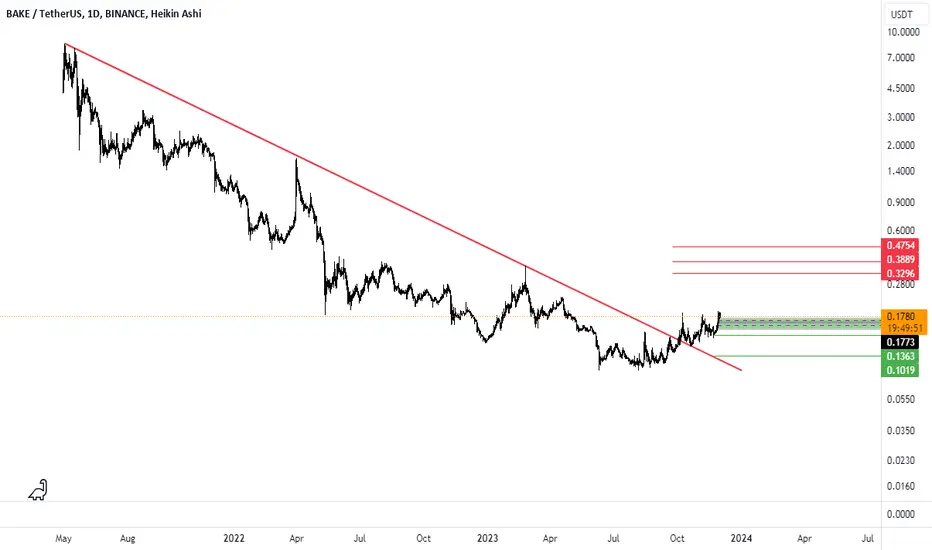
BAKEUSDT(BakeryToken) Daily tf Range Updated till 05-12-23BAKEUSDT(BakeryToken) Daily timeframe range. very impressive pump on daily. trying to tackle 0.3254. this thing got huge range gap in PA. 0.3254 breaking clean can lead it to 0.4948. if not fails.

BAKE/USDT Break the Key area. Ready to Continue Upward Move?💎 BAKE has unquestionably left its mark on the market with its remarkable ascent. BAKE has successfully confirmed its breakout from the supply area. Currently, BAKE is in the process of a retesting phase at the demand area, which was previously the supply region. There's potential for BAKE to rebound from the demand area and probability initiate a substantial upward movement toward our targeted supply and bearish order block (OB) zone.
💎 However, in the event that BAKE fails to bounce from the demand area spanning from $0.157 to $0.148, there's a possibility that BAKE could break through the demand level and descend to the lower demand at $0.1350. At this point, it becomes crucial for BAKE to make a successful bounce to reclaim the area at $0.157 if it intends to continue its upward trajectory.
💎 if BAKE retraces to the lower demand area at $0.1350 and doesn't exhibit a rebound from this level, it increases the potential for BAKE to breach the demand area. Should this occur, it signifies a bearish momentum and raises the possibility of BAKE continuing its descent, potentially returning to the strong support area.

BAKE UPDATE (1D)The point about the bake chart is that wave c of this diametric is extended and we need to add a small wave to wave c.
The update of this diametric pattern is as shown in the picture
It seems now, we have just entered the g wave. We need confirmation and trigger for the drop after the g wave

bakeThe goals are specified, if the red lines are fixed, and if corrected, the box is green so that it can reach the high points.
BAKE/USDT Likely to Go for a Bull Run? BAKE Analysis Today💎Yello, Paradisers! brace yourselves for an exhilarating period with BAKEUSDT as it undergoes a pivotal shift from resistance to support, indicating a strong chance of embarking on a bullish trend.
💎For the last few days, BAKE has shown a consistent pattern of breaking free from its descending channel, leading to an upward trend. Currently, it has impressively breached the resistance level at $0.1426.
💎This breakthrough, along with its robust standing above the EMA100, hints at a potentially bullish development, awaiting further confirmation upon retest.
💎Conversely, if BakeryToken fails to maintain its upward momentum and falls below the support during this retest phase, we could anticipate a bullish strategy emerging from the demand level at $0.1426.
💎Nonetheless, a drop beneath this key demand level might lead to a substantial decline to the lower specified level.

BAKE will have a fallWe are inside a large diamond diametric. We are now inside the F branch of this large diametric. The branch F itself has become a bow tie diametric, and now we are in the falling wave f of this diametric. It is expected that after the completion of the g branch of F, we will enter a large bearish G wave.
For risk management, please don't forget stop loss and capital management
Comment if you have any questions
Thank You

Buckle Up: Bitxer Signals a BAKE/USDT Long Opportunity! 🚀📈📈 **Bitxer's Free Trading Signal Alert!** 🚨
**Symbol: BAKE/USDT**
**Position: Long**
🚀 **Insight:**
- BAKE aiming to break the weekly downside spot and resident at 0.1669.
- If the break occurs, potential moonshot in focus!
🎯 **Targets:**
1. 0.2630
2. 0.4729
3. 0.8503
⛔ **Stop Loss:** 0.1227
💼 **Risk Management:**
- Trade safely, manage your risk diligently.
- Use low leverage for a secure approach.
🆓 **Enjoy Free Signal with Bitxer:**
- Trading wisdom delivered to you!
Happy trading, Bitxer! 🌕💹🚀

BAKE SHOWS FALL TRENDThanks for reading this update.
Bake shows on the TA side a fall trend, what does this mean exactly the next time frames should confirm it.


BAKEUSDTBased on the provided market data, the BAKE/USDT pair is currently priced at $0.1470.
Looking at the 4-hour chart, the Relative Strength Index (RSI) is at 75.64, which is typically considered overbought. This could indicate potential for a price drop or correction in the short term. The Moving Average Convergence Divergence (MACD) is at 0.0032, which suggests bullish momentum. The Bollinger Bands (Bb) are at 0.1437, with the price above the middle band, indicating that the market is in a bullish trend.
The daily chart shows the RSI at 62.12, which is relatively neutral. The MACD is at 0.0056, further confirming the bullish momentum. The Bb is at 0.1560, with the price below the middle band, suggesting a bearish trend in the longer term.
The weekly chart shows the RSI at 53.10, which is neutral. The MACD is at -0.0091, indicating a bearish trend. The Bb is at 0.1504, with the price below the middle band, further confirming the bearish trend.
In terms of support and resistance levels, on the 4-hour chart, the first, second, and third support levels are at $0.1224, $0.1148, and $0.1050 respectively, while the resistance levels are at $0.1424, $0.1917, and $0.2229 respectively.
On the daily chart, the support levels are at $0.1043, $0.0930, and $0.0699, and the resistance levels are at $0.1560, $0.2016, and $0.2726.
On the weekly chart, the support levels are at $0.1087, $0.0826, and $0.0797, and the resistance levels are at $0.1778, $0.3742, and $0.6518.
In conclusion, the market data suggests a bullish trend in the short term, but bearish in the longer term. However, the high RSI on the 4-hour chart may indicate a potential price correction. As always, it's essential to consider other market factors and your risk tolerance when making trading decisions.

BAKE LONG SETUPHi, dear traders. how are you ? Today we have a viewpoint to BUY/LONG the BAKE symbol.
For risk management, please don't forget stop loss and capital management
When we reach the first target, save some profit and then change the stop to entry
Comment if you have any questions
Thank You

BAKEBTC Uptrend Validation Point to BullishBAKEBTC has recently demonstrated strong support within the 61.8% Fibonacci level, affirming the significance of the demand zone. This was further reinforced by the price breaking above the downtrend trendline, confirming the presence of an ongoing uptrend. Consequently, the likelihood of a continued price ascent is notably high, with BAKE potentially targeting the next significant supply area around 625 satoshis.
Nevertheless, it's wise to remain prepared for a consolidation phase and a potential re-test of the demand zone before a full-fledged rally ensues. Overall, the overall bullish outlook remains highly optimistic for BAKEBTC.

BAKE/USDT Can Bake Break the Strong Resistance or Down again ???💎 BAKE is unmistakably on our watchlist. It's gearing up once again to challenge a formidable resistance zone. Previously, upon encountering this resistance, BAKE faced a sharp 19% decline, only to rebound impressively upon reaching the Bullish OB zone.
💎 While the current trend showcases bullish tendencies in the short run, a decisive bullish confirmation would require BAKE to breach and sustain above this strong resistance.
💎 However, if BAKE stumbles at this resistance once more, we might witness a pronounced decline, potentially revisiting the Bullish OB zone. Should BAKE falter and lose its grip on this OB zone, there's a chance it could descend further, possibly towards the robust support zone.

BAKE/USDT Potential Bounce and make a Bullish Momentum ??Yello Paradisers, Keep an Eye on BAKE: Navigating a Major Descending Channel
💎 BAKE continues to operate within a significant downward channel.
💎 Previously, it experienced a sharp rally, reaching a Bearish Order Block (Bearish OB) where it faced a strong bearish rejection and subsequently declined.
💎 Looking at the chart, BAKE shows potential for a bounce as it approaches a resistance zone. Should BAKE face rejection at this point and decline, it's likely to breach a crucial support level, setting new lows. On the flip side, if BAKE manages to break and sustain above the resistance zone, it could retest the previous Bearish OB.
💎 This analysis would be invalidated if BAKE breaks through the key support level and closes below it on the daily chart.

BAKEBTC Faces Critical Support💎#BAKEBTC is currently exhibiting robustly bullish price dynamics. A keen examination reveals a recurring pattern: the price consistently breaches the downtrend trendlines on the daily chart, signaling a sustained long-term uptrend.
💎At present, the price finds itself sandwiched between the supply and demand zones, predominantly trading at the lower boundary of this range. Of particular significance is the resilience of the 61.8% Fibonacci level, which has served as a robust support level, with the price hovering just above it for the past five days.
💎This pattern significantly augments the likelihood of an impending upward movement. If this materializes, the price could potentially ascend just beyond the supply zone, with a target set on the 127.2% Fibonacci retracement level. However, it's essential to remain cautious as long as the minor resistance at 430 satoshis remains unconquered by the bulls.
💎Should this resistance fail to yield to the bullish momentum, the downside risk persists. In such a scenario, the breach of the 61.8% Fibonacci support would set #BAKE on a continued downward trajectory, with its sights potentially fixed on the 78.6% Fibonacci support level.

Buying $BAKE$Bake
-Belonging to the group #seed being pushed. Small cap vol is ok to buy in bulk. I bought this price hoping to make a profit 🌹🌹
What is a Symmetrical Triangle
A symmetrical triangle is a chart pattern characterized by two converging trend lines connecting a series of sequential peaks and troughs. These trend lines should be converging at a roughly equal slope. Trend lines that are converging at unequal slopes are referred to as a rising wedge, falling wedge, ascending triangle, or descending triangle.
KEY TAKEAWAYS
Symmetrical triangles occur when a security's price is consolidating in a way that generates two converging trend lines with similar slopes.
The breakout or breakdown targets for a symmetrical triangle is equal to the distance between the initial high and low applied to the breakout or breakdown point.
Many traders use symmetrical triangles in conjunction with other forms of technical analysis that act as a confirmation.

BAKE going fractalobolicYou say FRACTAL I say BINANCE:BAKEUSDT !
Just look at this! 30m TF right before and 1h TF at newest formation, the same structure with the volume, almost the same FIB.
Adding to the fact that we're about to break the Long going trendline
AND the fact that it has just announced a partnership with BASE L2 blockchain
We might see the very parabolic move. Are we gonna see next 200%? It's a matter of days if we'll see it.
High Risk. High Volatility. Probable High and quick reward.
