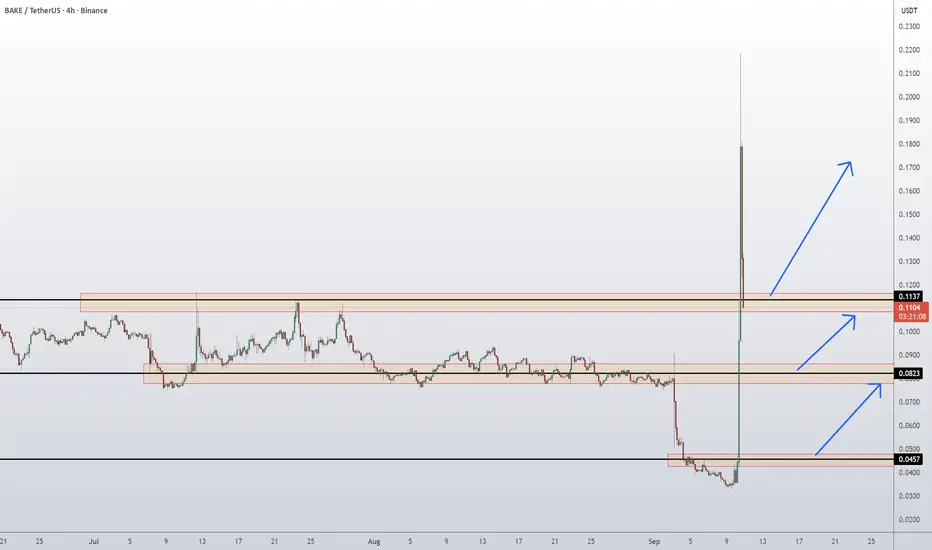
BakeryToken Bake Coin Price Prediction and Technical AnalysisBAKE/USDT just made a massive spike from the 0.0457 demand base, reclaiming lost ground after weeks of decline. Price has now surged into the 0.1137–0.1150 resistance zone, where sellers are showing signs of pressure. If bulls manage to hold above this reclaimed level, continuation toward 0.1820 looks possible. However, if price fails here, a healthy pullback toward 0.0823 support could unfold before another attempt higher.
📈 Key Levels:
Buy trigger: Retest/hold above 0.1137 support-turned-demand
Buy zone: 0.0823 – 0.1137 region
Target 1: 0.1820 resistance
Target 2: Extension toward 0.20+ if momentum continues
Invalidation: Daily close below 0.0457 (would negate the bullish recovery)
👉 Follow me for More Real Time Opportunities.
Share your Thoughts if you have any?
Bakeryswap
BAKEUSDT – Red Boxes Are Strong Resistance Zones!The red boxes on BAKEUSDT represent significant resistance zones where we can expect considerable selling pressure. These levels have shown their strength in the past, and it's crucial to approach them with caution.
🔴 Key Insights:
Strong Resistance: The red boxes are key resistance areas with high potential for price rejection. Sellers are likely to be active here, so don’t rush.
Patience is Key: Always wait for lower time frame (LTF) breakouts with CDV and volume profile confirmation before making any decisions.
Avoid Blind Entries: Trading these zones blindly can be risky. Let the market show you its intention, and only trade with confirmation.
💡 Smart Approach:
Wait for a clear signal before making a move. If the market doesn’t break and retest these red zones with volume, there’s no reason to take unnecessary risks. Your entry should always be backed by proper data and analysis. Patience + Smart Entries = Successful Trades.
I keep my charts clean and simple because I believe clarity leads to better decisions.
My approach is built on years of experience and a solid track record. I don’t claim to know it all, but I’m confident in my ability to spot high-probability setups.
If you would like to learn how to use the heatmap, cumulative volume delta and volume footprint techniques that I use below to determine very accurate demand regions, you can send me a private message. I help anyone who wants it completely free of charge.
I have a long list of my proven technique below:
🎯 ZENUSDT.P: Patience & Profitability | %230 Reaction from the Sniper Entry
🐶 DOGEUSDT.P: Next Move
🎨 RENDERUSDT.P: Opportunity of the Month
💎 ETHUSDT.P: Where to Retrace
🟢 BNBUSDT.P: Potential Surge
📊 BTC Dominance: Reaction Zone
🌊 WAVESUSDT.P: Demand Zone Potential
🟣 UNIUSDT.P: Long-Term Trade
🔵 XRPUSDT.P: Entry Zones
🔗 LINKUSDT.P: Follow The River
📈 BTCUSDT.P: Two Key Demand Zones
🟩 POLUSDT: Bullish Momentum
🌟 PENDLEUSDT.P: Where Opportunity Meets Precision
🔥 BTCUSDT.P: Liquidation of Highly Leveraged Longs
🌊 SOLUSDT.P: SOL's Dip - Your Opportunity
🐸 1000PEPEUSDT.P: Prime Bounce Zone Unlocked
🚀 ETHUSDT.P: Set to Explode - Don't Miss This Game Changer
🤖 IQUSDT: Smart Plan
⚡️ PONDUSDT: A Trade Not Taken Is Better Than a Losing One
💼 STMXUSDT: 2 Buying Areas
🐢 TURBOUSDT: Buy Zones and Buyer Presence
🌍 ICPUSDT.P: Massive Upside Potential | Check the Trade Update For Seeing Results
🟠 IDEXUSDT: Spot Buy Area | %26 Profit if You Trade with MSB
📌 USUALUSDT: Buyers Are Active + %70 Profit in Total
🌟 FORTHUSDT: Sniper Entry +%26 Reaction
🐳 QKCUSDT: Sniper Entry +%57 Reaction
📊 BTC.D: Retest of Key Area Highly Likely
I stopped adding to the list because it's kinda tiring to add 5-10 charts in every move but you can check my profile and see that it goes on..
A tiny part of my runners;
🌊 WAVESUSDT.P: Demand Zone Potential
🟣 UNIUSDT.P: Long-Term Trade
🔵 XRPUSDT.P: Entry Zones
🔗 LINKUSDT.P: Follow The River
📈 BTCUSDT.P: Two Key Demand Zones
A tiny part of my runners;
💼 STMXUSDT: 2 Buying Areas
🐢 TURBOUSDT: Buy Zones and Buyer Presence
🌍 ICPUSDT.P: Massive Upside Potential | Check the Trade Update For Seeing Results
🟠 IDEXUSDT: Spot Buy Area | %26 Profit if You Trade with MSB
📌 USUALUSDT: Buyers Are Active + %70 Profit in Total
🌟 FORTHUSDT: Sniper Entry +%26 Reaction
🐳 QKCUSDT: Sniper Entry +%57 Reaction
j
📌I keep my charts clean and simple because I believe clarity leads to better decisions.
📌My approach is built on years of experience and a solid track record. I don’t claim to know it all but I’m confident in my ability to spot high-probability setups.
📌If you would like to learn how to use the heatmap, cumulative volume delta and volume footprint techniques that I use below to determine very accurate demand regions, you can send me a private message. I help anyone who wants it completely free of charge.
🔑I have a long list of my proven technique below:
🎯 ZENUSDT.P: Patience & Profitability | %230 Reaction from the Sniper Entry
🐶 DOGEUSDT.P: Next Move
🎨 RENDERUSDT.P: Opportunity of the Month
💎 ETHUSDT.P: Where to Retrace
🟢 BNBUSDT.P: Potential Surge
📊 BTC Dominance: Reaction Zone
🌊 WAVESUSDT.P: Demand Zone Potential
🟣 UNIUSDT.P: Long-Term Trade
🔵 XRPUSDT.P: Entry Zones
🔗 LINKUSDT.P: Follow The River
📈 BTCUSDT.P: Two Key Demand Zones
🟩 POLUSDT: Bullish Momentum
🌟 PENDLEUSDT.P: Where Opportunity Meets Precision
🔥 BTCUSDT.P: Liquidation of Highly Leveraged Longs
🌊 SOLUSDT.P: SOL's Dip - Your Opportunity
🐸 1000PEPEUSDT.P: Prime Bounce Zone Unlocked
🚀 ETHUSDT.P: Set to Explode - Don't Miss This Game Changer
🤖 IQUSDT: Smart Plan
⚡️ PONDUSDT: A Trade Not Taken Is Better Than a Losing One
💼 STMXUSDT: 2 Buying Areas
🐢 TURBOUSDT: Buy Zones and Buyer Presence
🌍 ICPUSDT.P: Massive Upside Potential | Check the Trade Update For Seeing Results
🟠 IDEXUSDT: Spot Buy Area | %26 Profit if You Trade with MSB
📌 USUALUSDT: Buyers Are Active + %70 Profit in Total
🌟 FORTHUSDT: Sniper Entry +%26 Reaction
🐳 QKCUSDT: Sniper Entry +%57 Reaction
📊 BTC.D: Retest of Key Area Highly Likely
📊 XNOUSDT %80 Reaction with a Simple Blue Box!
📊 BELUSDT Amazing %120 Reaction!
I stopped adding to the list because it's kinda tiring to add 5-10 charts in every move but you can check my profile and see that it goes on..

BAKEUSDT: Smart Entry Opportunity – Blue Box Demand Zone!BAKEUSDT is presenting a golden opportunity for traders with the blue box as a well-defined demand zone. This level is the most rational entry point for those seeking high-probability setups.
Why the Blue Box?
Meticulously Selected: The blue box has been carefully identified using volume footprint, volume profile, cumulative delta volume (CDV), and liquidity heatmaps , ensuring it aligns with high-demand regions.
Confirmation Process: I will validate trades in the blue box using CDV, liquidity heatmaps, volume profiles, volume footprints (ensuring buyers are present), and upward market structure breaks in lower time frames . This ensures entry precision and minimizes risk.
Strategic Risk Management: The current market demands calculated moves. The blue box offers the most logical zone for entry, reducing exposure to unnecessary risks.
What’s Next?
Boost your confidence by trading where buyers are likely to act. If the market follows through, this setup could be a game-changer.
Engage & Share:
If you find this analysis valuable, please boost and leave a comment ! Your support motivates me to keep sharing these high-probability trade ideas.
Learn the Process – For Free!
Want to learn how I identify such precise demand zones? DM me to learn how I use CDV, liquidity heatmaps, volume profiles, and volume footprints . I’m happy to help for free – let’s grow together!
If you think this analysis helps you, please don't forget to boost and comment on this. These motivate me to share more insights with you!
I keep my charts clean and simple because I believe clarity leads to better decisions.
My approach is built on years of experience and a solid track record. I don’t claim to know it all, but I’m confident in my ability to spot high-probability setups.
If you would like to learn how to use the heatmap, cumulative volume delta and volume footprint techniques that I use below to determine very accurate demand regions, you can send me a private message. I help anyone who wants it completely free of charge.
My Previous Analysis (the list is long but I think it's kinda good : )
🎯 ZENUSDT.P: Patience & Profitability | %230 Reaction from the Sniper Entry
🐶 DOGEUSDT.P: Next Move
🎨 RENDERUSDT.P: Opportunity of the Month
💎 ETHUSDT.P: Where to Retrace
🟢 BNBUSDT.P: Potential Surge
📊 BTC Dominance: Reaction Zone
🌊 WAVESUSDT.P: Demand Zone Potential
🟣 UNIUSDT.P: Long-Term Trade
🔵 XRPUSDT.P: Entry Zones
🔗 LINKUSDT.P: Follow The River
📈 BTCUSDT.P: Two Key Demand Zones
🟩 POLUSDT: Bullish Momentum
🌟 PENDLEUSDT.P: Where Opportunity Meets Precision
🔥 BTCUSDT.P: Liquidation of Highly Leveraged Longs
🌊 SOLUSDT.P: SOL's Dip - Your Opportunity
🐸 1000PEPEUSDT.P: Prime Bounce Zone Unlocked
🚀 ETHUSDT.P: Set to Explode - Don't Miss This Game Changer
🤖 IQUSDT: Smart Plan
⚡️ PONDUSDT: A Trade Not Taken Is Better Than a Losing One
💼 STMXUSDT: 2 Buying Areas
🐢 TURBOUSDT: Buy Zones and Buyer Presence
🌍 ICPUSDT.P: Massive Upside Potential | Check the Trade Update For Seeing Results
🟠 IDEXUSDT: Spot Buy Area | %26 Profit if You Trade with MSB
📌 USUALUSDT: Buyers Are Active + %70 Profit in Total
🌟 FORTHUSDT: Sniper Entry +%26 Reaction
🐳 QKCUSDT: Sniper Entry +%57 Reaction
📊 BTC.D: Retest of Key Area Highly Likely
I stopped adding to the list because it's kinda tiring to add 5-10 charts in every move but you can check my profile and see that it goes on..

$ BAKE | How do I expect to see BAKE in coming weeksBINANCE:BAKEUSDT
Here with another speculation about crypto assets. This time Bakery token with BAKE ticker. Let’s take a look at the project’s information:
Bakery swap is one the DEXes that is active on Ethereum, Base and Binance smart chain and covers token swaps, NFT swaps, pools. Tbh, I couldn’t find any advantages for bakery swap over other DEXes. But the technical perspective makes this token interesting.
$ BAKE
Market Cap: $ 114 m
Market Cap Rank: 479
Market Price: 0.396 $
ATH: $ 8 (-95%)
ATL: $ 0.007 (+5435%)
Technical highlights:
- W1:
Trend: (I believe in channels!)
Price has been in a descending channel for most of its crypto life, but things have changed since last week. The day that the price managed to break the upper bond of its descending channel after 3 time rejection. Currently, with one day left until the weekly candle close, the chart is printing 3 white soldiers. Let's keep this as a positive point for possible uptrend continuation and move for the next hints.
Dec 2023 price made a local high and Nov 2024 was the higher low of this trend.
Price bounced several times from $0.21 to $0.26 to prove it as a good support/demand zone. Not to mention that the first higher low in W1 printed by bouncing from that support.
MA: Price holding above MA20 and A50. In the weekly time frame, MA50 at 0.315 can act as support but since it’s never been tested after breaking, so I cannot rely on that just yet. On the other hand, in the daily time frame, MA20, 50, and 200 are located at almost the same price ($0.28 to $0.32). Now this area gets more interesting to me for possible S/R test level.
RSI: The value is around 62 and is strong in the weekly time frame, which supports the trend direction. The RSI value in the daily time frame is 74 and it's in an overbought condition. So, I think there will be a cooldown soon and the above-mentioned level will be the candidate for the pullback.
Stoch RSI: The Stochastic RSI is in the overbought zone, just like the RSI. That's another reason to expect a retracement.
Volume: The volume is not so good and looks weak. That suggests a retrace in my opinion.
In my point of view, channels play an important role in trend direction and targets. Each time the trend breaks a channel, a move toward the direction of the breakout with the size of the channel will mostly happen.
Supports:
$ 0.315 Ma50 in W1
$ 0.275 Ma20 in W1
$ 0.21 ~ $ 0.26 Demand zone
Resistances:
$ 0.47 ~ $ 0.50 D1 Supply zone
$ 0.90 Range high
$ 1.10 W1 Supply zone
$ 1.45
$ 2.50 Channel upper boundary
$ 2.80 W1 Supply zone
Conclusion:
All these opinions are mine and can be wrong, so please DYOR.
This token is a low cap and low caps are mostly volatile in bull runs. I expect sharp moves in the way to its final targets in both ways. This will make it more of a risky trade. So I will be more cautious and will surely manage my position size according to my strategy. I recommend you to do the same.
**I need more energy to carry on and comes from your support!. don't forget to hit boost, share and comment your point of view with me**
My strategy goes as below:
🛒 Pair: BAKE/ USDT 🛒
👑 Bitcharge 👑
🕰 07/12/2024 🕰
POSITION: 🟢"Buy"🟢
2 % of capital
🛒 Buy: $ 0.270 – $ 0.315 🛒
👉Sell Targets👈
🎯TP1: $ 0.36 🥉
🎯TP2: $ 0.39 🥈
🎯TP3: $ 0.46 🥇
🎯TP4: $ 0.52 🚁
🎯TP5: $ 0.65 ✈️
🎯TP6: $ 0.72 🚀
🎯TP7: $ 0.89 🛰
🎯TP8: $ 0.96 🛰
🎯TP9: $ 1.05 ✨
🎯TP10: $ 1.25 ⭐️
🎯TP11: $ 1.45 💫
🎯TP12: $ 2.10 🪐
🎯TP13: $ 2.80 🌞
⛔️ SL: $ 0.1950 ⛔️ by closing D1 Below
--Stay rich--

BAKE seems readying for a massive rally$BAKE #bake token price very well accumulated for long time. If #bakeryswap makes a breakout here, then a massive rally is expected due to upcoming big news of #baketoken

What will happen to BAKE?From the place where we placed the red arrow on the chart, it seems that the BAKE correction has occurred.
This correction looks like a diametric as we are now in wave E of this diametric.
In the green range, wave E is expected to end and then we enter wave F.
We are looking for buy/long positions in the green range.
Closing a daily candle below the invalidation level will violate this analysis
For risk management, please don't forget stop loss and capital management
Comment if you have any questions
Thank You

BAKE ANALYSIS (1D)The past few days, when the whole market dropped, BAKE experienced a slight drop. How BAKE will be Boolean?
According to BAKE, it has the ability to rise up to the specified supply range, but in this range, you can look for a sell/short position.
tp can be the range of Demand.
Closing a daily candle above the invalidation level will violate the analysis.
For risk management, please don't forget stop loss and capital management
When we reach the first target, save some profit and then change the stop to entry
Comment if you have any questions
Thank You

BAKE looks bearishFrom where we put a red arrow on the chart, it looks like the BAKE correction has started.
This correction appears to be a diametric, whose wave D is now ending.
We expect the red range to maintain and drop downwards.
Closing a daily candle above the invalidation level will violate the analysis
For risk management, please don't forget stop loss and capital management
Comment if you have any questions
Thank You

BAKE/USDT Could BAKE Bounce and continue upward ?? or Break down💎 BAKE's market activity has been gaining significant attention recently. At present, BAKE is positioned at a pivotal support area, which was formerly a resistance level.
💎 Historically, this zone has been robust enough to prevent a significant breakdown of BAKE, suggesting a potential rebound from this level.
💎 If it successfully bounces back, BAKE may attempt to breach the resistance at $0.419, the probability leading to an upward journey toward the targeted Bearish OB area.
💎 However, should BAKE fail to hold above this support zone, implying a breakdown, it could signal a concerning shift from a bullish to a bearish trend. In such a case, BAKE may enter a downward trajectory, with its next critical point being the demand zone around $0.217.
💎 The demand zone will play a crucial role in BAKE's recovery. A strong bounce and reclaiming of levels above the support are essential to reverse the bearish momentum. Failure to achieve this could confirm a bearish trend for BAKE, potentially leading to further declines below the demand zone.

BakeryToken (BAKE) completed a setup for upto 46.50% pumpHi dear friends, hope you are well and welcome to the new trade setup of BakeryToken (BAKE) with US Dollar pair.
Recently we caught almost 316% massive pump as below:
Now on a 4-hr time frame, BAKE has formed a bullish BAT move for the next price reversal.
Note: Above idea is for educational purpose only. It is advised to diversify and strictly follow the stop loss, and don't get stuck with trade.

We are currently in an upward trend (BAKE)❤️❤️Thanks for boosting 🚀 and supporting us!
📈We are currently in an upward trend, and this trend needs a small correction to go again.
📊 (Buy) :0.260
🔴 Stop Loss : 0.2055
🎯 Take Profit : 0.324-0.416-0.459
🔗 For more communication with us, In the footnote and send a message in TradingView.
👨🎓 Experience and Education: Our trading team has five years of experience in financial markets, especially cryptocurrencies.

BAKE Coin Price Prediction🔥 Price on the 4H chart might come at these support area and we might get a potential bounce🔥
Potential bounce areas for Buying 0.2764 and 0.2194
👉 Follow me for More Real Time Opportunities.
Share your Thoughts if you have any?

BAKE/USDT Break the Key area. Ready to Continue Upward Move?💎 BAKE has unquestionably left its mark on the market with its remarkable ascent. BAKE has successfully confirmed its breakout from the supply area. Currently, BAKE is in the process of a retesting phase at the demand area, which was previously the supply region. There's potential for BAKE to rebound from the demand area and probability initiate a substantial upward movement toward our targeted supply and bearish order block (OB) zone.
💎 However, in the event that BAKE fails to bounce from the demand area spanning from $0.157 to $0.148, there's a possibility that BAKE could break through the demand level and descend to the lower demand at $0.1350. At this point, it becomes crucial for BAKE to make a successful bounce to reclaim the area at $0.157 if it intends to continue its upward trajectory.
💎 if BAKE retraces to the lower demand area at $0.1350 and doesn't exhibit a rebound from this level, it increases the potential for BAKE to breach the demand area. Should this occur, it signifies a bearish momentum and raises the possibility of BAKE continuing its descent, potentially returning to the strong support area.

BAKE UPDATE (1D)The point about the bake chart is that wave c of this diametric is extended and we need to add a small wave to wave c.
The update of this diametric pattern is as shown in the picture
It seems now, we have just entered the g wave. We need confirmation and trigger for the drop after the g wave

BAKE LONG SETUPHi, dear traders. how are you ? Today we have a viewpoint to BUY/LONG the BAKE symbol.
For risk management, please don't forget stop loss and capital management
When we reach the first target, save some profit and then change the stop to entry
Comment if you have any questions
Thank You

BAKE/USDT Can Bake Break the Strong Resistance or Down again ???💎 BAKE is unmistakably on our watchlist. It's gearing up once again to challenge a formidable resistance zone. Previously, upon encountering this resistance, BAKE faced a sharp 19% decline, only to rebound impressively upon reaching the Bullish OB zone.
💎 While the current trend showcases bullish tendencies in the short run, a decisive bullish confirmation would require BAKE to breach and sustain above this strong resistance.
💎 However, if BAKE stumbles at this resistance once more, we might witness a pronounced decline, potentially revisiting the Bullish OB zone. Should BAKE falter and lose its grip on this OB zone, there's a chance it could descend further, possibly towards the robust support zone.

BAKE/USDT Potential Bounce and make a Bullish Momentum ??Yello Paradisers, Keep an Eye on BAKE: Navigating a Major Descending Channel
💎 BAKE continues to operate within a significant downward channel.
💎 Previously, it experienced a sharp rally, reaching a Bearish Order Block (Bearish OB) where it faced a strong bearish rejection and subsequently declined.
💎 Looking at the chart, BAKE shows potential for a bounce as it approaches a resistance zone. Should BAKE face rejection at this point and decline, it's likely to breach a crucial support level, setting new lows. On the flip side, if BAKE manages to break and sustain above the resistance zone, it could retest the previous Bearish OB.
💎 This analysis would be invalidated if BAKE breaks through the key support level and closes below it on the daily chart.

BAKE going fractalobolicYou say FRACTAL I say BINANCE:BAKEUSDT !
Just look at this! 30m TF right before and 1h TF at newest formation, the same structure with the volume, almost the same FIB.
Adding to the fact that we're about to break the Long going trendline
AND the fact that it has just announced a partnership with BASE L2 blockchain
We might see the very parabolic move. Are we gonna see next 200%? It's a matter of days if we'll see it.
High Risk. High Volatility. Probable High and quick reward.

BakeryToken (BAKE) formed bullish Gartley for upto 11% pumpHi dear friends, hope you are well and welcome to the new trade setup of BakeryToken (BAKE) with BTC pair.
Previously we caught almost 50% pump of BAKE as below
Now on a 4-hr frame, BAKE has formed a bullish Gartley move for the next price reversal.
Note: Above idea is for educational purpose only. It is advised to diversify and strictly follow the stop loss, and don't get stuck with trade.

BakeryToken (BAKE) formed bullish BAT | A good buy opportunityHi dear friends, hope you are well and welcome to the new trade setup of BakeryToken (BAKE) with US Dollar pair.
On a 1-hr time frame, BAKE has formed a bullish BAT move for a bullish reversal move soon.
Note: Above idea is for educational purpose only. It is advised to diversify and strictly follow the stop loss, and don't get stuck with trade

BakeryToken (BAKE) forming bullish Cypher for upto 11.50% pumpHi dear friends, hope you are well and welcome to the new trade setup of BakeryToken (BAKE)
On 2-hr time frame, BAKE is about to complete the final leg of a bullish Cypher move.
Note: Above idea is for educational purpose only. It is advised to diversify and strictly follow the stop loss, and don't get stuck with trade

BAKEUSDT SHORT IDEABAKE Swing Short Idea
Entry - 0.2293
TP - 0.2080
SL - 0.2360
* This trade will give you approx. +9% ROI times your leverage upon TP completion. Set your entry as limit order and entry with confirmation

BAKE in a buy zoneBAKEUSDT like many coins is currently forming a bottom.
You can accumulate in the range (for spot trading) and sell when it reaches target.
If you trade on futures, better wait for BAKE to retest lows which may not happen as many altcoins already formed their bottoms and Bake is just lagging behind.
We expect the rise in the next weeks.
