BANDUSDT 4H TA: support and resistanceAccording to the chart, BANDUSDT 4-hour timeframe is in the Rising Wedge pattern, with support levels of $ 1.56 and $ 1.43 and resistance ranges of $ 1.84 to $ 1.91.
Its not Buy or Sell SIGNAL
DYOR
BY : Mohamad Teriz - @AtonicShark
Band

Bitcoin end of year target 2022 early 2023I am using the Beam Band to help us see the possibility of Bitcoin's price action end of the year 2022. Notice we have touched the bottom of this Beam Band twice already and afterward, a price surge happened like clockwork. The question is when will we touch down again this year if at all? What we do know is as soon as it happens we can, with high probability, expect a surge in price soon afterword based on previous examples. The green checkmarks are touchpoints at bottom of the Beam band and the red one is the possible expected touch we are anticipating. Also, notice the average percentage between the first two comes out to 800%. If we move from this expected bottom price on the beam band then at 800% would give us over a $200k BTC price.
If we do not see the BTC peak this year most likely will happen in 2023. Taking the average day count from both bottom touches on the Bean band and averaging them out gives us about 295 days afterward for the possible peak which, if so, takes the peak well into March of next 2023

BAND READY TO MOVE UP? LOOKING BULLISH!#BAND possible move in the making, but has to close RSI above 50 for upward move on 1hr otherwise it will retest.

BANDUSDT 1D TA: Break TrendLineAccording to the chart in the daily time frame, the trend line is broken upwards and has reacted positively on the important support range. Currently, by reacting again on the ranges, we have the possibility of climbing to the resistance points specified in the chart, and otherwise, with further correction, we will have the possibility of falling to $ 3.1 and $ 2.5.
Its not Buy or Sell SIGNAL
DYOR
BY : Mohamad Teriz - @AtonicShark

BAND/USDT : Rebound above the broken lineBINANCE:BANDUSDT
Hello everyone 😃
Before we start to discuss, I would be glad if you share your opinion on this post's comment section and hit the like button if you enjoyed it !
$BAND has rebounded above the broken trendline and now it's holding the support below.
There're two setups to trade with :
- Positional Traders can have a bag of it and set their invalidation as three candles close below the trendline; Which will confirm the rejection below the trendline.
- Swing Traders can enter above the trendline or set their entry near to $4.9; Stop-Loss should be located below $4.6, Which is crossing the last wicks on the poor lows.
Hope you enjoyed the content I created, You can support us with your likes and comments !
Attention: this isn't financial advice we are just trying to help people on their own vision.
Have a good day!
@Helical_Trades

BANDUSDT - Falling Wedge PatternBANDUSDT (1D Chart) Technical analysis
BANDUSDT (1D Chart) Currently trading at $5.5
Buy level: Above $5.5
Stop loss: Below $3.2
Target 1: $7
Target 2: $10
Target 3: $15
Target 4: $23
Max Leverage 2x / Spot market
Always keep Stop loss
Follow Our Tradingview Account for More Technical Analysis Updates, | Like, Share and Comment Your thoughts

BANDband
bottom of the channel is its own ascent
The canal floor and the white support area (demand area) form a good PRZ
The downtrend line of RSI is also broken, which indicates a rise in price.

Another Wyckoff Accumulation Phase testing 40k?As institutional investors have started to get involved in crypto, we have been seeing more and more similarities to the stock markets and as such, we saw our first Wyckoffian patterns February to April in 2021. Followed by a very obvious accumulation pattern.
As we have recently had two distributions to follow, it looks like we might enter another accumulation phase. While I do believe there is a chance we could see a strong V-shaped recovery and continue this bull market, we have to account for the possible play that is at hand.
IF we fail to get over the bull market support band on a weekly timeframe as shown in this chart by a 20w sma and 21w ema, we might enter such an accumulation phase.
What are my price levels based on?
Since 2011, if we held the bull market support band at a certain point, we have never again went below it. As you can see, we did test the Band for 10 days at the end of September.
We have seen previous accumulations and distributions which have formed significant points of support and resistance
If we do get into accumulation, it would be wise to DCA throughout and hold some cash in stablecoins for a possible spring event (orange path). Should there be none, at least you DCA'd through the accumulation.
I still believe we will see higher prices by Q1 or Q2 of 2022, as the cycles do seem to lenghten. 69k is unlikely to have been the top.

BAND USDT CHANCE FOR BUYINGThere is a chance for taking a buy position on Band/USDT, Band price has broken the blue trendline, this means the downtrend is weaker right now, the red horizontal line is invalidation point for buying, this means we should cancel buy position if Band price break the break and close beneath the invalidation point, the short term target is target 1, the mid term target is target 2 if Band still on uptrend, we should take this opportunity because the risk is smaller then the reward, if there is a comment or suggestion please comment below, I am open to learn

Remember This ON That I’ve been shared a while ago?Hello, everyone here we go about one of those perfect TAs that we had a while ago and we can see it has been completed its mission and filled all of the targets that we marked on the chart, and made 28% of Pure PROFIT for us!
Stay In touch for the next one!

Total Crypto Marketcap based on Expanding Cycle TheoryIf the Expanding Cycle Theory proves to be correct and we peak out in November 2022 (give or take could happen earlier or later in the year), this is what we could be looking at with all crypto hitting over 11.2 Trillion in value. This scenario will put Bitcoin at or around a 4 to 5 Trillion market cap while Altcoins having the dominance will have the remainder of Lion's share. I am using the Shift Pitchfork along with a fractal and an ascending channel. I am also using the Beam band to give us a possibility of future direction if Bitcoin hits the top of its Beam band. This is all speculation as we do not know the exact peak or blowoff top for Crypto on this bull cycle as the patter has now changed.
If you are interested in the Expanding Cycle Theory please visit Datadash on youtube and also Benjamin Cowen and they both have similar points.

BAND SIGNAL Good luck with that its a short term jdnejsishshsisjs hsudj bxjsosks sbsiw xuxheye. D. Bxusisiwis xb jdkw sbxh usbeeg s d

BAND/USDT TRADE SETUP! PERFECT LEVEL TO BUY FOR 90-100% PROFIT!!Hello everyone, if you like the idea, do not forget to support with a like and follow.
Welcome to this BAND/USDT trade setup. BAND looks very promising here and is currently near the strong support zone.
BAND is moving inside a falling channel where the breakout is still pending. Once it breaks the channel it will pump well.
Similarly, last time when it breaks the falling wedge it pumps almost 90% so I'm expecting the same this time also.
The green box is a very important support for BAND. So try to accumulate in this zone.
Entry range:- $3.26-$3.7
Target:- 90-100%
SL:- $2.88
If you like this idea then do support it with like and follow.
Also, share your views in the comment section.
Thank You!

#BAND is crosses down #RSI #trendlineBAND /USDT is GET the good setup for SHORT POSITION by RSI crosses down RSI trend line in 15M TF
You Can get This Position With 10X LEV
GOOD LUCK & Don't Forget to set the SL & TP

BAND way oversold with gap to fill. Looking for a bounce to $40's, on valuation the stock is cheap here! seekingalpha.com

#BAND is pullback to #bearish #trendlineBAND/USDT is GET the good setup for LONG POSITION by pullback to bearish trendline in 15M TF
You Can get This Position With 7X LEV
GOOD LUCK & Don't Forget to set the SL & TP

BAND two scenariosBAND has been going down for the last few hours. Soon we will see how low we will dip and when the negative trend will end. Here are two possible scenarios. This is no advice don't take this as advice. It's just an idea. BINANCE:BANDUSD

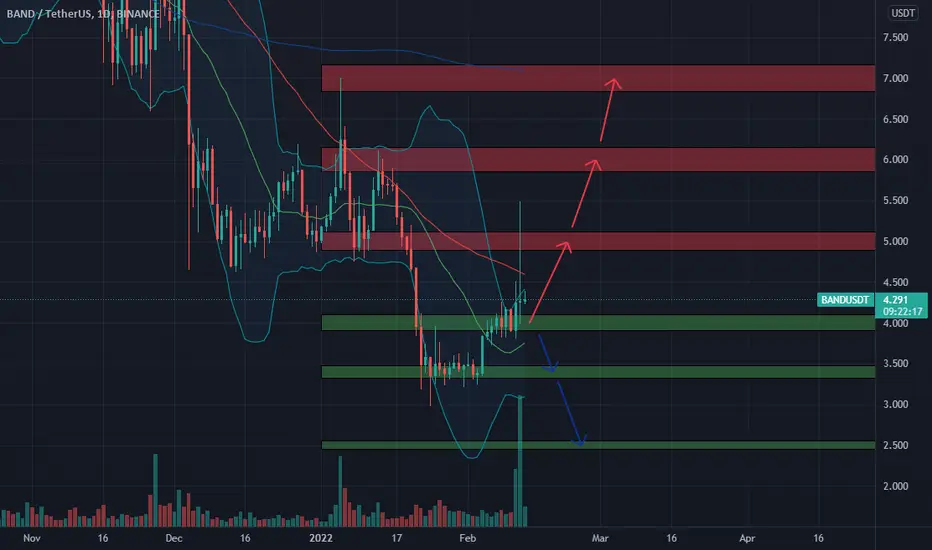
🆓Band Protocol (BAND) Feb-13 #BAND $BAND
.
📈RED PLAN
♻️Condition : If 1-Day closes ABOVE 4$ zone
🔴Buy : 4
🔴Sell : 5 - 6 - 7
📉BLUE PLAN
♻️Condition : If 1-Day closes BELOW 4$ zone
🔵Sell : 4
🔵Buy : 3.4 - 2.5
❓Details
🚫Stoploss for Long : 10%
🚫Stoploss for Short : 5%
📈Red Arrow : Main Direction as RED PLAN
📉Blue Arrow : Back-Up Direction as BLUE PLAN
🟩Green zone : Support zone as BUY section
🟥Red zone : Resistance zone as SELL section
BAND protocol formed big bullish Gartley for upto 150% pumpHi dear friends, hope you are well and welcome to the new trade setup of BAND protocol token.
During the current drop, on the weekly time frame chart, BAND has formed a bullish harmonic Gartley pattern for a big bullish reversal move. There is also a strong support zone below the buying zone.

BAND make or break momentBAND has been green for the past few hours while bitcoin along with most of the market has been red. Now BAND is hitting a very strong resistance. Either we move above the resistance or we fall back to support or we break down even lower. Don't buy now wait a little and time your buy in right. BINANCE:BANDUSD

BANDUSDT - SETUPBANDUSDT price hovering around at a critical support zone for a long time and we are reached at the breakout state, If bulls show some muscles at this point they will definitely cross this hurdle, and then a bullish surge can trigger towards 10.0 level.

Breakout complete, need a retracementband broke out of this wedge and now it needs to step back a bit. rsi helped me confirm this idea and now just need to wait and then go long.

BANDUSDTHello Crypto Lovers,
Mars Signals team wishes you high profits.
We are in the daily time frame. The price has been in a bearish mode and has hit the S1 line several times. The price was rejected from the R2 line two times and came down. It received support at the S1 line and currently is fluctuating above it. If the line holds, it can come up to the R1 resistance and if R1 is broken, it can move up to R2. If S1 is lost it can move down to S2. It is also likely for the price to move up to R1 and then fall back down.
Warning: This is just a suggestion and we do not guarantee profits. We advise you to analyze the chart before opening any positions.
Wish you luck
