BANKNIFTY Technical Analysis - Important levels📌 BANK NIFTY – Recovery Approaching Supply With Constructive CPR Undertone
BANK NIFTY has rebounded sharply from its recent swing low near the 59,600 demand zone, signalling responsive buying interest at lower levels but stopping short of confirming a full trend reversal. The index is currently trading around 60,100–60,120, where it is beginning to test an important overhead supply region. Immediate resistance is placed at 60,298.78, followed by a stronger resistance band near 60,400–60,480, which aligns with prior rejection areas and a developing supply zone within the broader descending structure. A higher resistance is visible at 60,804.13, marking the level that would need to be reclaimed for stronger bullish continuation.
On the downside, immediate support is positioned at 59,793.43, while deeper supports are seen at 59,466.32 and 59,288.08, forming a layered demand base that could absorb short-term volatility. The chart clearly highlights a primary demand zone around 59,600–59,750, whereas the supply zone is concentrated near 60,300–60,450, suggesting the index is currently travelling between value pockets rather than trending decisively.
From a CPR perspective, the structure remains narrow and positioned in a bullish zone, indicating potential for expansion once a directional trigger emerges. However, the dashboard also reflects low momentum and a wait-and-watch tone, implying that the market is stabilising after volatility rather than entering an impulsive move.
Overall, BANK NIFTY appears to be in a range recovery within a broader corrective framework. Sustaining above the 59,800–59,900 region keeps the short-term tone stable, but a decisive breakout above 60,400+ is essential to shift sentiment toward bullish continuation. Until then, rotational movement between demand and supply zones is likely.
📊 Market sentiment for financials remains balanced. Stable domestic liquidity conditions and resilient credit growth provide a supportive backdrop for banking stocks, yet rising yields and intermittent profit booking near higher levels continue to limit aggressive upside participation.
🔎 Probabilistic Tilt Based on Levels & Environment:
Bullish Scenario: A sustained move above 60,300–60,450 could trigger momentum toward 60,800, signalling strengthening institutional participation.
Neutral / Choppy Scenario: Holding between 59,600–60,400 would indicate consolidation as the index digests recent recovery.
Bearish Scenario: Failure to hold 59,793 may drag the index back toward 59,450–59,300, especially if broader market sentiment weakens.
⚠️ Disclaimer:
This content is shared purely for educational and informational purposes to enhance market understanding. It should not be construed as investment, trading, or financial advice. Market conditions can change rapidly, and past price behaviour does not guarantee future outcomes. Please consult a SEBI-registered financial advisor before making any investment or trading decisions, and ensure appropriate risk management at all times.
Bankniftyanalysis

Bank Nifty will go to 64180?As per Harmonic PRZ pattern, Banknifty my go to further up till 64180 within few weeks. SL 53590

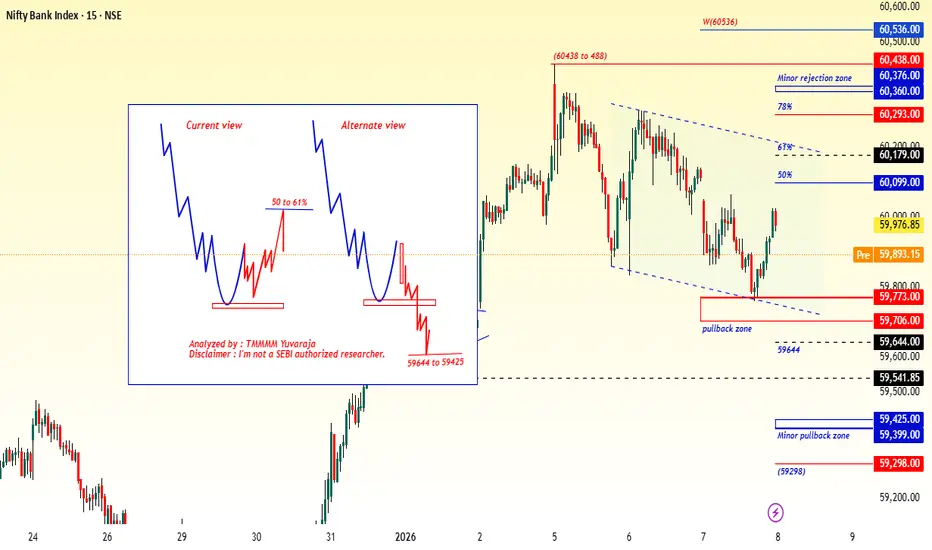
#Banknifty Directions and Levels for Jan 8Current View
The current view suggests that the corrective pullback could be a three-wave structure.
So, even if the market opens on a negative note, we can expect some consolidation around the previous day’s range.
Note: In this scenario, the market does not break the previous day’s low during the initial phase.
Alternate View:
The alternate view suggests that if the market starts negatively and breaks the previous day's bottom, we can expect correction continuation.
However, note that these kinds of gradual moves will react to each and every support level—take positions a little carefully.
#Banknifty Directions and Levels for Jan 7Bank Nifty
Current view: This differs slightly from Nifty—not much, but it seems like a solid range market. So, if the market reaches the pullback zone with some consolidation, or if it opens positively, the range-bound market will likely continue.
Alternate view: If the market takes a solid initial decline and sustains it, the correction will likely continue.

#Banknifty Directions and Levels for Jan 6 > The market has taken a 61% retracement of the minor swing. This lies in the mid-range of the swing; therefore, today’s market may undergo consolidation within the previous day’s range.
> We can expect a clear directional move only if the market breaks either the current swing high or the swing low. Until then, the market bias remains neutral.

#Banknifty Directions and Levels for Jan 5Alternate view
The alternate view suggests that if the market sustains the gap up and breaks the immediate resistance level, the rally will likely continue.
Current view (based on Elliott wave)
There are no supporting factors for this view. However, in my experience and as per theory, if the market rejects around the immediate resistance zone or if the initial market declines, we can expect a minimum of 23% to 38% retracement in the minor swing. Because the inner wave counts show a single pullback wave, followed by a minor decline, that’s why I prefer this view.

AXISBANK Weekly Bullish Flag Breakout | Multiple Targets to 1477AXISBANK Weekly Bullish Flag Breakout | Multiple Targets to 1,477.30+ | Weekly Analysis
━━━━━━━━━━━━━━━━━━━━━━━━━━━━━━━━━━━━━━━━━━━
📊 TECHNICAL SETUP
Current Price: 1,279.40 (+0.39% | +5.10)
Timeframe: Weekly (1W)
Symbol: AXISBANK (Axis Bank Limited)
Exchange: NSE
Category: Stock / Banking Sector
━━━━━━━━━━━━━━━━━━━━━━━━━━━━━━━━━━━━━━━━━━━
🎯 PATTERN ANALYSIS
AXISBANK demonstrates a STRONG WEEKLY BULLISH FLAG BREAKOUT pattern:
✅ Flag Structure: Clear flagpole followed by tight consolidation
✅ Breakout Confirmation: Price decisively breaking above upper flag boundary on weekly close
✅ Support Levels: Multiple support zones identified with strong holding
✅ Volume Profile: Healthy accumulation visible in weekly volume patterns
✅ Momentum: Sustained bullish momentum with consistent weekly closures above key levels
The stock shows textbook uptrend characteristics with proper support/resistance relationships, confirming the bullish structural bias.
━━━━━━━━━━━━━━━━━━━━━━━━━━━━━━━━━━━━━━━━━━━
📈 PRICE TARGETS (Progressive Levels)
1st Target: 1,301.90 (+2.0% from current)
2nd Target: 1,331.10 (+4.3% from current)
3rd Target: 1,360.35 (+6.6% from current)
4th Target: 1,389.60 (+8.9% from current)
5th Target: 1,418.85 (+11.2% from current)
6th Target: 1,448.10 (+13.5% from current)
7th Target: 1,477.30 (+15.8% from current)
These progressive targets represent key resistance zones and profit-taking levels along the uptrend path. Each level provides strategic exit points for partial position management.
━━━━━━━━━━━━━━━━━━━━━━━━━━━━━━━━━━━━━━━━━━━
🛡️ RISK MANAGEMENT
Entry Zone: 1,270.00 (Breakout confirmation point)
Stoploss: 1,201.00 (Weekly support - critical level)
Risk/Reward Ratio:
- Risk (1,270 to 1,201) = 69 points
- Reward (1,270 to 1,477) = 207 points
- R:R Ratio = 1:3.0 (Excellent)
Position Sizing: Risk only 1-2% of capital per trade
Stoploss is placed BELOW major weekly support level.
Consider scaling in on dips toward intermediate support.
━━━━━━━━━━━━━━━━━━━━━━━━━━━━━━━━━━━━━━━━━━━
📍 KEY SUPPORT & RESISTANCE
Immediate Support: 1,270.00 (Recent breakout level)
Secondary Support: 1,201.00 (Stoploss / Major support)
Resistance 1: 1,301.90 (1st Target)
Resistance 2: 1,389.60 (Mid-term resistance)
Major Resistance: 1,477.30 (7th Target / Final Target)
Intermediate Levels: Multiple targets provide stepping stones for profit realization at each resistance zone.
━━━━━━━━━━━━━━━━━━━━━━━━━━━━━━━━━━━━━━━━━━━
🔍 FUNDAMENTAL CATALYST
Recent Q3 deposit and CASA data from smaller PSU banks shows strong positive momentum:
✅ Double-digit deposit growth across system
✅ Improving CASA ratios and funding mix
✅ Robust retail liability momentum
✅ This strength suggests large private banks like AXIS will deliver solid operating performance
✅ Higher probability that AXIS continues to benefit from banking sector tailwinds
This macro backdrop reinforces the technical bullish bias and increases conviction for trend continuation.
━━━━━━━━━━━━━━━━━━━━━━━━━━━━━━━━━━━━━━━━━━━
🎉 TECHNICAL OBSERVATIONS
• Weekly uptrend remains intact with clear higher highs and higher lows
• Flag breakout on volume confirms institutional participation
• Stock consolidating at higher levels - sign of strength
• Volume profile shows healthy accumulation pattern
• Multiple targets suggest strong resistance zones ahead
• Proper risk/reward of 1:3.0 offers excellent entry/exit structure
• Support at 1,201 provides good risk management anchor
• Stock positions itself well for continued upside exploration
━━━━━━━━━━━━━━━━━━━━━━━━━━━━━━━━━━━━━━━━━━━
💡 TRADING STRATEGY NOTES
✓ Consider scaling entries - don't go all-in at once
✓ Trail stoploss after each target level is achieved
✓ Take partial profits at each resistance level
✓ Preserve capital: Use strict position sizing
✓ Monitor weekly closes carefully
✓ Watch for gaps and opening levels
✓ AXIS correlates with banking sector fundamentals
✓ Use proper hedging strategies if taking leveraged positions
━━━━━━━━━━━━━━━━━━━━━━━━━━━━━━━━━━━━━━━━━━━
⚠️ CRITICAL DISCLAIMER
🔴 THIS IS TECHNICAL ANALYSIS FOR EDUCATIONAL PURPOSES ONLY
🔴 THIS IS NOT FINANCIAL ADVICE OR AN INVESTMENT RECOMMENDATION
This analysis:
- Is based on historical price patterns and technical indicators
- Does NOT constitute investment advice or a buy/sell recommendation
- Is my personal observation and technical analysis
- Should NOT be the sole basis for any investment decision
- Stock performance depends on multiple macroeconomic factors
━━━━━━━━━━━━━━━━━━━━━━━━━━━━━━━━━━━━━━━━━━━
⚠️ IMPORTANT RISKS TO UNDERSTAND
✓ Past performance does NOT guarantee future results
✓ Technical patterns can FAIL and trends can reverse
✓ Market conditions can change rapidly without warning
✓ This analysis is based on historical data only
✓ Stock investments carry significant risk of loss
✓ You may lose your ENTIRE investment amount
✓ This is a technical observation, NOT a guaranteed strategy
✓ Consult a qualified financial advisor before trading
✓ Do your own independent research (DYOR)
✓ Use strict position sizing and risk management
✓ RBI policy changes can significantly impact banking stocks
✓ Interest rate fluctuations affect bank stocks
✓ Market liquidity and volatility can impact execution
✓ Economic indicators and earnings can invalidate patterns
━━━━━━━━━━━━━━━━━━━━━━━━━━━━━━━━━━━━━━━━━━━
🔴 FINAL RISK ACKNOWLEDGMENT
TRADING AND INVESTING IN STOCKS INVOLVES SUBSTANTIAL RISK OF LOSS.
I am NOT a financial advisor, fund manager, or investment professional. This analysis is provided for educational purposes only.
BEFORE MAKING ANY INVESTMENT DECISION:
✓ Conduct your own thorough research
✓ Understand macroeconomic factors affecting banking
✓ Check RBI policies and interest rate environment
✓ Verify your risk appetite and capital availability
✓ Consult with a qualified financial advisor
✓ Only invest capital you can afford to lose
✓ Never follow this as a guaranteed strategy
✓ Understand leverage implications if using derivatives
Your investment decisions are YOUR responsibility. Use proper risk management, stop losses, and position sizing.
━━━━━━━━━━━━━━━━━━━━━━━━━━━━━━━━━━━━━━━━━━━
Trade responsibly. Risk management is paramount.

BANKNIFTY Uptrend Continuation | Multiple Targets to 64,850 BANKNIFTY Uptrend Continuation | Multiple Targets to 64,850+ | Weekly Analysis
━━━━━━━━━━━━━━━━━━━━━━━━━━━━━━━━━━━━━━━━━━━
📊 TECHNICAL SETUP
Current Price: 59,711.55 (+1.19% | +700.20)
Timeframe: Weekly (1W)
Index: BANKNIFTY (Nifty Bank Index)
Exchange: NSE
Category: Index / Bank Sector
━━━━━━━━━━━━━━━━━━━━━━━━━━━━━━━━━━━━━━━━━━━
🎯 PATTERN ANALYSIS
BANKNIFTY demonstrates a STRONG UPTREND CONTINUATION pattern on the weekly timeframe:
✅ Uptrend Structure: Clear higher highs and higher lows intact
✅ Support Levels: Multiple support zones identified with strong holding
✅ Breakout Confirmation: Price decisively breaking above consolidation areas
✅ Volume Profile: Strong accumulation visible in weekly volume data (1.01B shares)
✅ Momentum: Sustained bullish momentum with consistent weekly closures above key levels
The index shows textbook uptrend characteristics with proper support/resistance relationships, confirming the bullish structural bias.
━━━━━━━━━━━━━━━━━━━━━━━━━━━━━━━━━━━━━━━━━━━
📈 PRICE TARGETS (Progressive Levels)
1st Target: 60,425.00 (+1.2% from current)
2nd Target: 61,425.00 (+2.9% from current)
3rd Target: 61,925.00 (+3.7% from current)
4th Target: 62,925.00 (+5.4% from current)
5th Target: 62,425.00 (+4.5% from current)
6th Target: 62,925.00 (+5.4% from current)
7th Target: 63,425.00 (+6.2% from current)
8th Target: 63,925.00 (+7.0% from current)
9th Target: 64,425.00 (+7.9% from current)
Final Target: 64,850.00 (+8.6% from current)
These progressive targets represent key resistance zones and profit-taking levels along the uptrend path. Each level provides strategic exit points for partial position management.
━━━━━━━━━━━━━━━━━━━━━━━━━━━━━━━━━━━━━━━━━━━
🛡️ RISK MANAGEMENT
Entry Zone: 59,850.00 (Breakout confirmation point)
Stoploss: 58,150.00 (Weekly support - critical level)
Risk/Reward Ratio:
- Risk (59,850 to 58,150) = 1,700 points
- Reward (59,850 to 64,850) = 5,000 points
- R:R Ratio = 1:2.94 (Excellent)
Position Sizing: Risk only 1-2% of capital per trade
Stoploss is placed BELOW major weekly support level.
Consider scaling in on dips toward intermediate support.
━━━━━━━━━━━━━━━━━━━━━━━━━━━━━━━━━━━━━━━━━━━
📍 KEY SUPPORT & RESISTANCE
Immediate Support: 59,850.00 (Recent consolidation level)
Secondary Support: 58,150.00 (Stoploss / Major support)
Resistance 1: 60,425.00 (1st Target)
Resistance 2: 62,925.00 (Mid-term resistance)
Major Resistance: 64,850.00 (Final Target)
Intermediate Levels: Multiple targets provide stepping stones for profit realization at each resistance zone.
━━━━━━━━━━━━━━━━━━━━━━━━━━━━━━━━━━━━━━━━━━━
🎉 TECHNICAL OBSERVATIONS
• Weekly uptrend remains intact with higher highs and higher lows
• Index consolidating at higher levels - sign of strength
• Volume profile shows healthy accumulation pattern
• Multiple targets suggest strong resistance zones ahead
• Proper risk/reward of 1:2.94 offers good entry/exit structure
• Support at 58,150 provides good risk management anchor
• Index positions itself well for continued upside exploration
━━━━━━━━━━━━━━━━━━━━━━━━━━━━━━━━━━━━━━━━━━━
💡 TRADING STRATEGY NOTES
✓ Consider scaling entries - don't go all-in at once
✓ Trail stoploss after each target level is achieved
✓ Take partial profits at each resistance level
✓ Preserve capital: Use strict position sizing
✓ Monitor weekly closes carefully
✓ Watch for gaps and opening levels
✓ Bank index correlates with banking sector fundamentals
✓ Use index futures for leveraged strategies (with caution)
━━━━━━━━━━━━━━━━━━━━━━━━━━━━━━━━━━━━━━━━━━━
⚠️ CRITICAL DISCLAIMER
🔴 THIS IS TECHNICAL ANALYSIS FOR EDUCATIONAL PURPOSES ONLY
🔴 THIS IS NOT FINANCIAL ADVICE OR AN INVESTMENT RECOMMENDATION
This analysis:
- Is based on historical price patterns and technical indicators
- Does NOT constitute investment advice or a buy/sell recommendation
- Is my personal observation and technical analysis
- Should NOT be the sole basis for any investment decision
- Index performance depends on multiple macroeconomic factors
━━━━━━━━━━━━━━━━━━━━━━━━━━━━━━━━━━━━━━━━━━━
⚠️ IMPORTANT RISKS TO UNDERSTAND
✓ Past performance does NOT guarantee future results
✓ Technical patterns can FAIL and trends can reverse
✓ Market conditions can change rapidly without warning
✓ This analysis is based on historical data only
✓ Index investments carry significant risk of loss
✓ You may lose your ENTIRE investment amount
✓ This is a technical observation, NOT a guaranteed strategy
✓ Consult a qualified financial advisor before trading
✓ Do your own independent research (DYOR)
✓ Use strict position sizing and risk management
✓ Never trade leverage without understanding risks
✓ RBI policy changes can significantly impact banking sector
✓ Interest rate fluctuations affect bank stocks
✓ Market liquidity and volatility can impact execution
✓ Economic indicators and earnings can invalidate patterns
━━━━━━━━━━━━━━━━━━━━━━━━━━━━━━━━━━━━━━━━━━━
🔴 FINAL RISK ACKNOWLEDGMENT
TRADING AND INVESTING IN INDEX FUTURES/DERIVATIVES INVOLVES SUBSTANTIAL RISK OF LOSS.
I am NOT a financial advisor, fund manager, or investment professional. This analysis is provided for educational purposes only.
BEFORE MAKING ANY INVESTMENT DECISION:
✓ Conduct your own thorough research
✓ Understand macroeconomic factors affecting banking
✓ Check RBI policies and interest rate environment
✓ Verify your risk appetite and capital availability
✓ Consult with a qualified financial advisor
✓ Only invest capital you can afford to lose
✓ Never follow this as a guaranteed strategy
✓ Understand leverage implications if using derivatives
Your investment decisions are YOUR responsibility. Use proper risk management, stop losses, and position sizing.
━━━━━━━━━━━━━━━━━━━━━━━━━━━━━━━━━━━━━━━━━━━
Trade responsibly. Risk management is paramount.

31 Dec 2025 — Last Trading Day of the Year (Wining +15 Points)🚀 Thank You Traders!
Wishing everyone a powerful & profitable journey in 2026 with the BTR Price Action Indicator.
2025 was just the beginning…
BTR Price Action launched in Dec 2025 — and even with just one month of live testing, we saw consistent clarity, clean entries, and multiple winning trades.
📌 Today’s Trade — BSE LTD
Timeframe: 15M
Signal: Long (Buy)
Entry: 2620
Exit: 2635
Profit: +15 Points in Intraday 💥
➡️ Market conditions didn’t matter.
➡️ No noise, No confusion.
➡️ Just follow BTR.
🔄 What Happened
BTR Price Action generated a fresh long signal
Entry Activated at 2620
Target Reached → Exit at 2635
Another Winning Trade to close the year 🎯
🔥 2026 Vision
2026 = Full Year of Trading with BTR
📈 More setups
📈 More confidence
📈 More rule-based entries
📈 More discipline
📈 More success stories
I’ll share a complete recap of all December 2025 trades soon.
Stay tuned!
💡 Want to Start with BTR?
📌 Go to my TradingView Profile → Scripts Section
📌 Add BTR Price Action Indicator
📌 Start trading with clarity, not chaos.
🚀 Happy New Year in Advance 🥳
Follow BTR. Follow Discipline.
Let’s Win 2026 Together. 💙📊

#Banknifty Directions and Levels for December 30Bank Nifty
> If the market breaks yesterday's low with solid structure, correction will likely continue to 58,737–58,641 (current view).
> On the other hand, if the initial market pulls back and breaks yesterday's high, it could reach 59,070–59,183 (alternate view).

#Banknifty Directions and Levels for December 23Bank Nifty
Current view:
> If the market opens with a gap-up, structurally we could see a long rally that may reach a minimum of 59,545 to 59,651.
Alternate view:
> If the gap-up does not sustain and declines, we can expect a 23% to 38% retracement in the current swing. Structurally, it may fail to break. However, if it breaks, we could expect a range-bound market

#Banknifty Directions and Levels for December 22ndWhat to Expect Today?
> As per the structure, we can expect rally continuation. However, there could be some consolidation around the minor rejection zone.
> Because structurally, the long rally could be a 3rd wave, followed by a 4th consolidation wave if it rejects any resistance. So, I'm expecting a max 23% to 38% retracement in the minor swing if it rejects there.
> Note: The retracement should not break 38%. If it does, as usual, we could consider that a range market

#Banknifty directions and levels for December 17th:What to expect today?
Current view:
> If the market opens with a decline and holds it, we can expect further continuation with some consolidation. Both price structure and OI data support this sentiment.
Alternate view:
> If the market opens with a gap-up or takes a solid pullback at either of the immediate support levels, it could experience a minimum 38% pullback. However, until it breaks above the 38% level, the market bias remains bearish. If it does break, we can expect a move to the top of the range in the upcoming session.

Banknifty Intraday Levels : 24-Nov-25Banknifty closed near the support level of trendline and Support Zone sustain above the zone upside move and if break will expect downfall
Bearish < 58500
Bullish > 59000
Wait for Proper Rejection/Pattern :
Support : Bullish
Resistance : Bearish
Use Sl Trailing to reduce Risk
*All views for educational purpose only
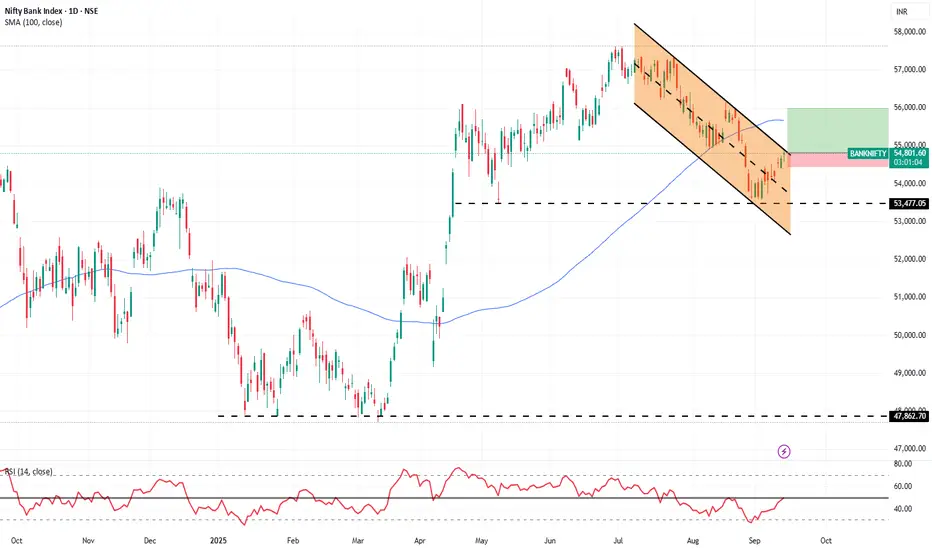
Banknifty analysis (bearish to sideways)Recently, a small bounce is visible, but candles are weak. not reversal yet
Volumes are mixed, but strong selling volume in seen on the drop.
Trend is bearish to sideways, if it sustains above 54600 , more upside till 55200 is possible.
Below 54000 fresh downside may open toward 53200-53000 .
Disclaimer:
I am NOT a SEBI registered advisor nor a financial advisor.
Any investments or trades I discuss on my blog are intended solely for educational purposes and do not represent specific financial, trading, or investment advice.
Disclosure:
I, the author of this report, and my immediate family members do not have any financial interest or beneficial ownership in the securities mentioned herein at the time of publication.
banknifty setup for 26/sept/2025banknifty trend is negative now 55000 is major support .
55800/55000 both level active for put side
tgt -200/400 points.
call only above 55080 ok tgt 55200/55400
dont jump without active levels .
dear retail traders beat the sideways trape an follow my setup
banknifty setup for 25/sept/2025all setup was hit earlier.
55300-55000 range .
55300 above tgt 55500/55700
55000 below tgt 54800/54500
55000 below strong bearish in trend.
dear retailers follow setup.

Flower Nahi Fire haiBanknifty is firing on all engines on daily charts.
Major components of bank nifty, icicibank & hdfcbank are ready to take bank nifty to sky.
Buy banknifty fut above 54825(spot) with stoploss below 54450 & target of 56000
Tata MotorsTrade Setup (Positional Swing)
Buy Zone: ₹705–715 (near breakout level)
Target 1: ₹760
Target 2: ₹800
Target 3 (extended): ₹850
Stop Loss: ₹670 (below recent support & triangle lower trendline)
⚠️ Note: Since this is a weekly chart, the move can take a few weeks/months to play out. Keep trailing your stop loss higher if price sustains above targets.

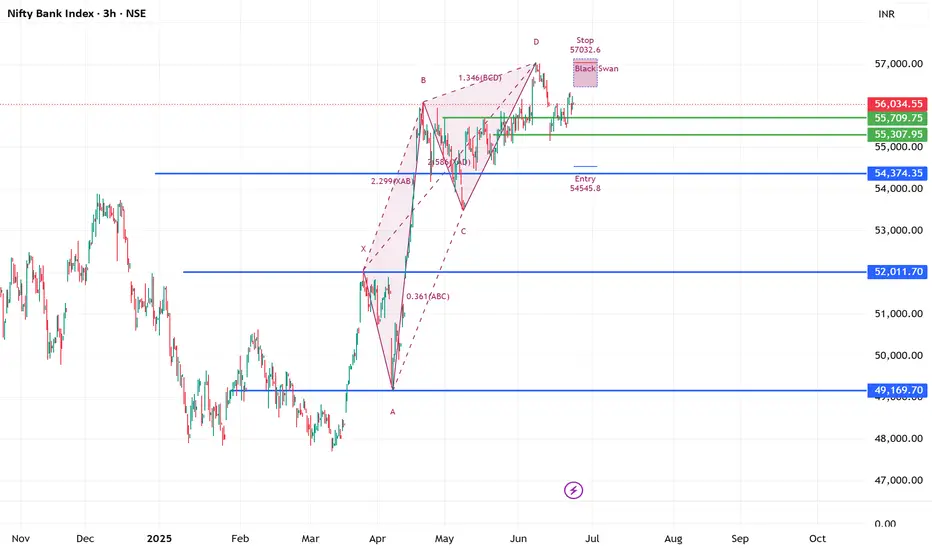
Berish Black Swan (Harmonic pattern) Running in #BANKNIFTY 3hrs56069 spot 23-06-2025
patterns clearly suggest after hitting ATH 57049
at this angel 1.346 BCD move completed by price
now due to amid war situation traders must take extra cautious approach
this is pure educational based study !!!!!
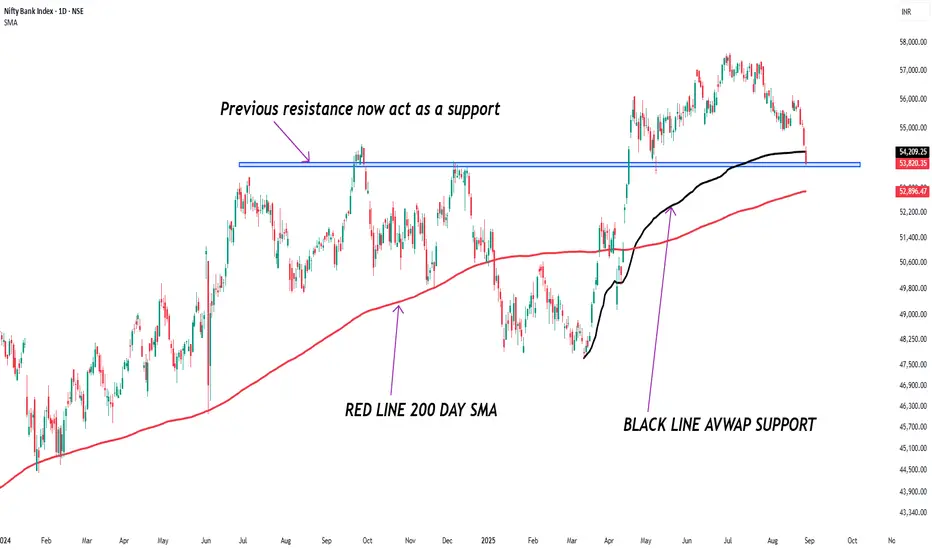
Price trading near Multiple supportHigh probability banknifty price hold this level and bounce from here
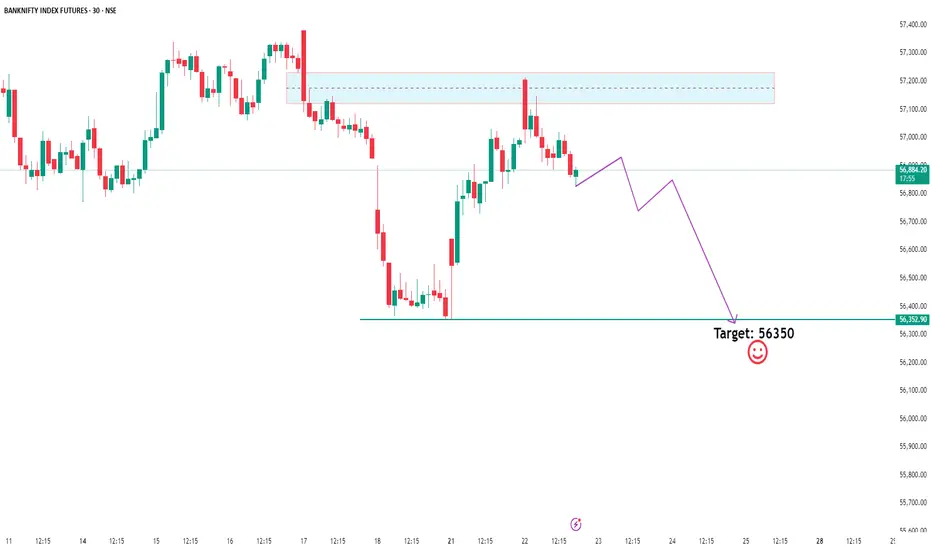
Bank Nifty Breakdown? Eyeing 56,350 –Time to Ride the Sell Wave!Bank Nifty is showing clear signs of distribution as Smart Money appears to be offloading positions near recent highs. Price has swept liquidity above the previous highs and is now rejecting key supply zones, confirming a potential sell-side shift in market structure.
With a break in internal structure and premium zones being respected, we're now watching the 56,350 level as a high-probability target for downside liquidity.
If you're trading with the Smart Money Concept in mind — this could be the move where retail gets trapped while institutions ride the wave down. Stay sharp and manage your risk accordingly. 👀🔥
[INTRADAY] #BANKNIFTY PE & CE Levels(21/07/2025)Bank Nifty is expected to open with a gap-up, indicating early bullish sentiment. However, price action near the 56,450–56,500 zone will be crucial in deciding the day’s direction. If Bank Nifty manages to sustain above the 56,650 level after opening, it may invite fresh momentum on the upside. A move above this zone can be seen as a strength confirmation, potentially pushing the index toward targets of 56,750, 56,850, and even 56,950+ levels.
On the other hand, if the index faces resistance and shows rejection from the 56,450–56,400 supply zone, weakness can creep in. This could trigger a corrective move toward the lower levels of 56,250, 56,150, and 56,050-, making it a favorable short trade setup for the day if confirmed by price action.
Additionally, a breakdown below the 55,950 support level can lead to strong bearish pressure. If this level is breached and sustained, the index may fall sharply toward the support zones of 55,750, 55,650, and 55,550-, indicating bearish continuation.
