BAT Analysis (4H)From the point we marked as the start, BAT appears to have entered a bullish diametric pattern.
It now seems to be in wave F, which is a bearish wave.
We have identified two entry points for BAT, where positions can be opened using a DCA approach.
The targets have been marked on the chart.
A daily candle close below the invalidation level will invalidate this analysis.
For risk management, please don't forget stop loss and capital management
When we reach the first target, save some profit and then change the stop to entry
Comment if you have any questions
Thank You
Batanalysis

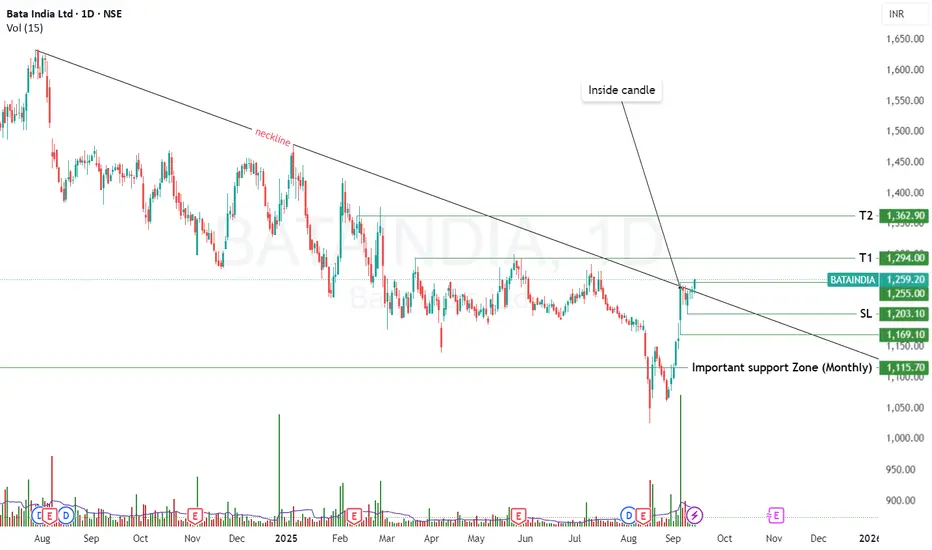
Bata - Momentum + improving RSI + MA crossovers supportBata – Technical Setup
Trend Context: After a prolonged bearish phase, Bata has shown signs of reversal from a strong support zone around ₹1100.
Price Action: Recently, the stock formed a base near support and has now given a trendline/neckline breakout. On the daily chart, the inside candle breakout adds confirmation of bullish momentum.
Levels to Watch:
Entry: Above inside candle breakout (sustaining strength).
Stop Loss: ₹1200 (round level support) – keep it strict.
Targets:
T1: ₹1294 – near-term resistance.
T2: ₹1362 – next resistance / swing target.
Weekly View: The stock is trying to reverse its medium-term structure. Sustaining above 1290–1300 will add conviction for higher levels.
✅ Summary Trade Idea:
Bata looks attractive after reclaiming support and giving a confirmed breakout. Risk is well-defined at 1200, while upside targets of 1294 / 1362 offer favorable risk-reward if momentum sustains.
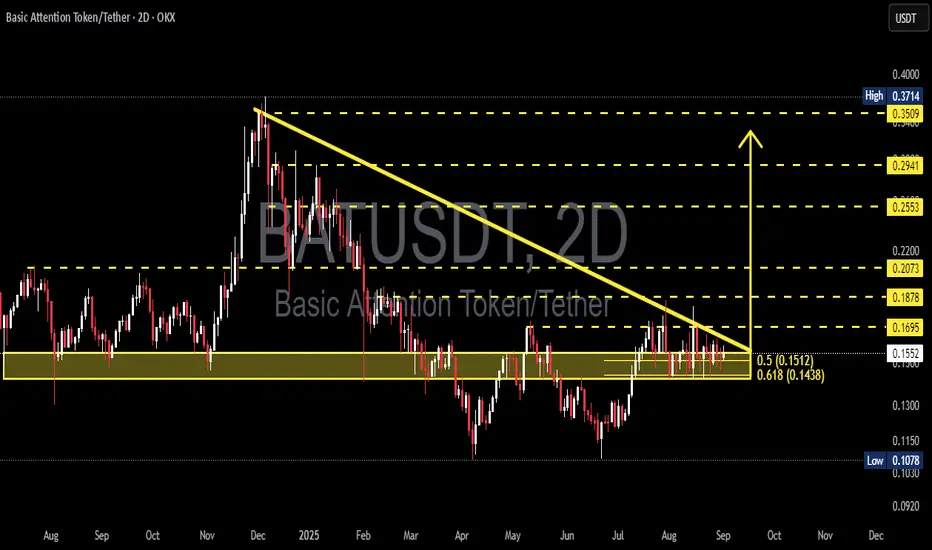
BAT/USDT — Critical Zone: Breakout or Breakdown Ahead?Summary:
BAT is currently consolidating at a critical support zone after a prolonged downtrend. Price action is being squeezed between a descending trendline from late 2024 highs and a strong horizontal support area at 0.1438–0.1512 (Fibonacci 0.618 & 0.5). This structure has formed a descending triangle / falling wedge on the 2D timeframe. The market is waiting for a decisive move: will bulls manage a breakout reversal, or will bears push for a breakdown continuation?
---
🔎 Chart Breakdown
1. Strong Support Zone
0.1512 (Fib 0.5) and 0.1438 (Fib 0.618) have repeatedly acted as a demand area.
Price is consolidating inside this yellow box region.
2. Descending Trendline
Connecting lower highs since December 2024.
Price is now at the apex, nearing a decisive breakout or breakdown.
3. Key Resistances to the Upside
0.1695 → 0.1878 → 0.2073 → 0.2553 → 0.2941 → 0.3509 (with 0.3714 high as the major resistance).
4. Supports Below
First target at 0.115.
Deeper support at 0.1078 (previous structural low).
---
📈 Bullish Scenario
Trigger:
A confirmed 2D candle close above the descending trendline and 0.1695, supported by strong breakout volume.
Validation:
Retest of the broken trendline as new support.
Targets:
TP1: 0.1878
TP2: 0.2073
TP3: 0.2553
Extended: 0.2941 → 0.3509
Stop-loss:
Conservative: below 0.1435.
Aggressive: below 0.151.
Bullish Conclusion:
If price breaks upward, this pattern may act as a falling wedge reversal, opening room for a significant rally after a long accumulation.
---
📉 Bearish Scenario
Trigger:
A 2D candle close below 0.1438, ideally with high selling volume.
Validation:
Failed retest of the support area, confirming it as resistance.
Targets:
TP1: 0.115
TP2: 0.1078 (previous macro low).
Stop-loss:
Above the descending trendline or between 0.155–0.17, depending on entry.
Bearish Conclusion:
If support breaks, the descending triangle will confirm as a bearish continuation pattern, exposing lower liquidity zones and potentially retesting macro lows.
---
📌 Pattern Insight
Descending Triangle: typically a bearish continuation signal.
Falling Wedge: often a bullish reversal pattern.
Current structure could validate either direction → confirmation is key.
---
📝 Trading Strategy & Risk Management
Risk per trade: 1–2% of capital maximum.
Watch for false breakouts (long wicks without strong volume).
Always check BTC market trend, as altcoins usually follow Bitcoin’s direction.
Confirmation tools: RSI above 50 & bullish MACD cross for upside, or opposite for downside.
---
📢 Final Notes
BAT is at a make-or-break level. The next 2D candle close, combined with volume confirmation, will likely decide the next major move. Traders should remain patient and avoid premature entries until the direction is clear.
#BAT #BATUSDT #Crypto #TechnicalAnalysis #Breakout #Bearish #Bullish #Altcoins #PriceAction
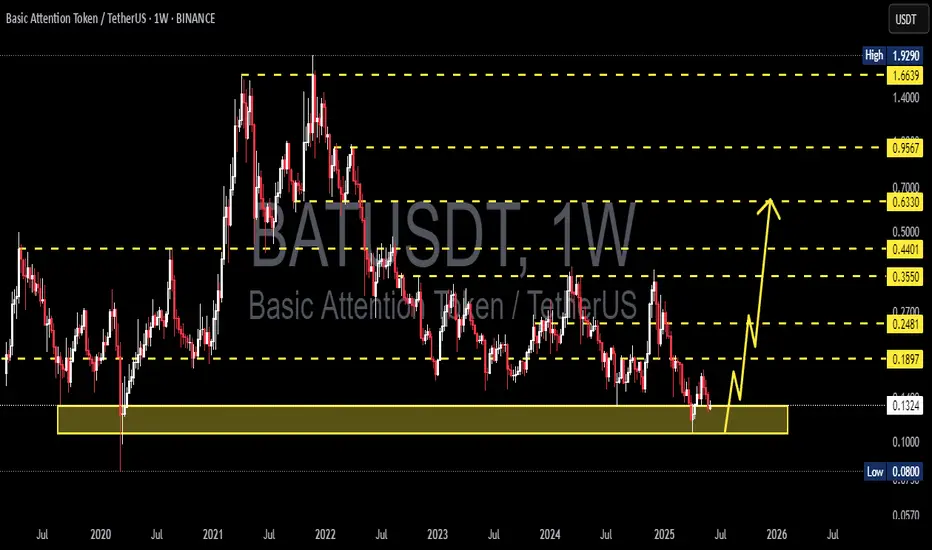
BATUSDT 1W AnalysisBAT ~ 1W Analysis
#BAT This trade is very high risk
This is the lowest support block for now. Buy with a short term target of at least 20%+ from here.
BATUSDT 1D Analysis BAT ~ 1D Analysis
#BAT Buy gradually from here if you still have confidence in this coin with a short term target of at least 15%+ from here.

BATUSDT 1D AnalysisBAT ~ 1D Analysis
#BAT Buy when re -testing this support block with a short -term target of at least 10%+ from here.

BATUSDT 1WBAT ~ 1W Analysis
#BAT Buy gradually from here with a short -term target of at least 20%+. This is the lowest support block for now.

BAT is Bullish, after the pullback it will continue the trend BAT is Bullish, after the pullback it will continue the trend
🔵Entry Zone 0.3007 - 0.3184
🔴SL 0.2749
🟢TP1 0.3366
🟢TP2 0.3969
🟢TP3 0.4810
🟢TP4 0.5448
Risk Warning
Trading Forex, CFDs, Crypto, Futures, and Stocks involve a risk of loss. Please consider carefully if such trading is appropriate for you. Past performance is not indicative of future results.
If you liked our ideas, please support us with your likes 👍 and comments.

BAT Has A very good investment opportunity Hi Everyone;
today we have one of the best risk to reward Investment opportunity
it is more than 600 times the risk and the chart is look very promising.
I expect breaking the previous bear market key point will clear the way to the final target

BAT 100% PROFIT POTENTIALBat Testing Trendline In Daily Timeframe
Incase Of breakout Expecting 100% Bulish WAve

BAT/USDT - Potential Short ScenarioHello Traders!
BAT moves within the descending trend, gradually completing the previous market cycle.
The price is near the resistance level of $0.43, which will serve as a trigger for the continuation of the local counter-trend movement.
We can assume that if the local trend breaks, the downward pricing on the asset will continue. We should expect the culmination of the sales in the price range of $0.18 - $0.274 after the price leaves under the support level of $0.274.
It is possible to look for medium-term purchases of the asset near the support level of $0.18 in the price range of $0.18 - $0.22.
The targets of such purchases will be the price levels of $0.43 and $0.59
Good luck and watch out for the market
P.S. This is an educational analysis that shall not be considered financial advice
