#Basic Attention Token | Prepare To Take OffEntry : 0.00002348 - 0.00002251
Target 1 : 0.00002505
Target 2 : 0.00002722
Target 3 : 0.00002863
Target 4 : 0.00003264
Target 5 : 0.00003455
Stop loss : 0.00002154
Risk/Reward : 5%/52%
Do not risk a large amount of your money
Do not hurry to buy, the price may go down to good places
Please share your opinion in the comments box and do not forget to press the like button
Add to watchlist
Batusd

BATUSD - 120% Gain Trade SetupIn depth analysis of BAT/USD.
Two elements that I use to analyse my charts are hidden. Meanwhile there is also a double-bottom formation and a higher low.
120% gain for about 23% risk.
Who's in?

BATUSDT formed bullish Shark | Upto 90% bullish move expectedPriceline of Basic Attention Token / US Dollar cryptocurrency has formed a bullish Shark pattern and entered in potential reversal zone.
This PRZ area should be used as stop loss in case of complete candle stick closes below this zone.
I have used Fibonacci sequence to set the targets:
Buy betwee: 0.1593 to 0.1291
Sell between: 0.1861 to 0.2458
Regards,
Atif Akbar (moon333)

BATUSDT found resistance |all indicators,patterns are bullishOn day chart the price action of Basic Attention Token (BAT) has found $0.1959 and resistance at $0.1487 this support of 0.1487 dollar was found 29 Aug 2019 when the price action took drop more than 29% upto $0.1326 but since then the priceline could not break down this support.
Sofar this support has been found very firm therefore we can expect a breakout form here or more sideways move at this level for some more time.
Indicators and Oscillators:
Price action is hitting the upper band of Bollinger bands and the mouth of bollinger bands is expanding and moving up.
Relative Strength Index (RSI) was oversold up till 18 Dec and now bullish.
Moving average convergence divergence (MACD) is strong bullish.
And if we see the Directional movement the +DI has crossed up -DI and ADX is above 29 level and giving strong bullish signals.
On 12hr chart the Ichimoku cloud is turned bullish and lagging span of ichimoku cloud has crossed up the priceline and the price action has also crossed up the bearish cloud on the other hand the chop zone has also given strong bullish signals by turning bullish.
Moving Averages:
If we see the simple moving averages with time period of 25 50 100 and 200 the we have the same position as we had in Sep 2019 the order of moving averages was as:
25MA was below all then we had 50MA then 100MA and then 200 simple moving average was above all then on 3rd Nov 2019 a complete alligator mouth was opened which was formed with 25MA , 50MA and 100 simple moving average but 200MA was not able to be the part of this alligator mouth and the price action turned bullish and hit the $0.2784 which was the highest point since Sep 2019 to the date of writing.
The moving averages are likely to make the same move and 25MA has crossed down the price action and pushed the candles sticks up now the price line has hit the 50MA and 50MA is likely to cross down the price action soon and this will also lead to the golden cross between 25MA and 50MA then a strong bullish divergence can push the price action more to cross up the 100SMA and then the price action will hit the 200SMA and if the price action will be able to cross up the 200 simple moving average then we can see a complete alligator opened mouth between all these simple moving averages and the price action can hit the second resistance level at $0.2695 and if this resistance level will be broken then a strong bull run can be observed.
The Harmonic Move:
In my previous predicted that Basic Attention Token has formed the Shark pattern and it will hit the projection area of 0.382 to 0.786 Fibonacci of C to D leg of this Shark pattern and below was the article:
Now you can see sofar the price action has taken the bullish divergence form the potential reversal zone of this Shark pattern and entered in this projection zone as I predicted Alhamdulillah and sofar it has produced more than 25% gains this is a very positive signal but we need a breakout the 0.786 Fibonacci projection level in order to start a real bull run and as we have see above all signals from moving averages and indicators are turning bullish so it is really possible
So guys be ready I hope this prediction will be full filled soon as my previous article however if you have any suggestion and ideas you can share in comments section with me.
Thanks and Regards,
Atif Akbar (moon333)

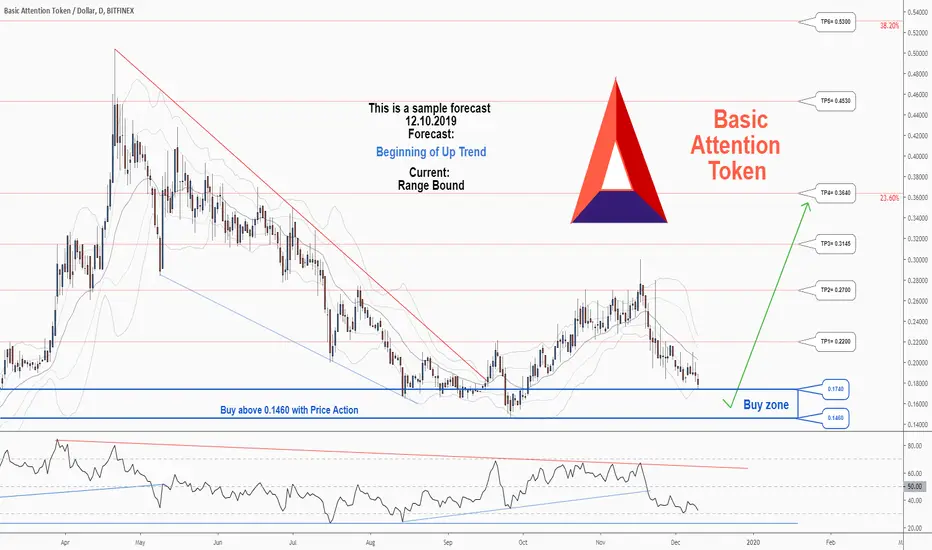
There is a trading opportunity to buy in BATUSDTechnical analysis:
. BasicAttentionToken/US Dollar is in a range bound and the beginning of uptrend is expected.
.The price is above the 21-Day WEMA which acts as a dynamic support.
. The RSI is at 51.
Trading suggestion:
. There is a possibility of temporary retracement to suggested support zone (0.174 to 0.146). if so, traders can set orders based on Price Action and expect to reach short-term targets.
Beginning of entry zone (0.174)
Ending of entry zone (0.146)
Entry signal:
Signal to enter the market occurs when the price comes to " Buy zone " then forms one of the reversal patterns, whether " Bullish Engulfing ", " Hammer " or " Valley " in other words, NO entry signal when the price comes to the zone BUT after any of reversal patterns is formed in the zone. To learn more about " Entry signal " and the special version of our " Price Action " strategy FOLLOW our lessons :
Take Profits:
TP1= @ 0.2200
TP2= @ 0.2700
TP3= @ 0.3145
TP4= @ 0.3640
TP5= @ 0.4530
TP6= @ 0.5300
TP7= @ 0.6660
TP8= @ 0.8010
TP9= @ 1.2385
TP10= Free

BAT prediction 2020!So looking at the fundamentals, BAT is one of the best in the whole crypto space. It is quite reasonable to say we are in this triangle formation with an apex in april 2020! With the next altcoin boom, if we can get above the 0.5usd level and will create a higher high, expect the price of BAT to start rising. I would say it is very likely we are going to break the previous ATH in 2020. Things are looking bullish!

BATBTC 4HBat token; trying to break to the falling wedge, RSI is overbought now and there is divergence therefore minor correction is possible but overall looks good and bullish crossover on.. Break a leg!

BAT/BTC TA Update (Bullish Bounce Off?)BAT/BTC
BAT bounces off right at the 0.618 golden Fib and currently fight the downward resistance coming from the previous Swing High at 3263 sats area. If BAT can break outside this trend-line,
I can see upside action up to the 3000 area before hitting another strong resistance. Priority is going Long and stop-loss below 2200 sats area.

BAT may continue his correction since last HighHi, my first try here.
I'm trying to see the BAT going to give us some highs but, my very little knowings about elliott waves is telling me that we'll MAYBE have to be patient, seeing some more lows.
A good thing to accumulate !!
Comments are welcome, I want to progress. Thanks !

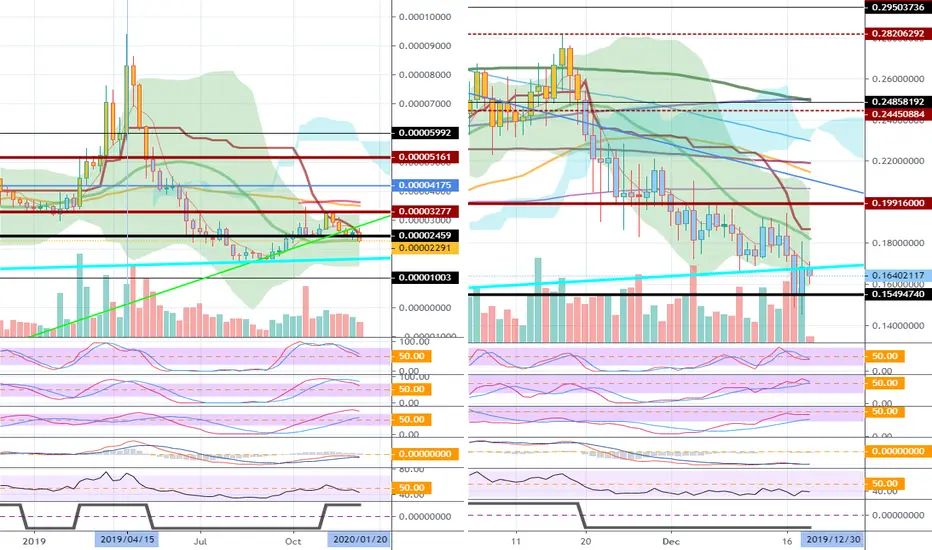
Basic Attention Token-BATBTC-
It fell below the 0.00002459 point and is now located near 20MA.
Check if you can climb above 0.00002459.
-BATUSD-
It fell below the long-term uptrend line.
Check if you can climb above the uptrend line.
Must be supported at 0.15494740.
---------------
On the BATBTC chart, movements at 0.00002459 are different between 2018 and 2019.
The reason for this is the aftermath of a lot of gains around April 2019.
Therefore, we believe that there is not enough power to ascend.
I think the price should be maintained between 0.00002459 and 0.00003277.


BAT/BTC TA Update (Minor Pump on the way?)BAT/BTC
BAT is on a deep downfall for 25 days already without any minor upward price reaction. It is holding the 100 Day MA as support currently and within the area of 0.618 Fib.
RSI is reaching an overbought condition. I expect a minor pump is due for a lower high to be set during this short term down-trend.

There is a possibility for the beginning of an uptrend in BATUSDTechnical analysis:
. BasicAttentionToken/US Dollar is in a range bound and the beginning of uptrend is expected.
. The price is below the 21-Day WEMA which acts as a dynamic resistance.
. The RSI is at 33.
Trading suggestion:
. There is a possibility of temporary retracement to suggested support zone (0.17400 to 0.14600). if so, traders can set orders based on Price Action and expect to reach short-term targets.
Beginning of entry zone (0.17400)
Ending of entry zone (0.14600)
Entry signal:
Signal to enter the market occurs when the price comes to " Buy zone " then forms one of the reversal patterns, whether " Bullish Engulfing ", " Hammer " or " Valley " in other words, NO entry signal when the price comes to the zone BUT after any of reversal patterns is formed in the zone. To learn more about " Entry signal " and the special version of our " Price Action " strategy FOLLOW our lessons :
Take Profits:
TP1= @ 0.2200
TP2= @ 0.2700
TP3= @ 0.3145
TP4= @ 0.3640
TP5= @ 0.4530
TP6= @ 0.5300
TP7= @ 0.6660
TP8= @ 0.8010
TP9= @ 1.2385
TP10= Free

BATBTC RetestLooking for a retest of the 0 fib line, very strong regression downtrend (0.92), double top has formed. Will this lead to a new oscillation trend as previously seen in bull runs of BAT? Feedback and areas to improve appreciated.

I AM BUYING BATUSDT - MORE UPSIDE POTENTIALFirst, clear 5 wave to the downside is finished.
We saw $0.1327 as local low. It could finished its' longer term correction.
The other possibility is impulsive move to the downside and correction to the upside as ABC.
Whether red ABC correction finish or not, good buying opportunity for me. Either it can play like ABC (big scale) or 12345 impulsive move to the upside.
12H Time frame BATUSDT at good buying zone. I am buyer $0.19 area right now. My stop is at $0.13
I can take profit if i will see 3 wave to the upside (red B play). Then i can add more at red C.
If its going up impulsively i will try to hold my position until $0.5 levels.
If its play like impulsive ;
Entry; $0.19
Stop; $0.13
TP; $0.50
R:R 5.167 which is AMAZING
As a trader have to be nimble and don't forget that it could be ABC correction to the upside still on the table.
I will decide this in action. Follow, share and like for more. Thanks.

BAT heading upBAT may have just broken out of the downward trend, here a possible targets heading up
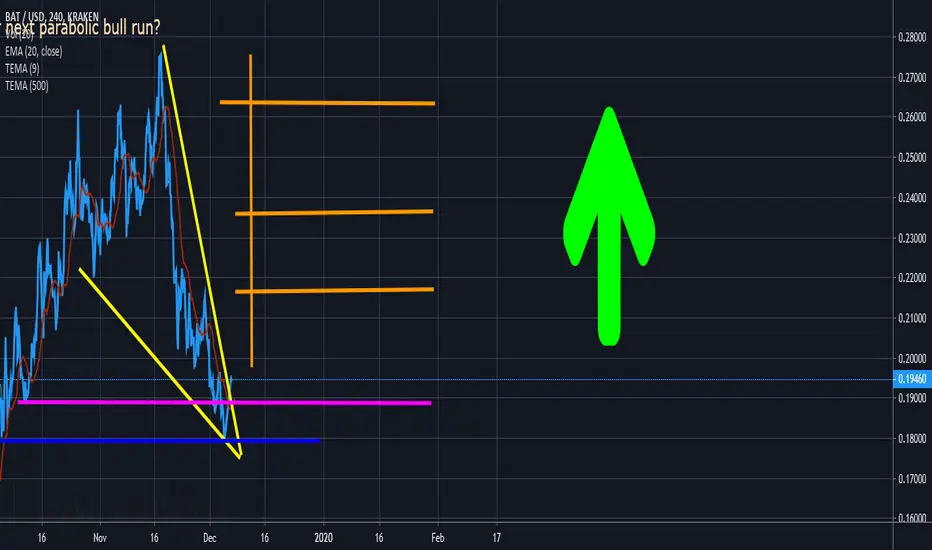
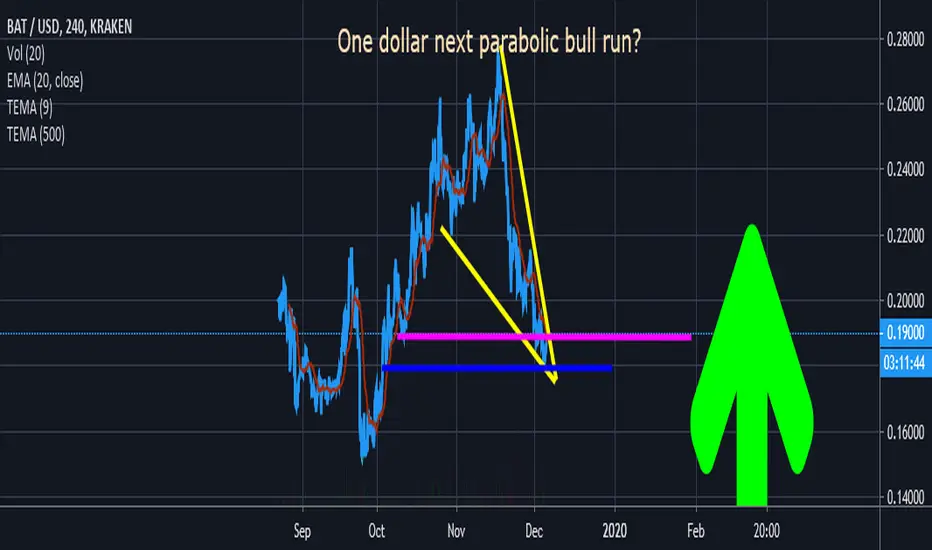
BAT going to $0.28 then 1$?The Basic Attention Token is severely under valued, will the next breakout see $0.28 or possibly back up to $1
*Ethereum platform is scheduled for some explosive growth
Keep watching this closely
Basic Attention TokenI will see it in the short term.
-BATBTC-
It is located near the 0.00002459 point.
It fell from the short-term uptrend line.
If you hold on well, you'll expect a big rise as before.
-BATUSD-
It fell to mid / long-term investment territory.
We look forward to gaining support from the upward trend line.

Bassic Attention Token Historical ChartBATUSD Weekly Chart with Fibonacci Levels, and potential EWT Count.
Disclaimer:
We are not registered or licensed in any jurisdiction whatsoever to provide investing advice or anything of an advisory or consultancy nature,
and are therefore are unqualified to give investment recommendations.
Always do your own research and consult with a licensed investment professional before investing.
This communication is never to be used as the basis of making investment decisions, and it is for entertainment purposes only.

Basic Attention TokenI'll take a mid to long term perspective.
BATBTC chart was added.
BAT also forms a box section.
It is between 0.00003277 and 0.00005161.
The current position is supported by the 0.00002459 branch that separates the long-term investment area.
We think that we face new opportunity.
We don't know whether it will rise to 0.00003277 ~ 0.00004175, the lower section of the box section, or 0.00004175 ~ 0.00005161, the upper section, but we believe it is worth investing in the medium to long term.
It is supported by the 0.19916000 branch and should be checked to see if it will completely move out of the downtrend line by around December 30th.
As long as we are on the uptrend line, we believe that buying is best done between the uptrend line and 0.19916000.
The primary target point is 0.37662744.
