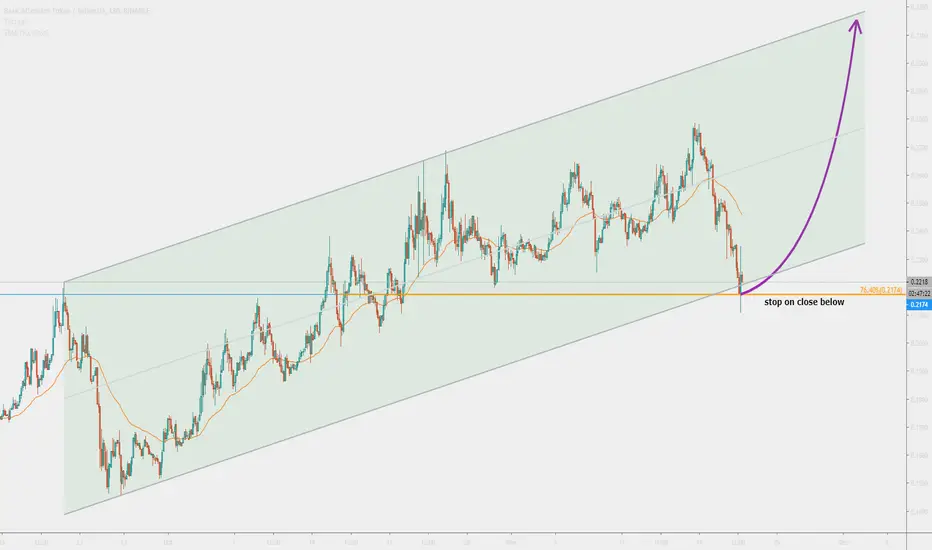
BATUSD has completed bullish setup | The BAT may hit beyond $2Despite the Basic Attention Token has very strong fundamentals and real use cases on different platforms we will only see the pure technical analysis in this post.
1st breakout and setup of initial leg:
The price action was moving within a pennant since Mar 2018 and its last hit the support of pennant was On Feb 2019, this was the initial setup of X to A leg of BAT pattern and the price action broke out the pennant resistance on Mar 2019 exactly after a year of the date of entrance in the pennant .
Formation of bullish BAT pattern:
After hitting $0.50 the price correction period started and the priceline dropped down to retest the resistance of the pennant as support but the bulls took over again did not let the price action hit the pennant resistance again in the meanwhile the priceline formed a complete bullish BAT pattern as A to B leg was retrace upto 0.50 Fibonacci then B to C leg projected between 0.382 to 0.886 Fibonacci and then C to D leg retraced up to 0.886 Fibonacci, this movement of the price action was perfect as required for BAT pattern .
Now the price action was supposed to take bullish divergence from this potential reversal zone which it has almost taken and now it is moving up.
The indicators and oscillators:
Stochastic has given bull cross from oversold zone and strong bullish .
MACD is turned weak bearish form strong bearish and now turning strong bullish soon just wait for bull cross from the MACD its mean that MACD is clearly indicating that the real game is not started yet, it will begin after when the MACD will be turned strong bullish .
Volume oscillator is moving up and this time it is assigned to bulls.
Price action went very close to lower bands of Bollinger bands but did not hit at the support ever, but this time in Aug 2019 price action has hit lower bands 1st time ever in the life of Basic Attention Token and bounced form this support.
The moving averages:
In above figure you can see in Mar 2019 the exponential moving averages EMA 10 and EMA 20 both moving averages crossed down the priceline one after another and lifted the price action up and formed a golden cross which produced a powerful bullish divergence same as like that now again EMA 10 and EMA 20 crossing down the price action and expected to form a golden cross soon which will again produce a powerful bullish move.
On day chart in Mar and April 2019 the golden crosses between simple moving averages MA 25 , MA 50 , MA 100 and MA 200 completely formed, and alligator mouth was opened which produced massive bull move same as like that again these simple moving averages are opening an alligator mouth you can see in above figure.
The trade volume:
The volume profile of complete pattern is showing traders interest is very weak at potential reversal zone level and after consolidation the priceline is now moving up and priceline can easily hit the POC level of volume profile .
Volume indicator is also showing that trading volume is also very low during consolidation period.
After getting confirmed from all indicators, moving averages , oscillators and patterns if we place the Fibonacci sequence method to confirm the buying and sell targets then technically the price action should move between below price range:
Buying zone: $0.14712 to $0.23280
sell zone: $0.28328 to $0.42727
But the real bullish setup is just completed on Basic Attention Token with Bitcoin pair's chart which can take the priceline above $2:
On July 28th I shared the chart of Basic Attention Token / Bitcoin where the price action has completed a big bullish Cypher pattern on 2 month chart and entered in potential reversal zone.
If you see above chart then the game is not started yet, it has just formed its setup and ready to produce upto 287% profit.
On this chart the volume profile is showing very weak interest of traders at PRZ or potential reversal zone level and we have a very strong support at 0.00002125 sats which is not broken since Mar 2018.
So when on this chart the price action will start bull move then it can be very powerful bull run coz this is the pattern on 2 month chart, but going above the $2 price is subjected to the BTC price if the Bitcoin will move above the $20K then definitely the Basic Attention will move beyond 2 dollars.
Regards,
Atif Akbar (moon333)
Batusd


AltCoins that im buying for 2020 #HODLWhat coins are good for next year?
Its alt season gonna start soon?
What are my favorite coins and where i can buy them? Lets find out in the next video traders. Bless

Basic Attention Token ($BAT) is going to get some attention.BAT is currently forming right shoulder of inverted H&S pattern.
Potential entry point is 3341 sats (break of the neck line).
With two potential target profits:
1. 4194 sats
2. 5113 sats
Do not forget about stop-losses.
It's not a financial advice.
Trade carefully and good luck!

BATUSDBAT is rising above 700MA on the daily chart and 100MA on the weekly chart.
If you can form a box segment from 0.28206292 to 0.30073596, you might be able to challenge 0.37662744.
However, it is expected to be difficult to form a box segment, and it will not be too late to trade if we can see if we can keep the price above the 0.24858192 point.
It would be better not to approach too hastily.
BAT believes that those who buy below the 0.24450884 point are more likely to start selling slowly if prices rise above 0.28206292.

BATUSDWe are looking forward to seeing a complete break out of the downtrend line.
It is an important day on November 14 and expects prices to stay above the 0.24858192 point.
If prices fall, we expect to touch the 20MA and 300MA nearby or 500MA points.
As BTC's inflection date is approaching, the price flow is not good.
I should be careful about trading.

Bat ters UP!If you haven't read Bat's story, you may wish to. It's a brilliant plan that addresses the frustration of retailers, advertisers and web surfers, with the new BRAVE Browser. With over 8 million active users they are turning the tables on business as usual. The absence of constant ads and trackers makes for a much speedier interface and its nice to know that not every keystroke is being monitored. Cool thing is we can get paid in BAT for looking at the ads we are actually interested in and merchants can be get paid for joining the revolution.
More details here: basicattentiontoken.org
Here we have a textbook example of what we want our biggest positions to look like. The Bears had a 182% run from mid April until mid September until they at last relinquished control to the Bulls. Bat has recovered 69% after shaking off the weak hands and is moving back north with overhead resistance occurring at multiples of .05 . Macd just had a bullish crossover, Stoch RSI is strong and steady, SQMOM is getting ready to turn green. This point in time is still pre-FOMO. What more can we ask for? This not investment advice and I am not licensed to dispense advice. Do your own due diligence. Happy trading!
Only thing I see that might improve this picture is a heavier volume red bar at the bottom pivot in September. What is your take on how the Bear run ended?

BAT Weekly LongMACD, RSI, Stochastic RSI and Squeeze Momentum all suggest that Basic Attention Token has upwards momentum and is about to move higher.
The brave browser is gaining users by the day while the BAT token is seeing increased adoption across a variety of platforms at an alarming rate.
I believe in the product behind Brave and the solution it provides for advertisers. Given the resurgent bullish momentum across the crypto market in recent weeks, I believe anything from .22-.26 is a buy.

BATUSD: Reversal Watch - 2-3x Potential on Positive GrowthAnalysis:
-Lots of action in a relatively tight range for several weeks now, roughly the $0.20 - $0.16 region.
-Alt run in action
-Band hits for default KC 1.25 have been a good indicator for reversal (either way).
-Volume lulls frequently lead to high volatility periods, and has shown on this chart.
-21w ROC has a well-validated buying level at roughly -65%.
-A higher low here, especially with 0.236 acting successfully as support, would likely imply a higher high with 0.786 being a likely scenario. This may hint at a long-term reversal for BAT, as it may finally make the switch from LH,LL,LH.... to HH,HL,HH.... Could the growth of Brave browser users and publishers be the impetus for this reversal?
With the alt season already running at full steam, it's tough to choose which alt will have the best returns. LINK, BAT, XRP, and several others will be fierce competitors for money pouring out of BTC. Interesting times indeed.

BATUSDWe expect the BTC's inflection date to begin on November 10th at 11:00 UTC.
This is expected to affect the price of BAT.
The next inflection date for BAT is around November 14.
If you succeed in keeping the price above the 0.24450884 point around November 14, you are likely to challenge the 700MA and 200MA.
If it fails to hold the price down, it should maintain the price above 500MA, leaving room for another major coin to rise.
It is important to stay out of the historical downtrend line and maintain price above 0.24450884.
It is likely to rise above 0.30073596 point.
If you climb above 0.37662744, it's surprising.
I think it is good not to expect too much rise this year.
(An inflection day is a day when price changes are severe or the flow can reverse or rebound.)

$BAT waiting for a Pullback before moon #BAT #BTCBAT / BTC : Its one of those few alts who has no affect of BTC bear Market, I am placing bids 2680 to 2560, Hope they get filled. I will target 3000 in short term and 4000 will be next Take profit for me.

BATUSDBAT is rising above the critical point of 0.24450884 and touches the historical downtrend line above the 0.24858192 point and is now in position.
The inflection date for BAT is from around November 9 to around November 14.
If you stay above the downtrend line and keep the price above 0.24858192, you are likely to touch 0.30073596 again.
There are 200MA and 700MA in the middle, which are expected to limit the rise.
If the price falls, we expect to touch 500MA.
If the flow of BTC moves rapidly, it is expected to move along in that direction.
(An inflection day is a day when price changes are severe or the flow can reverse or rebound.)

BAT pump soonHistory doesn't always repeat itself, but it usually rhymes. Last time we had a run up after a downtrend, BAT formed a bull flag. Then, it had a massive 150% pump. We just had a run up after a downtrend, and now the bull flag is almost done forming. If it plays out similarly, we should be expecting a huge pump if we break out of the bull flag to the upside.

BAT pump soonMy first TA ever. Noticed the similarities between what is happening right now and a large historic pump. We had a solid run up leading into what looks like a bull flag. Extremely similar to the previous run up that led to a bull flag, which in turn led to a massive 150% pump.

BAT is at the bottom of its former channel Potential + 140% BAT is at the bottom of its former channel. The potential is up to the upper boundary of the horizontal channel + 140%. I have shown all the turning points and important support / resistance levels on the chart. The channel itself with a step of + 160% I’ve been trading it for more than a year.
Inside the channel, we see the formation of a “Cup with a handle” reversal pattern, which at the moment has become a reversal pattern after a downtrend. Now rollback after growth of + 111% which I predicted in past trading ideas for this coin in updates
Double bottom and entrance to the former accumulation channel.
And the result after 1 month
BAT There is a "Cup" Coin in the channel Option "Cup with handle
The result is two days later.
Impulse + 23%
A total profit of 111%.
All important areas if this pattern will work out I showed on the chart. The potential is from + 20% to + 111%. In more detail, I described everything on a large scale in this trading idea:
BAT Cup with handle Pivot points from +20 to 111% Channel bottom
A very important point (indicated in red) is the bottom of the horizontal channel. Breaking it and fixing under it will mean a bearish trend. _____________________________________________________________
Channel development potential + 140% The risk is minimal, as the price is almost at the bottom of the channel.
The potential for working out the “Cup with Handle” figure itself is from + 20% to + 111%, depending on which scenario we will go.
+ 20% -to the resistance of the cup, if we do not break through, then the figure is not confirmed.
+ 48% - still local high
+ 111% - full working out of the figure’s potential, as in the book.
Stop loss under the red zone. The lower boundary of the global horizontal channel. Or depending on the trading strategy that you use ______________________________________________________________
It does not matter if you are right or wrong. The only important thing is how much money you earn when you're right, and how much money you lose when you're wrong.
George Soros.

BAT Cup with handle Pivot points from +20 to 111% Channel bottom BAT Figure "Cup with handle." Now "handle" is being drawn. Pivot points on which the confirmation of the figure depends, I depicted on the chart. After this growth, the coin is now at the very bottom of the previous horizontal channel. Very important red zone. This is the lower boundary of the channel. The movement of the coin for several months depends on this zone. Either the coin will go on a bullish path and will be traded in a horizontal channel with a step of + 160% as before , or it will go on a bearish path. I adhere to the first option more.
The development potential of the “Cup with Handle” figure itself is from + 20% to + 111%.
+ 20% - until the resistance of the "cup", if we do not break through, then the formation is not confirmed.
+ 48% - previous local high
+ 111% - full development of the figure’s potential, as in a book.
Stop loss - under the red zone. The lower boundary of the global horizontal channel.
_____________________________________
The "Cup with handle" ("Mug") figure is a figure of the continuation of the trend. It is very reminiscent of the Saucer reversal pattern, but without the handle. One of the main features of this figure is that it is a continuation figure precisely on an uptrend. There is also a variant of this figure in mirror image on a downtrend: "Inverted cup with a handle."
The name of the figure was due to the external similarity with the shape of the cup.
The "Cup with handle" figure (Mug) consists of two parts:
1) Bowls.
2) handle.
____________________________________
The stages of the formation of the figure and the Take Profit
1) The very first condition for the formation of this figure model is an uptrend. How is it a pattern of continuing the uptrend. Ideally, the trend should be strong enough and long enough, but not too "old". Otherwise, the potential for further growth and confirmation of the figure is sharply reduced.
2) "Bowl" - should have a smooth concave bottom. In an ideal "Cup with a handle" ("Mug"), the maximums of the glass (edges on the sides) will be at the same level (general resistance), but this is not a requirement. But, the more "ideal" the form of the "Bowl", the stronger the signal. More rounded shape of the figure "guarantee" a fairly good consolidation and is a more reliable sign with strong levels of support and resistance.
3) After the formation of the "Bowl", the second obligatory component of the figure is formed - this is the "handle". After the maximum is formed on the right side of the "Cup", a small rollback occurs, which is formed to the right of it and which forms the "Handle". It may look different and take different shapes and shapes: flag, pennant, triangle ... Also, these shapes meet with the “Pen” without tilt, but with horizontal movement. Usually, the handle in height does not occupy more than 1/3 of the height of the glass.
It is believed that the smaller the “handle”, the stronger the breakthrough and further movement will be. The edges of the handle are approximately flush with the edges of the glass, which once again confirms the resistance of the figure. "handle" is the last step before the final formation of the figure and the subsequent breakthrough of resistance. The breakout level of the figure is located at the level of the edges of the "cup" or slightly lower if the "Handle" is tilted down (at the level of resistance of the "Handle").
4) The timeframe is of great importance. The longer the formation takes, the more reliable the signal is considered. The larger the time frame, the more reliable the signal.
5) As a rule, at the bottom of the "Cup" the volumes have a minimum value. Then, the volume indicators during the formation of the second part of the "Cup" should gradually increase. On the rollback, prices during the formation of the "Handle" should go down. At the breakout of the resistance of the "Handle" have a maximum value. When the resistance of the figure breaks through.
6) The goal of working out the figure is the distance between the minimum and maximum of the figure (resistance). Overlaid is the distance from the resistance breakout zone. But when setting goals, you need to consider global and local levels. They greatly depend on how the goals in the figure work out.


Alt Coins - Binance Margin Trading Pairs Live ~ IOST, VETGreat news! Our enTHUZed TradingView channel has been selected to take part in beta testing for the next video feature - live video streaming on TradingView. This feature will allow us to broadcast in real time and the audience will be able to engage live via chat. Think of it as Twitch for traders. I am told we will be one of the first channels going live next week!!
I focus on providing live education and support to those interested in trading, Cryptocurrencies, and Blockchain technology. You will learn charting techniques, technical analysis, and the most popular cryptocurrencies for trading. My content is ideally suited for beginner to intermediate level traders.

BAT There is a "Cup" Coin in the channel Option "Cup with handleAfter the breakdown of the horizontal channel, the figure "double bottom" appeared on the chart of the coin. This was in the previous trading idea for this coin in the update. Profit amounted to + 76%
The situation is now.
At the moment, we have the shape of a cup (saucer, rounded bottom) which, at the 4th stage (breaking through the resistance of the "bowl"), can go up to the indicated resistance. Another option - a downward channel can be drawn, which will act as the "Handle" of the "Cup with handle" figure . It is very important that if we follow the second scenario, the red zone is important, which will act as a support for the global channel. Roughly speaking, a successful retest of it will give a signal in growth over the entire width of the channel, and this is + 160%. But if support breaks through, then in the near future it will be better to forget about trading this coin. This is a very unlikely scenario. But this must always be remembered.
At the expense of the coin, the coin is very strong fundamentally , this is one of those coins that I constantly trade and increase my position. I’ve been trading for almost a year and a half BAT.
For example, this trading idea for trading BAT / BTC in a horizontal channel for November 2018.
I showed all three options on the chart. The most likely is the "Cup with handle."
______________________________________
A bit about the figures on the charts
Saucer shape (Bowl, Rounded bottom).
The Saucer shape, or as it is often called the Chalice, the Rounded bottom is a long-term figure that predicts long-term growth that looks like a concave arc. The figure is found on large timeframes. In most cases, on weeks, but on instruments that quickly go through their cycle (cryptocurrency), they can occur on a daily timeframe.
The rounded bottom is quite rare, but very reliable bullish pattern. Typically, a pattern is formed at the end of a long-term “bearish trend” and usually gives a signal of a market reversal.
It should be noted that the ideal symmetry of the figure is not a prerequisite. The main thing is the presence of its key components: the descent of the price, the bottom, the rise in price and the breaking of resistance.
Ideally, the formation of the “Saucer” pattern usually occurs in a narrow price range, in a calm market with the least volatility, when a trend reversal occurs smoothly, without strong price spikes. If, however, price spikes occur, then very soon the price will return to its usual range. The figure signals the long-term nature of the formation of a trend movement. The longer the figure forms in time, the stronger the signal is considered. The most reliable are the figures formed on weekly charts for at least several months. The older the time frame, the more reliable the signal. The rounded bottom is a long-term figure, and can stretch on the chart for a long period.
_________________________________________
Stages of the formation of the figure.
The Saucer figure consists of the following steps:
1) The descent of the price is the first phase of the figure. Price fall trend with a gradual slowdown. In the classical case, it should be a smooth arc, but in practice its shape can be flat or contain, on the contrary, correction minima and maxima. The main condition in this case is the gradually decelerating pace of price reduction.
2) The bottom is the lowest point of prices. It is the geometric center of the figure. It should be located on a gentle bottom (smooth bottom, without peaks). Although sometimes such a formation as the "Thorn" down or closed squeezes comes across at the bottom. The main thing is that these local formations do not violate the overall picture of the figure and movement in the global. If the lower point of the price forms the so-called platform on the chart, then the trading volumes gradually decrease, and at the moment of the price jump up sharply increase. Another surge in prices may be a signal to buy if the maximum of current prices is higher than the previous maximum.
3) Ascent of the price - after the minimum follows the ascent, which should ideally be symmetrical to the descent, and should last as long as the first phase (the descent of the price). There is a tendency to increase prices with a gradual acceleration.
4) The intersection of the resistance formed by the upper boundary of the whole figure (passes through the maximum point of the figure at the beginning of the period of its formation) is an additional confirmation of the rounded bottom and the final phase of the formation of the figure. After breaking through and fixing the price, the resistance level turns into a support level. When crossing the resistance, the volume rises as a rule.
______________________________________
The figure "Cup with handle" (Mug).
The "Cup with handle" ("Mug") figure is a figure of the continuation of the trend. It is very reminiscent of the Saucer reversal pattern, but without the handle. One of the main features of this figure is that it is a continuation figure precisely on an uptrend.
The figure got its interesting name because of the external similarity with the shape of the cup.
The "Cup with handle" figure (Mug) consists of two parts:
1) Bowls.
2) Pens.
This pattern appears on an uptrend. A pattern begins to form when a bottom forms in a concave arc on an uptrend. This is the first part of the figure - "Bowl". Upon completion, another bottom is formed, much smaller than the first. The edges of the "Bowl" and "Handle" are at approximately the same level (form resistance). Upon completion of the formation of the "Handle", the price breaks the resistance line from the bottom up and the figure is successfully confirmed.
________________________________________
Shape shaping and volume change.
As a rule, the volume at the bottom of the "Cup" has a minimum value. "Cups" should gradually increase. The prices of pens should be reduced during formation. On the breakthrough of resistance, “Pens” are of high importance. When the resistance of the figure breaks through.
_________________________________________
You need not only to know the rules of technical analysis, but also to understand what and how and why it works.
All successful bidding.

BATUSDBAT is a bit higher while other coins are falling, and then it is lowered by this drop of BTC.
BAT is expected to touch the 0.37662744 point if it rises above the "symmetrical trendline of the actual downtrend line" and maintains price above 0.24450884.
However, as the trend of the BTC is falling, it is better to watch the situation.


BATUSDIf you buy BAT slowly between 0.15494740 and 0.19916, you will have good results next year.
If you climb above 0.376627435 in the upcoming bull market, you may want to wait until you come below 0.15494740.
