₿ BATUSDT 1D ₿ : 31.Oct.2021 (+106%) 🚀As you can see, since the introduction of this CryptoCurrency, its price has grown by more than 106% ... It is now moving towards the previous ATH. If a new ATH is registered , the analysis will be updated ...
Follow our other analysis & Feel free to ask any questions you have, we are here to help.
⚠️ This Analysis will be updated ...
👤 Arman Shaban : @Ar_M_An_4
📅 31.Oct.2021
⚠️(DYOR)
Batusd

BATUSD BATUSDC BAT Bullish Target $1.00-$1.25 SOON!Quick Vid Summary:
BLUF = Target of $1.00-$1.25 soon
How I will be playing this trade
Where we go from here and how that may look

BAT BRAVE Now Headed to Earlier Target Predicted. 1.25+ IncomingCongrats traders who are in this play!
As predicted:
BAT has broken out of the bullish triangle to the upside
BAT has come back to kiss the top of the triangle "goodbye"
BAT is currently engaged in a vertical move upwards
BAT is on it's way to earlier targets predicted (see Link to Related Ideas below)
BAT should hit $1.00 to $1.25 and more soon!
How to continue to play this trade?

BATUSDT - 55% up in 3 daysBAT/USDT
Vertical candles on this one, 55% up in 3 days, broke out of major downtrend resistance and now through major resistance.

All set to double? BAT will be used in BRAVE search engine, which is web3 based engine. It is the most popular of all the tokens.
Huge volume day, buy any pull backs from here. It can hit $1.50++

BAT - Trying to breakoutBAT/USDT
1D/4H
Learnt an important lesson here in understanding of liquidity and market manipulation.
My initial analysis of BAT correctly predicted the next move into the target area of resistance. This was a great call for a spot buy around the price level $0.67, it has a long way to go and is a great fundamentally strong coin. The volume on this daily candle shows the largest since march near the top. The long idea posted was stopped out for break even after initially heading towards the target before being triggered after the correction we had caused a lot of volatility.
Looking at the analysis now, price corrected into the golden fib and 4H horizontal demand zone, formed a series of bullish triangles to induce buyers into the market and position themselves long from this area, a false breakout then occurred before the sharp move down liquidating longs and heading into the 4H demand from the origin of the breakout as shown on the chart. This collected any unmitigated orders in the zone before creating an imbalance and causing an explosive move to the upside.
Using the fixed volume profile we can see areas of volume from the high volume nodes across an area of price action, using supply and demand we can identify the candle where the order block of unmitigated orders is located and back check it against the volume profile.
We rejected off the resistance level and major downtrend resistance, watching for a breakout of major downtrend resistance and hoping to add some of this to my portfolio on the corrective wave and retest.

₿ BATUSDT 1D ₿ : 29.Oct.2021 (Update)RESULTS so far : +32% 😍✅🟢
Follow our other analysis & Feel free to ask any questions you have, we are here to help.
⚠️ This Analysis will be updated ...
👤 Arman Shaban : @Ar_M_An_4
📅 29.Oct.2021
⚠️(DYOR)

BAT/USD - Major break on volume. BAT aiming for $1! 🥰Major volume and pump today. We broke below and now above the blue pennant... BULLISH.
BAT on a course to reach $1. Indicators turned bullish as well, looking good to me.
Wait for a pullback to consider an entry as we've pump a lot in one day. Some pull back could take place to have a better entry.
Like and follow if you liked my idea!

₿ BATUSDT 1D ₿ : 26.Oct.2021This analysis is a check of the chart in a Daily time frame and everything is clear on the chart and does not need additional explanation ... However, if you have any questions, feel free to ask .
⚠️ This Analysis will be updated ...
👤 Arman Shaban : @Ar_M_An_4
📅 26.Oct.2021
⚠️(DYOR)

₿ BATUSDT 1D ₿ : 24.Oct.2021This analysis is a check of the chart in a Daily time frame and everything is clear on the chart and does not need additional explanation ... However, if you have any questions, feel free to ask . My personal opinion : Personal review to buy (Buy Recommendation)
⚠️ This Analysis will be updated ...
👤 Arman Shaban : @Ar_M_An_4
📅 24.Oct.2021
⚠️(DYOR)

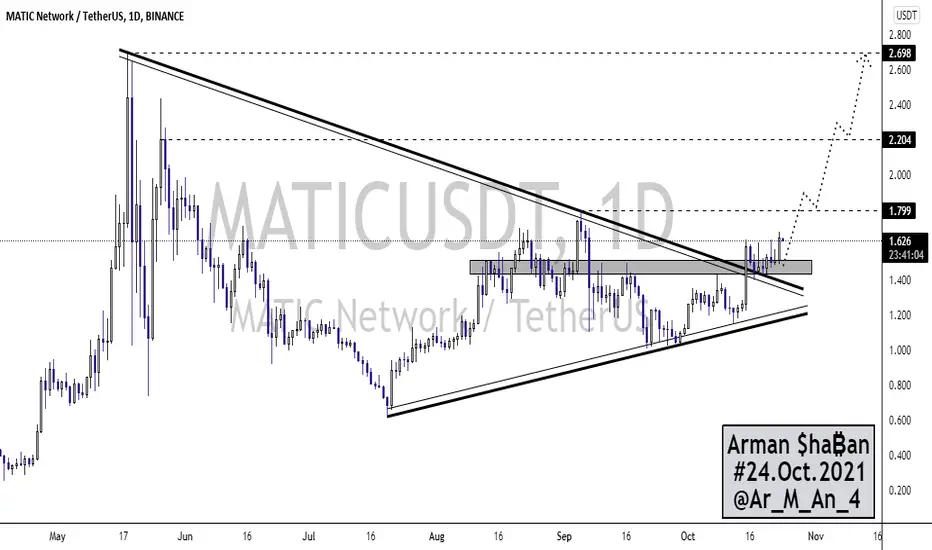
₿ MATICUSDT 1D ₿ : 24.Oct.2021This analysis is a check of the chart in a Daily time frame and everything is clear on the chart and does not need additional explanation ... However, if you have any questions, feel free to ask . My personal opinion : Personal review to buy (Buy Recommendation)
⚠️ This Analysis will be updated ...
👤 Arman Shaban : @Ar_M_An_4
📅 24.Oct.2021
⚠️(DYOR)
BAT moving north soon?BAT has been working its way through a triangle on the 1-day chart, bouncing below and above the 200 and 55 EMA (purple & yellow) in the process. Currently, the price sits as a green candle right below the purple 200 EMA. The "1 day, 200 EMA strategy" says that you take a position when the price action goes north of the 200 EMA and exit a position when the price action dips back and breaks through to the 55 or 200 EMA as support.
Understanding this, if BAT breaks north through the 200 EMA (resistance) it could begin opening and closing candles north of the 200 EMA. The strategy says that this is where you consider a position and watch for a run north, monitoring the 55 and 200 EMA as it runs.
Right now BAT is hovering below the purple 200 EMA. Until it breaks through it and holds it as support I remain neutral.
The RSI looks to be in an uptrend as well. The RSI uptrend level of support is shown with the white trend line.
Not financial advice obviously, simply for educational purposes. Make your own trades, that is what it is all about.
Peace friends!

BAT - UpdateBAT Update
1D/4H Charts
Update on BAT from my analysis/trade post made on 16th October.
Following the analysis nicely having collected liquidity from the 4H demand zone after correcting into the golden fib for extra confluence, its broke out of the falling wedge with high volume and retesting the outer structure creating a BOS and new high.
The continuation looks great here like with other alts. MADC showing bullish momentum and should continue over the coming days.
Currently running 2R and could take profits and become risk free leaving the rest to run dependant on strategy.

BAT/USDT - Another alt ready to continue?BAT/USDT
1D/4H Charts
Looking similar to other ALT setups across the market, bullish.
After the may crash buyers accumulated BAT in the daily demand, showing long rejection wicks with high volume signalling buyer intension. It formed a falling wedge breakout creating a new uptrend and respecting the existing major trend.
This created a new higher high and higher low. However we are still under resistance having rejected from it creating another smaller bullish falling wedge with a breakout with higher volume on the upwards move and less on the correction showing harmony in the move up. The correction pulled into the golden fib and created multiple bullish pin bar closes on the daily chart giving confluence of a continuation in line with the trend.
The 4H showing yet another smaller contracting triangle into the golden fib and 4H demand zone with rejections and high volume signalling buyer presence. MACD showing momentum increasing heading to towards the centreline for a bullish crossover signal just adds slight more confluence to the already bullish setup here.
Id expect to see price head towards the resistance level and into daily supply above. Fib projection shown and would expect to see price take out the high and head towards the 1.272 fib if momentum continues.

BAT - is going to breakout this key level 😲🚀BAT is near its key level. In addition, we see compression and approaching the level by small bars, which is a good signal for a breakout and continuation of growth. A good buying opportunity would be after a breakout or a retest of the key level as support.
Write in the comments all your questions and instruments analysis of which you want to see.
Friends, push the like button, write a comment, and share with your mates - that would be the best THANK YOU.
P.S. I personally will open entry if the price will show it according to my strategy.
Always make your analysis before a trade.

₿ BATUSDT 1D ₿ : 08.Oct.2021 (Update)Everything is clear ( Just F*** Buy it) on the chart and the possible scenario is marked on the chart ... If you have any other questions, leave us a comment.
⚠️ This Analysis will be updated ... BINANCE:BATUSDT
👤 Arman Shaban : @Ar_M_An_4
📅 08.Oct.2021
⚠️(DYOR)

MY MINIMALIST CHART ANALYSIS FOR $BAT9.6.21
My Minimalist Analysis of $BATUSD
Indicated are key levels of support and resistance using small and large range boxes TO ENTER A SWING TRADE (Short - Long).
Watch out for patterns, EMA, and your Fibs.
Further Analysis on price action is required on a 1HR-4HR chart when entering or closing a trade, depending on your risk appetite and trading style.
Disclaimer: The findings/predictions of the following analysis are the sole opinions of the publisher of this idea and must not be taken as investment advice.
If you like my published ideas and for more daily analysis, you can support my work by pressing the like and follow buttons on Trading View and Etoro Platforms.
Thank You for your appreciation and support.

BATUSD 9/20/2021im leaning on the green but who knows lets see how this plays out
the chart obviously shows where resistance and support is in the chart by the fib channel and trend lines ect.

BAT UNDERVALUED Cryptocurrency!Successfully re-tested the old resistance
It is now preparing the final impulse wave will will bring new All-time-highs
I hope you found the idea interesting:)

BATUSDT Macro swing to new all time highBATUSDT MACRO SETUP
NEXT consolidation 4-7, which is 1:1 extension of the previous move.
Extension 1.41 will be at $12
Extension 1.618 will be at $20
Therefore $12-15 could be a good range for bulls to derisk.
Breakout below macro support 0.5-0.40, could lead to a bear market continuation to retest the bottom

The $BAT Man Gaining Strength To Rise Again On CryptocityHere is my idea , first of all the the major element is $BAT breaks its daily fibo retracement 0.382 and supported some how at this level, not only it was the top trend on social medias yesterday, in otherhand it gains the enough momentum to break the RSI Daily downtrend in a blink ! ;)
In 4H timeframe , BAT actually printed the cup pattern and it has a lotf of profit to come az its try to take back its previous target on 1.6920 and we had little divergence between MACD Signal Line and Price changes some how we have golden cross also is 2H timeframe...
So I guess This is what you should keep eyes on it !
Trade Safe , Cheers !

MY MINIMALIST CHART ANALYSIS FOR $BAT 9.2.21 My Minimalist Analysis $BAT
Short to Mid-term Swing Trade
NOTE: This is not a piece of financial advice. Further Analysis on price action is required depending on your risk appetite and trading style.

#BAT Signal 😂🦇 : Let's buy Some 😂🦇Let's buy Some #BATUSDT ( BAT ) , Shall We ?? Amazing Chart , Isnt it ??
In order to buy, the SL (stop loss) and capital management must be observed.
All resistances and TPs (take profits) are marked on the chart.
(DYOR)
