BAT Analysis (4H)From the point we marked as the start, BAT appears to have entered a bullish diametric pattern.
It now seems to be in wave F, which is a bearish wave.
We have identified two entry points for BAT, where positions can be opened using a DCA approach.
The targets have been marked on the chart.
A daily candle close below the invalidation level will invalidate this analysis.
For risk management, please don't forget stop loss and capital management
When we reach the first target, save some profit and then change the stop to entry
Comment if you have any questions
Thank You
Batusdt

BAT Analysis (1D)The structure of BAT is bullish, but we should not forget that it is approaching a key level.
BAT is getting close to a strong liquidity pool.
If price reaches the LP zone, we will look for sell / short positions toward the marked targets.
A daily candle close above the invalidation level will invalidate this analysis.
Do not enter the position without capital management and stop setting
Comment if you have any questions
thank you

$BAT 1WThe BITMEX:BAT in the weekly timeframe is in a downtrend and is trading within a descending channel.
The price is forming lower highs and lower lows.
The channel's midline is a critical and important level, which could create a bullish bounce.
However, if it breaks below this level, a price drop to the channel's bottom is anticipated.

See if it can rally after holding support at 0.2558-0.2672
Hello, fellow traders!
Follow us to get the latest updates quickly.
Have a great day!
-------------------------------------
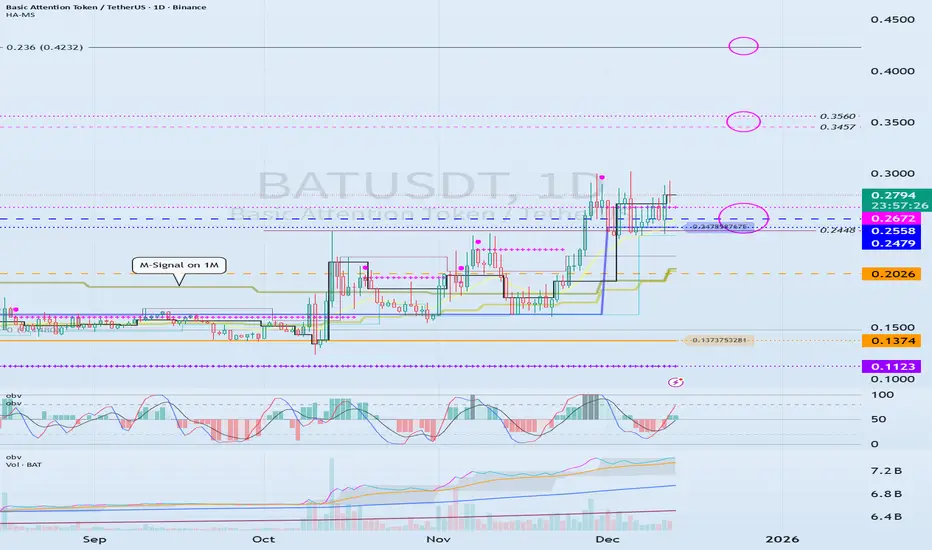
(BATUSDT 1M Chart)
After a significant decline, the price is forming a close above the M-Signal indicator on the 1M chart.
Accordingly, if the price remains above the M-Signal indicator on the 1M chart, the long-term uptrend is expected to continue.
Since the StochRSI 80 indicator is forming at 0.2448, we should examine whether it finds support near this level and can rise.
A full-scale uptrend is likely to begin when it rises above the Fibonacci level of 0.236 (0.4232).
If a full-scale uptrend begins, the target point is around 0.8357.
-
(1D chart)
Therefore, the key question is whether it can find support near the 0.2479-0.2672 range and rise above 0.3457-0.3560.
If it declines, we should examine whether support is found near the M-Signal indicator on the 1M chart.
Therefore, support around 0.2026 is crucial.
-
Thank you for reading to the end.
I wish you successful trading.
--------------------------------------------------
BAT is getting close to the buyers' zone (3D)After multiple drops, it seems that BAT is getting close to a strong support level. In this zone, it is possible to buy gradually in spot.
The targets are indicated on the chart.
The closure of a daily candle below the invalidation level will invalidate this analysis.
Do not enter the position without capital management and stop setting
Comment if you have any questions
thank you

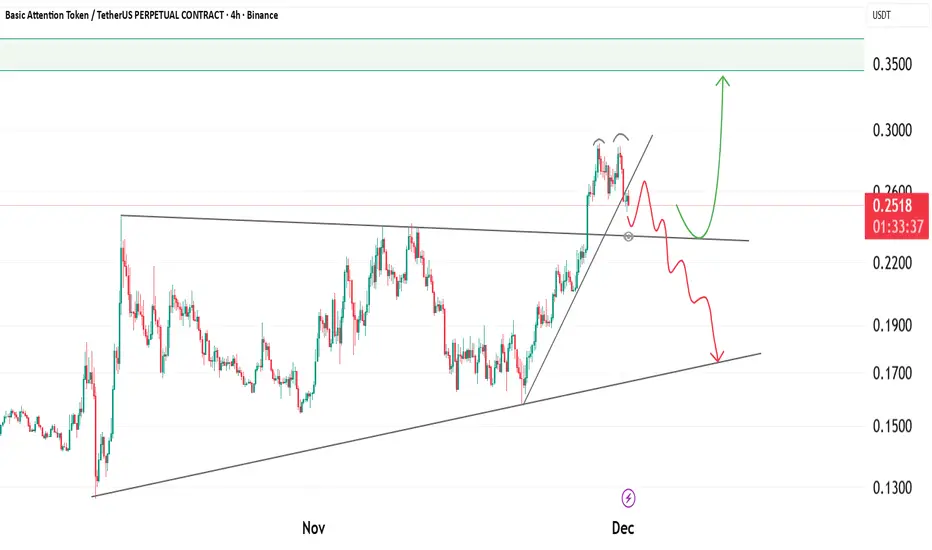
BAT – Decision Point Ahead as Structure TightensBAT is approaching a critical decision zone as price moves within a tightening structure. After a strong impulsive leg upward, the market is now forming a potential topping pattern while sitting directly on the trendline support.
The current behaviour shows two possible scenarios depending on how price reacts around this region. The market has respected this ascending support multiple times, making it an important level to watch closely.
Key Observations:
• The recent high has created a potential double-top structure, signalling exhaustion.
• Price is currently testing the trendline, which defines the short-term bias.
• A clean reclaim above the nearest resistance can re-ignite bullish momentum.
• A breakdown from the trendline would confirm deeper corrective movement.
Bullish Scenario:
If price holds the ascending trendline and pushes back above the recent breakdown zone, the next wave upward may begin. Momentum would favour a move into the next high-liquidity region.
Bearish Scenario:
A confirmed break below the trendline would open the path toward lower support levels. This scenario implies that the current rally was an overextension and needs deeper correction before any continuation.
In simple terms:
BAT is at a major support level.
Hold the trendline and it can send another bullish wave.
Lose the trendline and a deeper pullback becomes likely.
BATUSDT Forming Bullish MomentumBATUSDT is forming a clear bullish momentum pattern, a classic bullish reversal signal that often indicates an upcoming breakout. The price has been consolidating within a narrowing range, suggesting that selling pressure is weakening while buyers are beginning to regain control. With consistent volume confirming accumulation at lower levels, the setup hints at a potential bullish breakout soon. The projected move could lead to an impressive gain of around 90% to 100% once the price breaks above the wedge resistance.
This falling wedge pattern is typically seen at the end of downtrends or corrective phases, and it represents a potential shift in market sentiment from bearish to bullish. Traders closely watching BATUSDT are noting the strengthening momentum as it nears a breakout zone. The good trading volume adds confidence to this pattern, showing that market participants are positioning early in anticipation of a reversal.
Investors’ growing interest in BATUSDT reflects rising confidence in the project’s long-term fundamentals and current technical strength. If the breakout confirms with sustained volume, this could mark the start of a fresh bullish leg. Traders might find this a valuable setup for medium-term gains, especially as the wedge pattern completes and buying momentum accelerates.
✅ Show your support by hitting the like button and
✅ Leaving a comment below! (What is your opinion about this Coin?)
Your feedback and engagement keep me inspired to share more insightful market analysis with you!
BATUSD - Accumulation Phase EndsHello,
Brave Browser reached 100M users, in 2020 had less than 20M.
BAT is listed on Grayscale.
Funds as B2C2 started buying sprees in the last few days.
FalconX deposits grew in the last 7 days.
This is not a trading advice.
Thanks
Gex

BATUSDT UPDATE#BAT
UPDATE
BAT Technical Setup
Pattern: Falling Wedge Pattern
Current Price: $0.1908
Target Price: $0.2690 – $0.2720
Target % Gain: 40.95%
Technical Analysis: BAT has broken out of a falling wedge pattern on the 4H chart, showing bullish momentum. Price has pushed above the descending resistance trendline, confirming the breakout. A steady increase in buying pressure supports the move, and the target zone aligns with the previous supply area where price last rejected. This setup remains valid as long as BAT holds above the breakout level.
Time Frame: 4H
Risk Management Tip: Always use proper risk management.

#BAT/USDT#BAT
The price is moving in a descending channel on the 4-hour frame and is sticking to it very well and is expected to break it upwards
We have a bounce from a major support area in green at 0.1550
We have a downtrend on the RSI indicator that was broken upwards which supports the rise
We have a trend to stabilize above the 100 moving average which supports the rise
Entry price 0.1700
First target 0.1920
Second target 0.2033
Third target 0.2152

Scalp Long – BAT💎 Scalp Long – BAT
Buying pressure is strengthening, and price is preparing to break out of the short-term downtrend to retest the previous local high.
RSI has already broken its prior bearish structure, confirming bullish momentum.
🎯 Plan:
→ Enter after breakout confirmation and retest.
→ TP: 0.1806 | SL: 0.1632 | RR: 1 : 2.78
Momentum favors the long side.
Keep entries clean, trail SL as price advances.
Stay patient — only engage when the setup fully confirms.

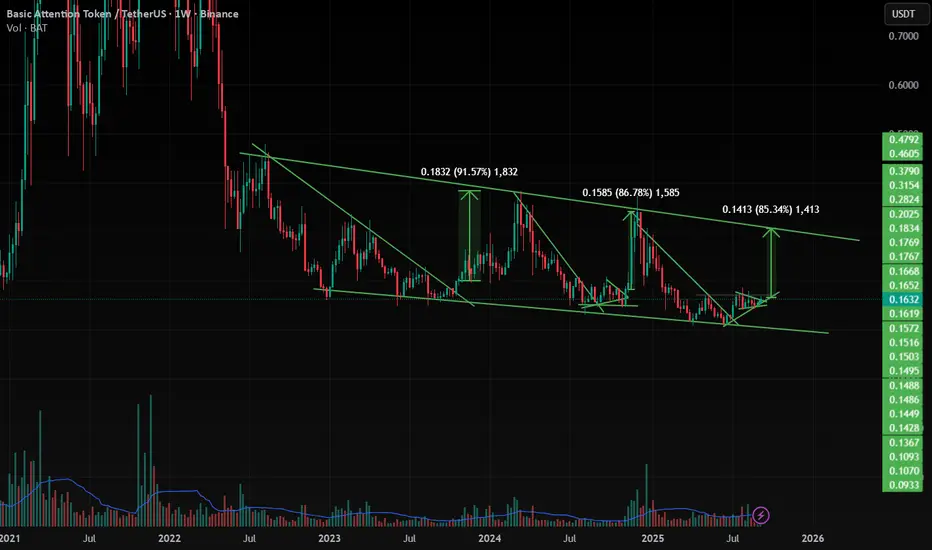
BAT/USDT , 1W BAT has moving same as previous moves , so it will give nearly 85 % UP move very strong if it breaks the upper trendline in Weekly and strong candle close .
Main important points are
1. BTC Dominance is falling Daily
2. ETH Dominance is increasing
3. Altcoins Dominance is Increasing
Means Volume is moving from BTC too Altcoins Slowly , soo Altcoins season is coming soo , look on Breakouts in altcoins , they will perform vey well .
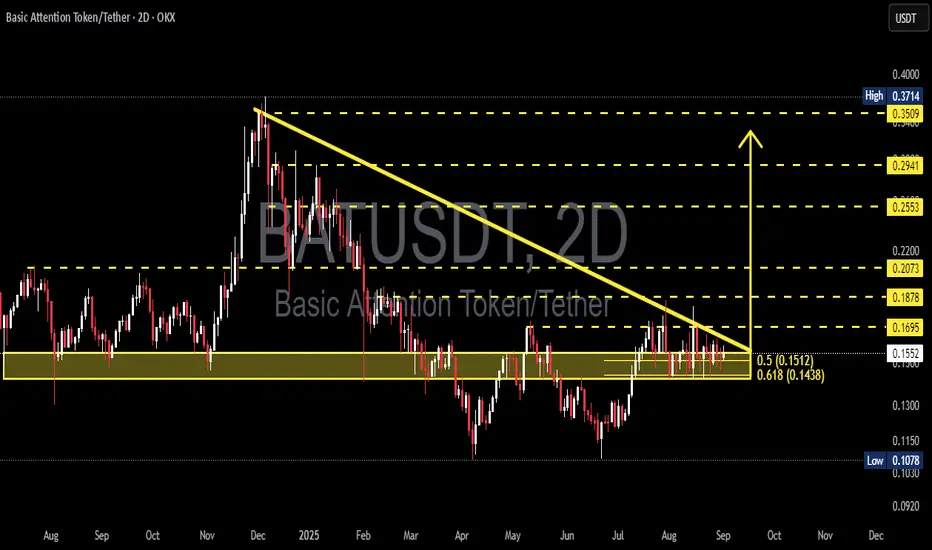
BAT/USDT — Critical Zone: Breakout or Breakdown Ahead?Summary:
BAT is currently consolidating at a critical support zone after a prolonged downtrend. Price action is being squeezed between a descending trendline from late 2024 highs and a strong horizontal support area at 0.1438–0.1512 (Fibonacci 0.618 & 0.5). This structure has formed a descending triangle / falling wedge on the 2D timeframe. The market is waiting for a decisive move: will bulls manage a breakout reversal, or will bears push for a breakdown continuation?
---
🔎 Chart Breakdown
1. Strong Support Zone
0.1512 (Fib 0.5) and 0.1438 (Fib 0.618) have repeatedly acted as a demand area.
Price is consolidating inside this yellow box region.
2. Descending Trendline
Connecting lower highs since December 2024.
Price is now at the apex, nearing a decisive breakout or breakdown.
3. Key Resistances to the Upside
0.1695 → 0.1878 → 0.2073 → 0.2553 → 0.2941 → 0.3509 (with 0.3714 high as the major resistance).
4. Supports Below
First target at 0.115.
Deeper support at 0.1078 (previous structural low).
---
📈 Bullish Scenario
Trigger:
A confirmed 2D candle close above the descending trendline and 0.1695, supported by strong breakout volume.
Validation:
Retest of the broken trendline as new support.
Targets:
TP1: 0.1878
TP2: 0.2073
TP3: 0.2553
Extended: 0.2941 → 0.3509
Stop-loss:
Conservative: below 0.1435.
Aggressive: below 0.151.
Bullish Conclusion:
If price breaks upward, this pattern may act as a falling wedge reversal, opening room for a significant rally after a long accumulation.
---
📉 Bearish Scenario
Trigger:
A 2D candle close below 0.1438, ideally with high selling volume.
Validation:
Failed retest of the support area, confirming it as resistance.
Targets:
TP1: 0.115
TP2: 0.1078 (previous macro low).
Stop-loss:
Above the descending trendline or between 0.155–0.17, depending on entry.
Bearish Conclusion:
If support breaks, the descending triangle will confirm as a bearish continuation pattern, exposing lower liquidity zones and potentially retesting macro lows.
---
📌 Pattern Insight
Descending Triangle: typically a bearish continuation signal.
Falling Wedge: often a bullish reversal pattern.
Current structure could validate either direction → confirmation is key.
---
📝 Trading Strategy & Risk Management
Risk per trade: 1–2% of capital maximum.
Watch for false breakouts (long wicks without strong volume).
Always check BTC market trend, as altcoins usually follow Bitcoin’s direction.
Confirmation tools: RSI above 50 & bullish MACD cross for upside, or opposite for downside.
---
📢 Final Notes
BAT is at a make-or-break level. The next 2D candle close, combined with volume confirmation, will likely decide the next major move. Traders should remain patient and avoid premature entries until the direction is clear.
#BAT #BATUSDT #Crypto #TechnicalAnalysis #Breakout #Bearish #Bullish #Altcoins #PriceAction
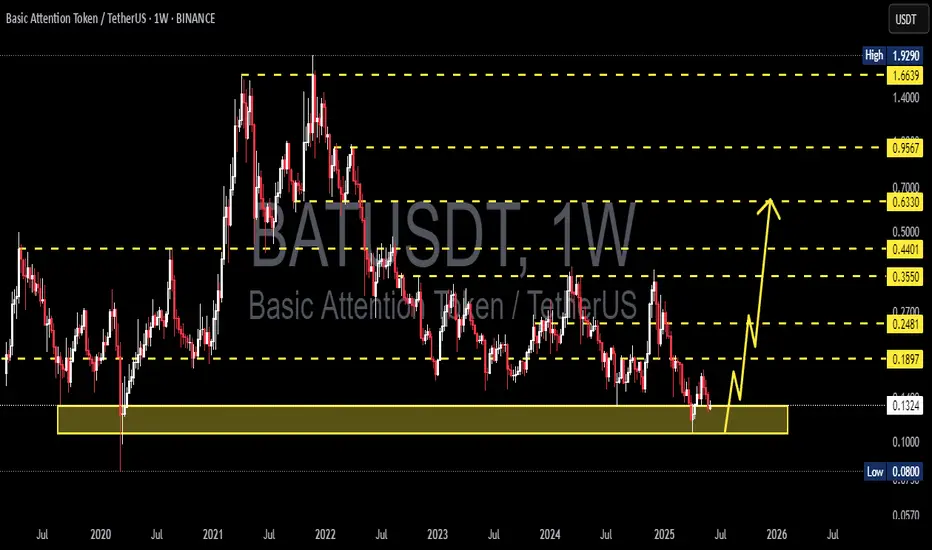
BAT/USDT Golden Zone: Massive Rebound Potential from Historical 🔶 1. Strong Support Zone (Highlighted in Yellow):
A key demand zone lies between $0.080 – $0.1212.
This area has acted as strong support multiple times since 2020, showing signs of institutional accumulation or whale interest.
🔼 2. Bullish Reversal Scenario:
A recent bounce from this golden support zone suggests a potential bullish reversal.
The projected path (yellow arrows) illustrates a step-by-step rally toward multiple resistance levels.
Potential Upside Targets:
🔹 $0.1648 (Initial minor resistance)
🔹 $0.2098 (Previous consolidation zone)
🔹 $0.3551 (2023 distribution zone)
🔹 $0.4368 (Major pre-breakdown resistance)
🔹 $0.6275 (Medium-term bullish target)
🔹 $0.9412 – $1.6487 (Long-term resistance levels)
📉 3. Risk Management & Invalidations:
A weekly close below $0.1212 may trigger a move toward the $0.090 – $0.080 historical low zone.
A breakdown below that would invalidate the bullish outlook and call for a reassessment.
📆 4. Timeframe & Additional Signals:
This is a weekly timeframe chart, ideal for swing or long-term traders.
While volume confirmation is not yet strong, the early formation of a higher-low suggests a possible trend reversal.
✅ Conclusion:
BAT/USDT is currently trading in a high-probability reversal zone with strong historical support. If this zone holds, it could trigger a significant multi-level bullish rally. A good opportunity for patient traders with proper risk management.

BATUSDT 1W AnalysisBAT ~ 1W Analysis
#BAT This trade is very high risk
This is the lowest support block for now. Buy with a short term target of at least 20%+ from here.
BATUSDT 1D Analysis BAT ~ 1D Analysis
#BAT Buy gradually from here if you still have confidence in this coin with a short term target of at least 15%+ from here.

BATUSDT 1D AnalysisBAT ~ 1D Analysis
#BAT Buy when re -testing this support block with a short -term target of at least 10%+ from here.

BAT ANALYSIS🚀#BAT Analysis :
🔮As we can see in the chart of #BAT that there is a formation of "Falling Wedge Pattern". In a daily timeframe #BAT broke out the pattern. Expecting a bullish move in few days if #BAT retest the levels
⚡️What to do ?
👀Keep an eye on #BAT price action. We can trade according to the chart and make some profits⚡️⚡️
#BAT #Cryptocurrency #TechnicalAnalysis #DYOR

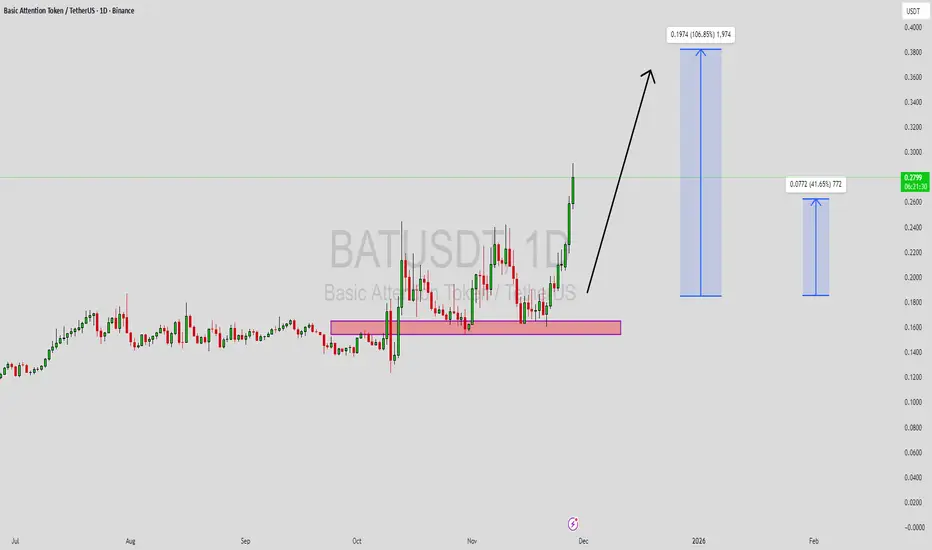
Basic Attention Token, An Old FriendLet's take the market bottom as the low that was set in June 2023, what do you see?
One single signal can reveal the bottom is that true?
One single signal can tell you everything that is going on with a chart, or not.
It is more about your experience, what you know about the market and the market cycle.
The main bottom for the 2022 bear market for Basic Attention Token (BATUSDT) happened in December 2022, after it goes sideways but, let's take June 2023 as the market bottom for the purpose of this chart.
#1 on the chart is a stop-loss hunt event. It leads to a bullish wave.
#2 on the chart is the same; a reversal comes next.
The bullish signal is in because #2 is already gone. The action went below long-term support (June 2023 low) is now trading back above it. Three weeks green, bull confirmed; yes we win! Yes, I win!
So this is easy don't you agree?
What's the potential for growth?
An easy target will give us some 350%. A strong target will give us 795%. Strong is not the best. We can end up with better target specially if we consider how the market in the past behaved.
Are you with me?
What do you see?
Do you agree?
The comments are the feedback, interact with me; what do you see?
Do you agree that this chart is green and set to grow?
If you agree boost, if you disagree boost and follow.
Thanks a lot for your support.
A strong rise can take more than a year to develop. With a low in August 2024, a high can happen in August 2025. Sounds early, looks early, feels early but can happen.
Taking the lowest point since the March 2020 bottom, April 2025, an entire year of bullish action would put an All-Time High in April 2026. This sounds good but, can it be true?
Too good to be true or too hard to believe?
If the bull market can be late to start, it can also end late.
Let's hope the bullish action goes beyond 2025 into mid-2026, that would be the best. The longer it takes, more time to adapt, plan and to secure wins and profits.
Thanks you for reading.
Namaste.

BATUSDT 1WBAT ~ 1W Analysis
#BAT Buy gradually from here with a short -term target of at least 20%+. This is the lowest support block for now.

BATUSD - Bullish Phase StartsHello,
Altcoin season starts,
BAT is already listed on Grayscale, it can be compliant for an ETF also.
Good Fundamentals,
Thanks,
St Gex

BAT ANALYSIS🔮#BAT Analysis :
📈📈 #BAT is making perfect Double Bottom Pattern. We can see a good pump if #BAT breakout the major resistance zone with good volume and sustains the higher price after breakout 🚀🚀
📊 Current Price: $0.1675
⏳ Target Price: $0.1800
⁉️ What to do?
- We can trade according to the chart and make some profits in #BAT. Keep your eyes on the chart, observe trading volume and stay accustom to market moves.💲💲
#BAT #Cryptocurrency #Pump #DYOR #Breakout

BAT Repeating Patterns Before a Potential 900% SurgeBINANCE:BATUSDT retesting the neckline of head & shoulder top, it surged 900% last time after retesting, potential buy point now?
🔴 Read my signature & publications for more info you don’t want to miss.
🔥 for more future "guesses" like this!
