BAT/USDT — Critical Zone: Breakout or Breakdown Ahead?Summary:
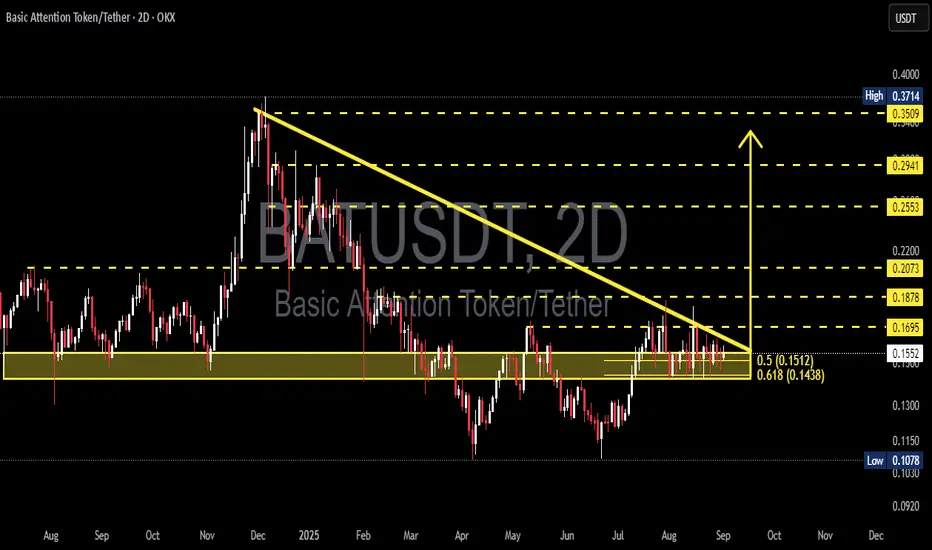
BAT is currently consolidating at a critical support zone after a prolonged downtrend. Price action is being squeezed between a descending trendline from late 2024 highs and a strong horizontal support area at 0.1438–0.1512 (Fibonacci 0.618 & 0.5). This structure has formed a descending triangle / falling wedge on the 2D timeframe. The market is waiting for a decisive move: will bulls manage a breakout reversal, or will bears push for a breakdown continuation?
---
🔎 Chart Breakdown
1. Strong Support Zone
0.1512 (Fib 0.5) and 0.1438 (Fib 0.618) have repeatedly acted as a demand area.
Price is consolidating inside this yellow box region.
2. Descending Trendline
Connecting lower highs since December 2024.
Price is now at the apex, nearing a decisive breakout or breakdown.
3. Key Resistances to the Upside
0.1695 → 0.1878 → 0.2073 → 0.2553 → 0.2941 → 0.3509 (with 0.3714 high as the major resistance).
4. Supports Below
First target at 0.115.
Deeper support at 0.1078 (previous structural low).
---
📈 Bullish Scenario
Trigger:
A confirmed 2D candle close above the descending trendline and 0.1695, supported by strong breakout volume.
Validation:
Retest of the broken trendline as new support.
Targets:
TP1: 0.1878
TP2: 0.2073
TP3: 0.2553
Extended: 0.2941 → 0.3509
Stop-loss:
Conservative: below 0.1435.
Aggressive: below 0.151.
Bullish Conclusion:
If price breaks upward, this pattern may act as a falling wedge reversal, opening room for a significant rally after a long accumulation.
---
📉 Bearish Scenario
Trigger:
A 2D candle close below 0.1438, ideally with high selling volume.
Validation:
Failed retest of the support area, confirming it as resistance.
Targets:
TP1: 0.115
TP2: 0.1078 (previous macro low).
Stop-loss:
Above the descending trendline or between 0.155–0.17, depending on entry.
Bearish Conclusion:
If support breaks, the descending triangle will confirm as a bearish continuation pattern, exposing lower liquidity zones and potentially retesting macro lows.
---
📌 Pattern Insight
Descending Triangle: typically a bearish continuation signal.
Falling Wedge: often a bullish reversal pattern.
Current structure could validate either direction → confirmation is key.
---
📝 Trading Strategy & Risk Management
Risk per trade: 1–2% of capital maximum.
Watch for false breakouts (long wicks without strong volume).
Always check BTC market trend, as altcoins usually follow Bitcoin’s direction.
Confirmation tools: RSI above 50 & bullish MACD cross for upside, or opposite for downside.
---
📢 Final Notes
BAT is at a make-or-break level. The next 2D candle close, combined with volume confirmation, will likely decide the next major move. Traders should remain patient and avoid premature entries until the direction is clear.
#BAT #BATUSDT #Crypto #TechnicalAnalysis #Breakout #Bearish #Bullish #Altcoins #PriceAction
Batusdtanalysis
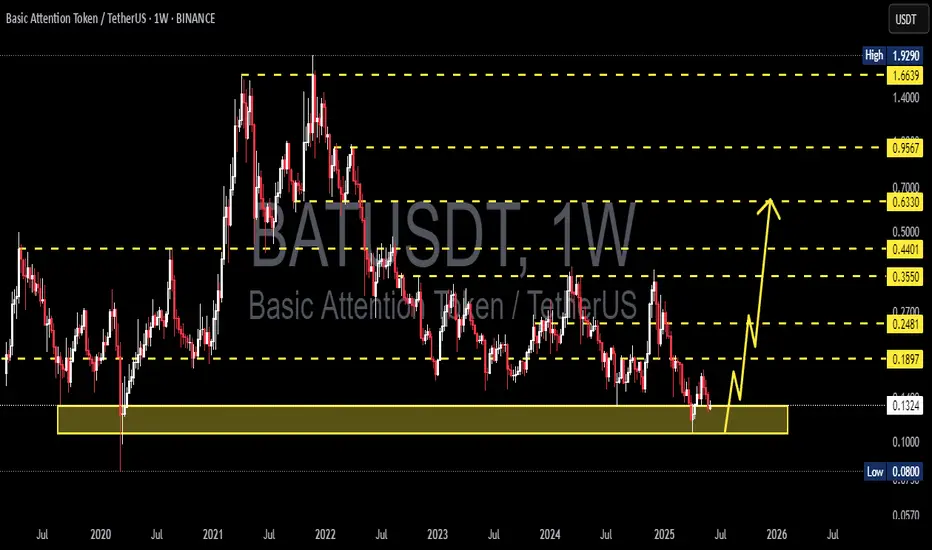
BAT/USDT Golden Zone: Massive Rebound Potential from Historical 🔶 1. Strong Support Zone (Highlighted in Yellow):
A key demand zone lies between $0.080 – $0.1212.
This area has acted as strong support multiple times since 2020, showing signs of institutional accumulation or whale interest.
🔼 2. Bullish Reversal Scenario:
A recent bounce from this golden support zone suggests a potential bullish reversal.
The projected path (yellow arrows) illustrates a step-by-step rally toward multiple resistance levels.
Potential Upside Targets:
🔹 $0.1648 (Initial minor resistance)
🔹 $0.2098 (Previous consolidation zone)
🔹 $0.3551 (2023 distribution zone)
🔹 $0.4368 (Major pre-breakdown resistance)
🔹 $0.6275 (Medium-term bullish target)
🔹 $0.9412 – $1.6487 (Long-term resistance levels)
📉 3. Risk Management & Invalidations:
A weekly close below $0.1212 may trigger a move toward the $0.090 – $0.080 historical low zone.
A breakdown below that would invalidate the bullish outlook and call for a reassessment.
📆 4. Timeframe & Additional Signals:
This is a weekly timeframe chart, ideal for swing or long-term traders.
While volume confirmation is not yet strong, the early formation of a higher-low suggests a possible trend reversal.
✅ Conclusion:
BAT/USDT is currently trading in a high-probability reversal zone with strong historical support. If this zone holds, it could trigger a significant multi-level bullish rally. A good opportunity for patient traders with proper risk management.

BATUSDT 1W AnalysisBAT ~ 1W Analysis
#BAT This trade is very high risk
This is the lowest support block for now. Buy with a short term target of at least 20%+ from here.
BATUSDT 1D Analysis BAT ~ 1D Analysis
#BAT Buy gradually from here if you still have confidence in this coin with a short term target of at least 15%+ from here.

BATUSDT 1D AnalysisBAT ~ 1D Analysis
#BAT Buy when re -testing this support block with a short -term target of at least 10%+ from here.

BATUSDT 1WBAT ~ 1W Analysis
#BAT Buy gradually from here with a short -term target of at least 20%+. This is the lowest support block for now.

BATUSDT 1WBAT ~ 1W
#BAT If you still have a Conviction on this Coin, buy gradually from here with a minimum target of 20%+

BATUSDT 1WBAT Update ~ 1W
#BAT So far it still maintains its bullish structure. Buy gradually within this support block,. minimum target 20%+

BATUSDTBAT ~ 1W
#BAT If you have Conviction on this Coin,. It's time to start buying again. This is the best price to start accumulating as much.

BATUSDTBAT ~ 1W
#BAT If you have Conviction on this Coin,. It's time to start buying again. This is the best price to start accumulating as much.

BATUSDT Daily Timeframe IdeaBINANCE:BATUSDT
Inverse Head n shoulder of BATUSDT, I think it will breakout.
Targets are 0.21 0.22 0.23 0.24
Stop Loss 0.18
NOT A FINANCIAL ADVISE DYOR

BATUSDT Elliott Waves AnalysisHello friends.
Please support my work by clicking the LIKE button👍(If you liked). Also i will appreciate for ur activity.
Everything on the chart.
Entry: Market and lower
Targets: 0.35 - 0.45 - 0.55 - 0.7
after first target reached move ur stop to breakeven
Stop: under 0.17 (depending of ur risk).
RR: 1 to 5
ALWAYS follow ur RM
risk is justified
Good luck everyone!
It's not financial advice.
DYOR!

BAT/USDT A successful breakout the resistance, Bullish Momentum!💎 BAT has recently encountered significant market dynamics. Currently, BAT is confronting a resistance area after experiencing a substantial rebound from the demand zone.
💎 If BAT manages to break out above the resistance area, there's probability for the price to resume its upward trajectory and reach our target at the bearish OB area.
💎 However, if BAT faces rejection at the resistance level, there's a possibility that the price will retreat downward, revisiting the demand zone around $0.29 to gather momentum for another potential breakout.
💎 It's crucial for BAT to bounce when it reaches the demand area. Failure to do so, resulting in a breakdown below the demand zone, could signal bearish sentiment, potentially leading to further downward movement in price.

BAT/USDT Possibility it could back to retest the strong resist!!💎 BAT's recent market performance has been impressive. After a strong bounce from its support area, there's a real possibility it could continue its upward trajectory and retest the strong resistance area, potentially breaking through it.
However, should BAT struggle to ascend soon, it might retreat back to its support area, necessitating a new buildup of momentum. If BAT returns to this support zone, maintaining its level will be crucial. A failure to hold above the support could lead to a downturn, sending BAT towards the critical demand area of $0.196.
This demand zone is pivotal for BAT's market trajectory. A breach below this level could signify a shift to a bearish trend, leading to further declines. On the other hand, if BAT manages to hold within this area and demonstrates a strong recovery or bounce, it will need to reclaim its position above the support level to resume its upward movement.

Batusdt Channel Range Batusdt
Attempting Breakout Incase of successful breakout i am expecting 30-50% bullish move
Wait for confirmation & always manage your risk and trade with your own resreach

🟢 BATUSDT - 1D (29.09.2022)🟢 BATUSDT
TF: 1D
Side: Long
Pattern: Bull Flag
SL: $0.27277
TP 1: $0.33069
TP 2: $0.35915
TP 3: $0.38215
BAT is getting stronger and on the verge of breaking out. It is a good buy and is going to be a strong crypto in the future with a lot of adoption.
RSI and MACD are getting ready to pop on 3D TF.

BATUSDT analysis crypto scenarioMarket is on the way to our buying area green WCL for the bearish green sequence on the same time the WCL for the bullish red sequence RR 4:1

BAT - Buying SignalBYBIT:BATUSDT.P
1H time frame
-
BAT already broke the downtrend and retested it recently, also it got valid support here.
With continuous wave forecast, we can long it here and set TP as below.
-
Entry: Market
Add: 0.292
TP: 0.302, 0.31, 0.32
SL: 0.29

BATUSDT Breaking it's major support!BATUSDT Technical analysis update
Short level: $0.346 - $0.355
Stop loss : $0.375
TP 1 : $0.325
TP 2 : $0.305
TP 3 : $0.270
Always keep stop
Thanks
Hexa

BATUSDT Analysis (LOCAL VISION)Hello friends.
Please support my work by clicking the LIKE button👍(If you liked). Also i will appreciate for ur activity. Thank you!
Everything on the chart.
Entry: market and lower
Target: 0.5 and ~0.6
after first target reached move ur stop to breakeven
Stop: ~0.35 (depending of ur risk). ALWAYS follow ur RM .
Risk/Reward: 1 to 5
risk is justified
Good luck everyone!
Follow me on TRADINGView, if you don't want to miss my next analysis or signals.
It's not financial advice.
Dont Forget, always make your own research before to trade my ideas!
Open to any questions and suggestions.

[ALTCOIN] BATUSDT TREND LINE ANALYSIS/a strong trend lineHello, everyone
We're a team that specializes in chart analysis
We will always analyze and provide you with charts to help you sell
There are so many trading laws and there are so many good technologies that come with them, but I'm confident that the trend line is really strong.
If you read the point of view and get to know the line, every line will adjust
Thank you.
------------------------------------------------------------------------------------------------
Chart Analysis Content -
Currently, there is a rebound in the horizon support section and it is rising along the upward trend, but it is showing a precarious appearance by failing to retest and posting again and repeating the retest.
Even if it goes up, it is expected to face resistance from the downward trend of thick red one to two times.
If it breaks through the downward trend of thick red, it can settle stably above the upward trend of thick blue.

batusdt Bat usdt risky trad ,
reason for entry . main trend line break , liquadity above equal highs, it show strong buy in screener maybe we can pus little bit

BATUSDT Analysis (LOCAL VISION)Hello friends.
Please support my work by clicking the LIKE button👍(If you liked). Also i will appreciate for ur activity. Thank you!
Everything on the chart.
Entry: market and lower
Target: 1 - 1.2 - 1.4
after first target reached move ur stop to breakeven
Stop: 0.65 (depending of ur risk). ALWAYS follow ur RM .
Risk/Reward: 1 to 3
risk is justified
Good luck everyone!
Follow me on TRADINGView, if you don't want to miss my next analysis or signals.
It's not financial advice.
Dont Forget, always make your own research before to trade my ideas!
Open to any questions and suggestions.
