BAT/USDT — Descending Channel: Reversal or Bearish Continuation?On the 12-hour timeframe, BAT/USDT remains in a medium-term downtrend after failing to hold the supply area above 0.28. Price continues to move consistently within a descending channel, indicating that selling pressure is still dominant, although bearish momentum has started to slow down.
The current price structure shows lower highs and lower lows, confirming that the primary trend remains bearish until a valid breakout is confirmed.
---
Pattern Explanation
Price is forming a Descending Channel (Bearish Channel):
Upper line (red): dynamic resistance
Lower line (yellow): dynamic support
Channel midline: temporary reaction zone
This pattern reflects stable seller control, where buyers are only able to generate short-lived relief bounces without changing the overall trend structure.
The descending channel is technically considered a bearish continuation pattern, unless a strong breakout to the upside occurs.
---
Key Levels
Resistance:
0.2325 – 0.2430 → supply zone / horizontal resistance
0.2800 → major resistance & previous breakdown area
Support:
0.2000 → psychological support & current reaction area
0.1750 → lower channel support
0.1547 → previous low (major support)
---
Bullish Scenario
The bullish scenario is only valid if a confirmed breakout occurs:
1. Price breaks and closes above the upper channel
2. Break above 0.2325 – 0.2430 accompanied by increasing volume
3. Structure shifts into higher highs and higher lows
Bullish targets (step-by-step):
0.2600
0.2800
0.3040 (previous high)
Without a channel breakout, any upward move should be considered a pullback within a downtrend.
---
Bearish Scenario
The bearish scenario remains the primary scenario:
1. Price fails to break the upper channel
2. Rejection occurs around the 0.2200 – 0.2300 area
3. Breakdown below 0.2000 support
Bearish continuation targets:
0.1750
0.1547 (major support / potential capitulation zone)
As long as price stays inside the channel, the probability of forming a new lower low remains high.
---
Conclusion
BAT/USDT is still trading within a valid descending channel, indicating that the bearish trend is not yet over. Buyers need a clear structural breakout to reverse the trend. As long as price is capped below channel resistance, downside risk remains dominant.
Recommended approach:
Wait for a breakout + retest for safer long entries
Or look for rejection at resistance to trade in line with the trend
#BATUSDT #BAT #CryptoAnalysis #TechnicalAnalysis #DescendingChannel #BearishTrend #Altcoin #PriceAction #Downtrend
Batusdtlong

BATUSDT UPDATE#BAT
UPDATE
BAT Technical Setup
Pattern: Falling Wedge Pattern
Current Price: $0.1908
Target Price: $0.2690 – $0.2720
Target % Gain: 40.95%
Technical Analysis: BAT has broken out of a falling wedge pattern on the 4H chart, showing bullish momentum. Price has pushed above the descending resistance trendline, confirming the breakout. A steady increase in buying pressure supports the move, and the target zone aligns with the previous supply area where price last rejected. This setup remains valid as long as BAT holds above the breakout level.
Time Frame: 4H
Risk Management Tip: Always use proper risk management.

#BAT/USDT#BAT
The price is moving in a descending channel on the 4-hour frame and is sticking to it very well and is expected to break it upwards
We have a bounce from a major support area in green at 0.1550
We have a downtrend on the RSI indicator that was broken upwards which supports the rise
We have a trend to stabilize above the 100 moving average which supports the rise
Entry price 0.1700
First target 0.1920
Second target 0.2033
Third target 0.2152

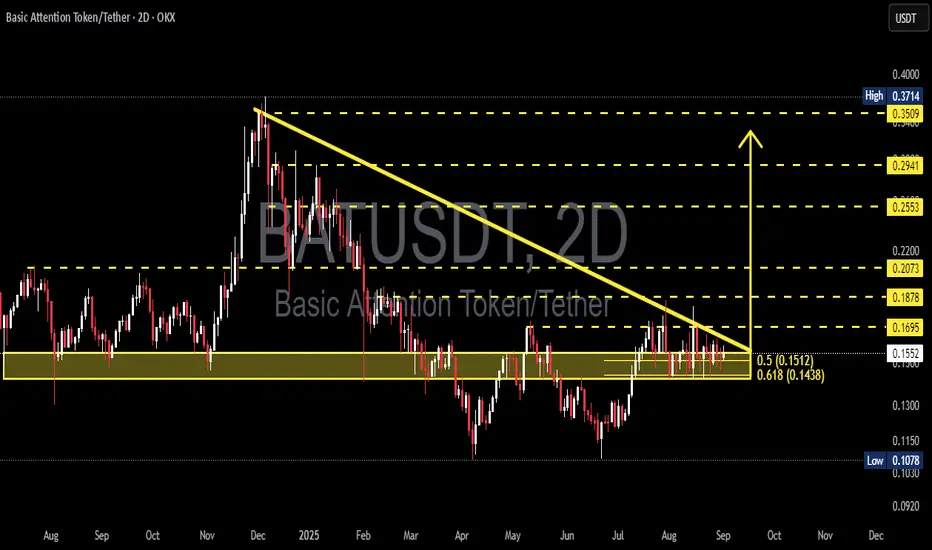
BAT/USDT — Critical Zone: Breakout or Breakdown Ahead?Summary:
BAT is currently consolidating at a critical support zone after a prolonged downtrend. Price action is being squeezed between a descending trendline from late 2024 highs and a strong horizontal support area at 0.1438–0.1512 (Fibonacci 0.618 & 0.5). This structure has formed a descending triangle / falling wedge on the 2D timeframe. The market is waiting for a decisive move: will bulls manage a breakout reversal, or will bears push for a breakdown continuation?
---
🔎 Chart Breakdown
1. Strong Support Zone
0.1512 (Fib 0.5) and 0.1438 (Fib 0.618) have repeatedly acted as a demand area.
Price is consolidating inside this yellow box region.
2. Descending Trendline
Connecting lower highs since December 2024.
Price is now at the apex, nearing a decisive breakout or breakdown.
3. Key Resistances to the Upside
0.1695 → 0.1878 → 0.2073 → 0.2553 → 0.2941 → 0.3509 (with 0.3714 high as the major resistance).
4. Supports Below
First target at 0.115.
Deeper support at 0.1078 (previous structural low).
---
📈 Bullish Scenario
Trigger:
A confirmed 2D candle close above the descending trendline and 0.1695, supported by strong breakout volume.
Validation:
Retest of the broken trendline as new support.
Targets:
TP1: 0.1878
TP2: 0.2073
TP3: 0.2553
Extended: 0.2941 → 0.3509
Stop-loss:
Conservative: below 0.1435.
Aggressive: below 0.151.
Bullish Conclusion:
If price breaks upward, this pattern may act as a falling wedge reversal, opening room for a significant rally after a long accumulation.
---
📉 Bearish Scenario
Trigger:
A 2D candle close below 0.1438, ideally with high selling volume.
Validation:
Failed retest of the support area, confirming it as resistance.
Targets:
TP1: 0.115
TP2: 0.1078 (previous macro low).
Stop-loss:
Above the descending trendline or between 0.155–0.17, depending on entry.
Bearish Conclusion:
If support breaks, the descending triangle will confirm as a bearish continuation pattern, exposing lower liquidity zones and potentially retesting macro lows.
---
📌 Pattern Insight
Descending Triangle: typically a bearish continuation signal.
Falling Wedge: often a bullish reversal pattern.
Current structure could validate either direction → confirmation is key.
---
📝 Trading Strategy & Risk Management
Risk per trade: 1–2% of capital maximum.
Watch for false breakouts (long wicks without strong volume).
Always check BTC market trend, as altcoins usually follow Bitcoin’s direction.
Confirmation tools: RSI above 50 & bullish MACD cross for upside, or opposite for downside.
---
📢 Final Notes
BAT is at a make-or-break level. The next 2D candle close, combined with volume confirmation, will likely decide the next major move. Traders should remain patient and avoid premature entries until the direction is clear.
#BAT #BATUSDT #Crypto #TechnicalAnalysis #Breakout #Bearish #Bullish #Altcoins #PriceAction
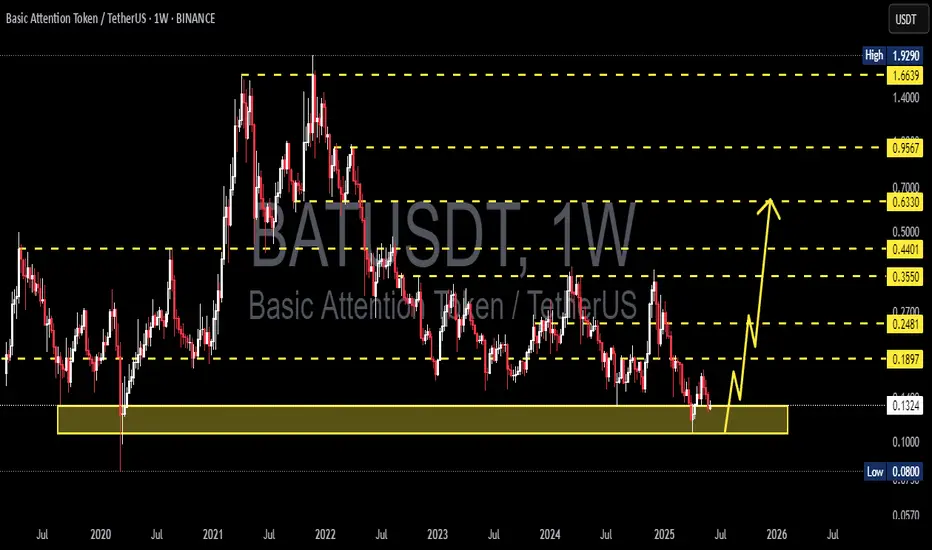
BAT/USDT Golden Zone: Massive Rebound Potential from Historical 🔶 1. Strong Support Zone (Highlighted in Yellow):
A key demand zone lies between $0.080 – $0.1212.
This area has acted as strong support multiple times since 2020, showing signs of institutional accumulation or whale interest.
🔼 2. Bullish Reversal Scenario:
A recent bounce from this golden support zone suggests a potential bullish reversal.
The projected path (yellow arrows) illustrates a step-by-step rally toward multiple resistance levels.
Potential Upside Targets:
🔹 $0.1648 (Initial minor resistance)
🔹 $0.2098 (Previous consolidation zone)
🔹 $0.3551 (2023 distribution zone)
🔹 $0.4368 (Major pre-breakdown resistance)
🔹 $0.6275 (Medium-term bullish target)
🔹 $0.9412 – $1.6487 (Long-term resistance levels)
📉 3. Risk Management & Invalidations:
A weekly close below $0.1212 may trigger a move toward the $0.090 – $0.080 historical low zone.
A breakdown below that would invalidate the bullish outlook and call for a reassessment.
📆 4. Timeframe & Additional Signals:
This is a weekly timeframe chart, ideal for swing or long-term traders.
While volume confirmation is not yet strong, the early formation of a higher-low suggests a possible trend reversal.
✅ Conclusion:
BAT/USDT is currently trading in a high-probability reversal zone with strong historical support. If this zone holds, it could trigger a significant multi-level bullish rally. A good opportunity for patient traders with proper risk management.

BATUSDT 1W AnalysisBAT ~ 1W Analysis
#BAT This trade is very high risk
This is the lowest support block for now. Buy with a short term target of at least 20%+ from here.
BATUSDT 1D Analysis BAT ~ 1D Analysis
#BAT Buy gradually from here if you still have confidence in this coin with a short term target of at least 15%+ from here.

BATUSDT 1D AnalysisBAT ~ 1D Analysis
#BAT Buy when re -testing this support block with a short -term target of at least 10%+ from here.

BATUSDT 1WBAT ~ 1W Analysis
#BAT Buy gradually from here with a short -term target of at least 20%+. This is the lowest support block for now.

BATUSDT 1WBAT ~ 1W
#BAT If you still have a Conviction on this Coin, buy gradually from here with a minimum target of 20%+

BATUSDT: Blue Box Opportunity Ahead?BATUSDT: Blue Box Opportunity Ahead? 💹
The blue box below could be an ideal entry zone, but only if market conditions align. As always, patience and precision are key, don’t jump in without confirmation.
How to approach this:
Blue Box: A potentially strong demand area worth monitoring closely.
LTF Confirmation: Wait for low time frame (LTF) structure breaks before executing trades.
Smart trading wins the day! Manage your risk, watch the charts, and stay ready. Boost, comment, and follow for more expert insights! 🚀
Let me tell you, this is something special. These insights, these setups—they’re not just good; they’re game-changers. I've spent years refining my approach, and the results speak for themselves. People are always asking, "How do you spot these opportunities?" It’s simple: experience, clarity, and a focus on high-probability moves.
Want to know how I use heatmaps, cumulative volume delta, and volume footprint techniques to find demand zones with precision? I’m happy to share—just send me a message. No cost, no catch. I believe in helping people make smarter decisions.
Here are some of my recent analyses. Each one highlights key opportunities:
🚀 GMTUSDT: %35 FAST REJECTION FROM THE RED BOX
🎯 ZENUSDT.P: Patience & Profitability | %230 Reaction from the Sniper Entry
🐶 DOGEUSDT.P: Next Move
🎨 RENDERUSDT.P: Opportunity of the Month
💎 ETHUSDT.P: Where to Retrace
🟢 BNBUSDT.P: Potential Surge
📊 BTC Dominance: Reaction Zone
🌊 WAVESUSDT.P: Demand Zone Potential
🟣 UNIUSDT.P: Long-Term Trade
🔵 XRPUSDT.P: Entry Zones
🔗 LINKUSDT.P: Follow The River
📈 BTCUSDT.P: Two Key Demand Zones
🟩 POLUSDT: Bullish Momentum
🌟 PENDLEUSDT.P: Where Opportunity Meets Precision
🔥 BTCUSDT.P: Liquidation of Highly Leveraged Longs
🌊 SOLUSDT.P: SOL's Dip - Your Opportunity
🐸 1000PEPEUSDT.P: Prime Bounce Zone Unlocked
🚀 ETHUSDT.P: Set to Explode - Don't Miss This Game Changer
🤖 IQUSDT: Smart Plan
⚡️ PONDUSDT: A Trade Not Taken Is Better Than a Losing One
💼 STMXUSDT: 2 Buying Areas
🐢 TURBOUSDT: Buy Zones and Buyer Presence
🌍 ICPUSDT.P: Massive Upside Potential | Check the Trade Update For Seeing Results
🟠 IDEXUSDT: Spot Buy Area | %26 Profit if You Trade with MSB
📌 USUALUSDT: Buyers Are Active + %70 Profit in Total
🌟 FORTHUSDT: Sniper Entry +%26 Reaction
🐳 QKCUSDT: Sniper Entry +%57 Reaction
📊 BTC.D: Retest of Key Area Highly Likely
This list? It’s just a small piece of what I’ve been working on. There’s so much more. Go check my profile, see the results for yourself. My goal is simple: provide value and help you win. If you’ve got questions, I’ve got answers. Let’s get to work!

BATUSDT 1WBAT Update ~ 1W
#BAT So far it still maintains its bullish structure. Buy gradually within this support block,. minimum target 20%+

BATUSDTBAT ~ 1W
#BAT If you have Conviction on this Coin,. It's time to start buying again. This is the best price to start accumulating as much.

BATUSDT Bullish Head and Shoulders PatternBATUSDT technical analysis update
BAT price has broken the inverse head and shoulders neckline resistance on the daily chart. The price is trading above the 100 EMA, suggesting a potential bullish move in the coming days.
Regards
Hexa

BAT • CRYPTO Basic Attention Token USD • LONG TF H1#BAT • CRYPTO Basic Attention Token USD • LONG TF H1
The trend continues, the nearest support level according to my calculations TP = 0.1887

BATUSDTBAT ~ 1W
#BAT If you have Conviction on this Coin,. It's time to start buying again. This is the best price to start accumulating as much.

BATUSDT Daily Timeframe IdeaBINANCE:BATUSDT
Inverse Head n shoulder of BATUSDT, I think it will breakout.
Targets are 0.21 0.22 0.23 0.24
Stop Loss 0.18
NOT A FINANCIAL ADVISE DYOR

BATUSDT Elliott Waves AnalysisHello friends.
Please support my work by clicking the LIKE button👍(If you liked). Also i will appreciate for ur activity.
Everything on the chart.
Entry: Market and lower
Targets: 0.35 - 0.45 - 0.55 - 0.7
after first target reached move ur stop to breakeven
Stop: under 0.17 (depending of ur risk).
RR: 1 to 5
ALWAYS follow ur RM
risk is justified
Good luck everyone!
It's not financial advice.
DYOR!

#BAT/USDT#BAT
The price is moving in a bearish channel on the 12-hour frame and is largely sticking to it
We have a green support area at 0.2200 that is expected to be bounced from due to its strength
We have a trend to hold above the Moving Average 100, which is strong support for the rise
We have very strong oversold resistance on the RSI indicator to support the rise with a strong downtrend
Entry price is 0.2550
The first target is 0.2856
The second target is 0.3122
The third goal is 0.3490

#BAT/UST#BAT
The price is moving in a bearish flag on the 12-hour frame
We also have a good penetration and therefore we seek stability
above moving average 100
We have a major support area at the 0.2100 level
We have a positive divergence on RSI
Entry area 0.2330
The first target is 0.2356
The second target is 0.2547
The fourth target is 0.2704

BAT - The FRACTAL No One Talks About💥Hi Traders, Investors and Speculators of the Charts 📈📉
For the longer term, Basic Attention Token BATUSDT is another altcoin I am extremely bullish on - and it's currently trading in an ideal accumulation zone ! What I expect for BAT is similar to a scenario that played out in November 2020 - April 2021. Notice that this occurs over a longer period, where the price of BAT went from $0.16c parabolic to $1.64 at its highest point. Therefore, the price must first fall lower towards the bottom of the support zone where there is a large demand zone . In other words, DOWN first, then UP.
And remember.. Don't be a Bob-Trader:
The continues market cycle between Bitcoin and altcoins can clearly be seen at the moment. It goes something like this:
🤩 Bitcoin goes UP ... Bob Fomo buys the rally
🤔 Bitcoin corrects ... Bob panics and sells
🤑 Altcoin rallies ... Bob thinks, screw BTC , I'm going all in on this altcoin
😨 Altcoins correct ... Bob panics. Altcoins are scams! Sells everything
🤩 Bitcoin goes up .... Bob Fomo buys the rally
Moral of the story...Don't be like Bob. Don't try to FOMO in whilst the price is going up. Plan your trade, preset your TP and SL.
While you're here 👀 Check out this idea on Bitcoin:
_______________________
📢Follow us here on TradingView for daily updates and trade ideas on crypto , stocks and commodities 💎Hit like & Follow 👍
We thank you for your support !
CryptoCheck

BAT Has A very good investment opportunity Hi Everyone;
today we have one of the best risk to reward Investment opportunity
it is more than 600 times the risk and the chart is look very promising.
I expect breaking the previous bear market key point will clear the way to the final target

Batusdt Channel Range Batusdt
Attempting Breakout Incase of successful breakout i am expecting 30-50% bullish move
Wait for confirmation & always manage your risk and trade with your own resreach
