BB BlackBerry Limited Options Ahead of EarningsIf you haven`t bought BB before the rally:
Now analyzing the options chain and the chart patterns of BB BlackBerry Limited prior to the earnings report this week,
I would consider purchasing the 4.50usd strike price Puts with
an expiration date of 2027-1-15,
for a premium of approximately $1.04.
If these options prove to be profitable prior to the earnings release, I would sell at least half of them.
BB

BlackBerry still encrypts, just not phones anymoreBB closed the week at 4.28. The weekly chart shows a symmetric triangle forming after a fully completed falling wedge. The key point is that price has already reacted from the 0.618 Fibonacci level near 4.00, which aligns with the highest volume area on the Volume Profile and a clear demand zone. A golden cross between MA50 and MA200 on the weekly timeframe adds strong confirmation to the medium term bullish structure. As long as price holds above 4.00, the setup remains constructive with upside potential toward 6.00 and 8.35.
On fundamentals as of December 14, 2025, BlackBerry continues its shift into cybersecurity and software solutions. Fiscal year revenue is around 1.05 billion dollars, with steady growth in IoT and QNX driven by automotive and industrial contracts. Cash reserves exceed 250 million dollars, debt remains limited, and management is focused on margin expansion and strategic partnerships.
BlackBerry is no longer chasing hype, it is quietly building infrastructure.Sometimes the quiet names move first.

From Fallen Giant to Trillion-Dollar Titan — "BlackBerry"From fallen giant to future trillion-dollar titan.
The world forgot BlackBerry… but smart money didn’t. 👀📈
Once the undisputed king of smartphones, BlackBerry (BB) collapsed under the weight of innovation it helped create. But while the world moved on, BlackBerry quietly evolved — transforming from a phone maker into a global cybersecurity, AI, and IoT powerhouse .
Now, the charts and fundamentals whisper the same story: the comeback may already be in motion. 📈🔥
🧠 The New BlackBerry: The Silent Infrastructure of the Digital Age
🔒 Cybersecurity Backbone:
BlackBerry’ s Cylance AI secures over 250M+ endpoints worldwide — protecting enterprises, governments, and critical systems. As AI-driven cyber threats rise, BB’s advanced detection tech is becoming a necessity, not a luxury.
🚗 Automotive Intelligence (QNX):
Over 235M vehicles already run on BlackBerry QNX , trusted by automakers like BMW, Ford, Toyota, and Volkswagen. QNX isn’t just car software — it’s the operating system for the connected vehicle future . With autonomous mobility on the rise, every car is a potential BlackBerry endpoint.
☁️ IoT Expansion with AWS:
Through BlackBerry IVY , co-developed with Amazon Web Services, BB is redefining how vehicles and smart devices share data securely. As the world connects billions of devices, BB could become the security standard behind the Internet of Everything. 🌐
⚡ The Technical Confluence — Smart Money & Wave Theory Alignment
🌀 Elliott Wave 2 correction nearing completion — exhaustion where disbelief reigns.
⚡ Wave 3 ignition potential: historically the most powerful and extended wave.
💰 Smart Money footprints: liquidity sweeps, BOS, and accumulation in key zones hint at institutional accumulation.
📏 Fibonacci 0.786 retracement and 1.618–2.618 extensions align perfectly with historical reversal levels — high-conviction confluence for a generational setup.
This is the phase where patience pays and noise fades .
💎 The Macro Mirror — History Doesn’t Repeat, But It Rhymes
Every great tech story began in disbelief:
NVIDIA (NVDA) was once a $3 stock before AI made it a trillion-dollar icon.
Tesla (TSLA) was ridiculed before redefining transportation.
Palantir (PLTR) quietly built data infrastructure before Wall Street caught up.
Now BlackBerry stands at a similar inflection — undervalued, under-owned, and misunderstood .
It’s no longer about phones — it’s about owning the digital nervous system of the future .
📅 Accumulation: 2024–2028
🚀 Expansion: 2029–2044
🌕 Euphoria: 2045+
"The world once held BlackBerry in its hand. Soon, it might hold the world in its network."🌍✨
Traders!
💬 What do you think — is BlackBerry quietly preparing to shock the world again? — Team FIBCOS
#BlackBerry #ElliottWave #BB #SmartMoney #Fibonacci #IoT #Cybersecurity #AI #LongTermInvesting #TechRebirth #TradingView #ComebackStory

Weekly Chart Review | Oct 6-10, 2025I wasn’t able to post my analysis on TradingView last week, so here’s a structured summary of my ticker reviews from Oct 6–10, segmented by sector with brief commentary. Each includes an update on trend structure and a link to both the original chart and the latest revision as of Friday’s close.
Technology
NASDAQ:AMD – Clean follow-through off mid-term support into the upper band of resistance. Strong rejection increases the odds that a mid-term top for the uptrend since April is being formed. Any lower-high formation next week should be approached with caution.
Chart:
Previously:
• Upside potential to resistance (Oct 7):
• Downside potential:
• On resistance & bounce potential (Aug 6):
• On macro resistance (Jul 29):
• On macro bottoming potential (Apr):
NASDAQ:NVTS – Followed the Aug–Sep setup and delivered a strong breakout Friday, but late-day reversal increases the odds of a longer consolidation into 7.80–6.80 support.
Chart:
Previously:
• Breakout and local support (Oct 10):
• Consolidation and upside potential (Sep 30):
• Higher-low potential (Sep 26):
• Mid-term support (Aug 25): www.tradingview.com
NASDAQ:MRVL – Reached the key mid-term resistance zone outlined earlier. Friday’s rejection increases odds of a pullback into 80–72 support over the coming weeks.
Chart:
Previously:
• On mid-term top (Oct 10):
• On resistance zone (Oct 2): www.tradingview.com
NASDAQ:WDC – Orderly follow-through to the downside into the 21 EMA.
Chart:
Previously: downside potential to 21 EMA –
NYSE:RBLX – Rejected at local resistance, aligning with the downside structure.
Chart:
Previously: downside potential (Oct 8):
NASDAQ:REKR – Shows strong relative strength with steady consolidation at support; constructive base-building continues.
Chart:
Previously: follow-through and support (Oct 7):
NYSE:AI – Friday breakout attempt faded back into support, increasing odds of prolonged base-building and a potential deeper pullback to 17–16.
Chart:
Previously:
On continuation potential (Oct 8):
NYSE:BB – Failed on immediate continuation and returned to support.
Chart:
Previously:
On continuation potential (Oct 8):
NASDAQ:OPEN – Constructive consolidation stalled as failed breakouts shifted odds toward a deeper pullback into mid-term support.
Chart:
⸻
Blockchain
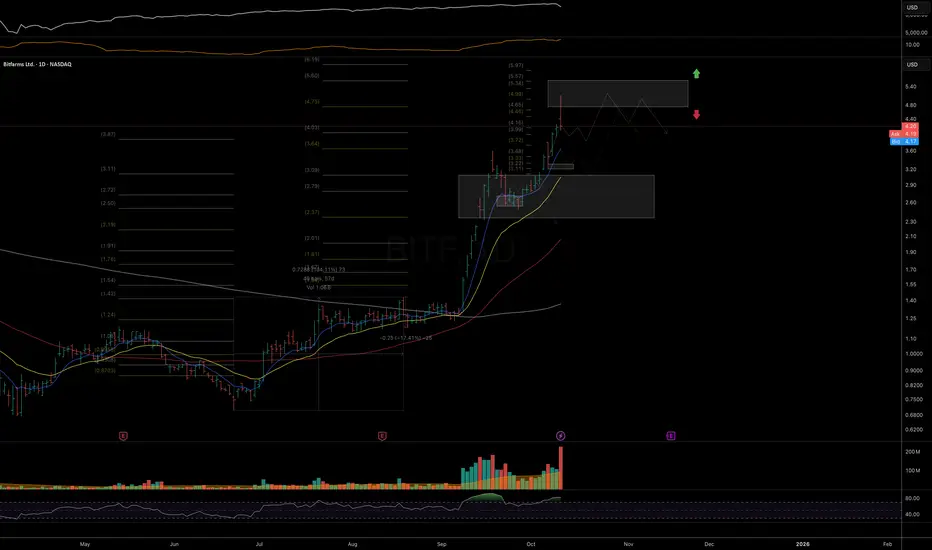
NASDAQ:BITF – Tagged the ideal macro resistance zone; odds rise for at least a mid-term top/base formation here.
Chart:
Previously:
On upside continuation (Oct 7):
NASDAQ:HIVE – Rejection at the top of mid-term resistance; probabilities favor the start of a reversal phase.
Chart:
Previously:
On macro resistance (Oct 6):
On more immediate upside potential (Sep 24): www.tradingview.com
•On bullish potential (Sep 10): www.tradingview.com
• On bullish trend structure (Jul 21): www.tradingview.com
NYSE:BKKT – No follow-through on continuation setup, but key local support still holds; structure remains intact while above it.
Chart:
Previously:
On continuation (Oct 9):
NASDAQ:BULL – Rotating back toward macro support near 11; monitoring for higher-low formation and reversal trigger.
Chart:
Previously:
On reversal and macro support (Oct 8):
On immediate bullish potential (Sep 26): www.tradingview.com
• On macro support (Sep 19): www.tradingview.com
• On macro support (Sep 4): www.tradingview.com
• On mid-term resistance (Aug 6): www.tradingview.com
• On support and bounce potential (Jul 30): www.tradingview.com
NASDAQ:BTM – Bullish setup invalidated by breakdown into mid-term support.
Chart:
Previously:
On bullish follow-through if LOD holds (Oct 6):
⸻
Biotechnology / Healthcare
NASDAQ:VKTX – Strong follow-through from September update; watching for consolidation back into key EMAs to reset momentum.
Chart:
Previously:
On follow-through (Oct 6):
• On break-out potential (Sep 30): www.tradingview.com
• On resistance zone (Aug 11): www.tradingview.com
• On upside momentum continuation (Jul 18): www.tradingview.com
• Original setup (Jun 30): www.tradingview.com
• Follow-up (Jul 8): www.tradingview.com
NASDAQ:NTLA – Clean follow-through into mid-term resistance; rising odds for a topping/base formation.
Chart:
Previously:
On break-out to resistance zone (Oct 8):
On support and bullish trend-structure (Sep 26): www.tradingview.com
NASDAQ:PGEN – Couldn’t stage a recovery yet but remains within mid-term support; stabilization needed for a constructive setup.
Chart:
Previously:
On potential reversal (Oct 8):
On mid-term support (Sep 15): www.tradingview.com
NASDAQ:ABCL – Momentum attempt resumed but failed to follow-through; still constructive above 21 EMA.
Chart:
Previously:
On local support and continuation potential (Oct 8):
On support and bullish trend-structure (Oct 7):
⸻
Energy
AMEX:GTE – Impulsive advance at risk of morphing into a diagonal correction; elevated probability of retesting September higher lows.
Chart:
Previously:
On constructive looking consolidation (Oct 6):
⸻
Miscellaneous / Other
NASDAQ:SLDP – Rising risk of a local top after Friday’s distribution; while above 21 EMA, a final push into resistance remains possible.
Chart:
Previously:
On follow-through and resistance zone (Oct 6):
On mid-term support and bullish potential (Sep 19): www.tradingview.com
NASDAQ:DPRO – Solid 2.5-day follow-through from the Oct update; Friday’s action suggests increased consolidation or reversal risk.
Chart:
Previously:
On local support and continuation (Oct 7):
NASDAQ:DLO – Disappointing fade after a promising start; must hold above 50-DMA to reassert upside momentum.
Chart:
Previously:
On break-out potential (Oct 8):
On pullback potential (Sep 22): www.tradingview.com
• On downside potential and support (Sep 3): www.tradingview.com
Thank you for your attention and have a great start of the week!
$BB \ BouncebitThe bounce bit 3D chart shows a significant falling trend line, and the supply zone has been tested and rejected.
The price is currently gathering strength in the demand zone and maintains its upward potential without breaking the ascending channel structure.
The next breakout will signal a major trend reversal in the 3D chart.
All eyes will be on the supply zone ($0.25) 👀

BB - MORNING VIEW VS NOW! ON POINT AGAINNYSE:BB - morning view vs now ... 🔥
11% up already, is it just getting started?? 👀
TA & FA are solid🚀

BB BlackBerry Limited Options Ahead of EarningsIf you haven`t bought BB before the prevous earnings:
Now analyzing the options chain and the chart patterns of BB BlackBerry Limited prior to the earnings report this week,
I would consider purchasing the 3.50usd strike price Calls with
an expiration date of 2025-10-24,
for a premium of approximately $0.53.
If these options prove to be profitable prior to the earnings release, I would sell at least half of them.

BB has formed a double TOP📊 NYSE:BB Market Update
NYSE:BB has formed a double bottom but then broke below the support level 🔵❌. This signals potential downward movement if buyers don’t step back in. ⚠️

BBUSDT Forming Bullish WaveBBUSDT is showing a powerful bullish wave pattern, which often signals the start of a strong upward momentum phase. The price structure suggests that buyers are steadily gaining control, pushing the market toward higher resistance zones. With good trading volume supporting this move, the setup looks favorable for an extended rally. The combination of pattern formation and volume activity highlights strong participation from market players.
Current projections point to a potential gain of 80% to 90%+, making BBUSDT one of the more attractive opportunities in the market right now. Such wave patterns are typically driven by momentum traders and investors positioning themselves ahead of larger market expansions. The breakout momentum can accelerate once key resistance levels are cleared, opening the path for rapid price appreciation.
Investor interest in BBUSDT is also increasing, as shown by rising liquidity and consistent accumulation phases. This growing demand may provide the fuel for a sustained uptrend in the coming sessions. If momentum continues, BBUSDT could outperform many other pairs and deliver significant short to mid-term returns.
✅ Show your support by hitting the like button and
✅ Leaving a comment below! (What is You opinion about this Coin)
Your feedback and engagement keep me inspired to share more insightful market analysis with you!

BBUSDT Forming Bullish MomentumBBUSDT is currently displaying a bullish setup as it forms a falling wedge pattern, a classic reversal structure that often precedes significant upward momentum. This formation, coupled with strong buying interest, suggests that the market could be preparing for a major breakout move. With volume showing healthy participation, the technical picture supports an optimistic scenario, potentially driving the pair toward an 80% to 90% gain in the coming sessions.
The recent trading activity highlights that investors are accumulating positions at key support levels, showing confidence in the strength of the project. A breakout above the wedge resistance could open the path to higher price zones, with market sentiment likely pushing BBUSDT into a strong rally phase. This aligns with the overall bullish tone observed across altcoins, where patterns like falling wedges are signaling trend reversals.
Investor interest in BBUSDT is steadily increasing, which further validates the bullish outlook. The consistent inflow of volume strengthens the probability of sustained price action once the breakout gains momentum. Such setups tend to attract both short-term traders looking for quick gains and long-term holders expecting larger price expansions.
In conclusion, BBUSDT is shaping up as a strong bullish opportunity with its falling wedge breakout potential, solid volume, and rising investor interest. If momentum continues, the coin could deliver a powerful upside move of 80% to 90%+, making it one of the attractive setups to keep on the radar.
✅ Show your support by hitting the like button and
✅ Leaving a comment below! (What is You opinion about this Coin)
Your feedback and engagement keep me inspired to share more insightful market analysis with you!

BBUSDT UPDATE#BB
UPDATE
BB Technical Setup
Pattern : Bullish Falling Wedge pattern
Current Price: $0.1603
Target Price: $0.3359
Target % Gain: 120%
Technical Analysis: BB has broken out of a falling wedge on the 1D chart with strong momentum. The breakout candle closed above resistance with good volume, signaling bullish continuation. Confirmation above $0.17 could push towards the measured target.
Time Frame: 1D
Risk Management Tip: Always use proper risk management.

QNX Everywhere.”Every movement in the market is the result of a natural law and of a cause which exists long before the effect takes place and can be determined years in advance. The future is but a repetition of the past, as the Bible plainly states…” -- W.D. Gann
youtube.com
"Down just means, not up yet" -- Bathsalt

HSI on the climb—ride the waves with your own strategy!6May2025
Hello everyone! how was the HSI trade so far?
From the previous updates trust everyone likely knows how the movement of the Index.
Paying attention on how it moved and the forecast of futures movement seems predicted. Of course, some times it may not go according to what you forecasted. Hence, to develop your own trade plan is essential.
From previous posts:-
MACD - Deadcross formed 20/3/2025 on D Chart.
MACD - Goldencross formed 21Apr2025 on D chart, although still within bearish zone but it did a short bull run since then; opened at 21015 on 22Apr and as of writing 22613; it gives around 1598pts ~7.6% gained.
CAPITALCOM:HK50
Fast forward to now:-
4H chart
at point of writing ✍️: the Index uptrend mode is on track again.
Trade for profit requires persistency and consistence. The constancy is kind of boring.
Buy into support Sell at resistance.
Set your TP/SL & protect your capital.
currently on D Chart -
20EMA:22065; 50EMA:22080 (both are sticking together at the moment and curving up)
🚨 as of ✍️ :
🗝️ Resistance Level : 22700-22730
🗝️ Support Level : 22360-22400
🗝️ Strong Support Level : 21950-21990
W Chart:- HSI:HSI
HSI continues its Bullish mode with strong pullback! Recovery could expected to see in end Jun - early Jul'25.
17Mar2025 -
24Mar2025 -
7Apr2025 -
6May2025 -
Continue the Long call for HSI:HSI with the forecast and repetitive of history the next 4-6weeks might be a good profit taking level; hold any long position and manage the risk as well.
Target to take profit: 24630-24910 (it may break 25000 level, and paused at 25300 strong resistance level, you may crosscheck with Month chart for the Bullish trend; last week the MACD signal line break above the zero level.)
For current markets condition, the CHN & HKG continue to be volatile with the continuing noise from tariff and on macro the numbers could be mixed.
🎯 Reminder: For long term (6-18 months) continue to accumulate China & HKG for the potential upside for the year! All retracement is a good entry point. Again, everything is impermanence. Manage your risk, position sizing. Take only the risk that you can afford.
🔎 DYODD and don't listen to anyone. Invest in yourself, do some study and learn along the way while you trying to verify or finding the answer if to start invest in CHN/HKG markets. If you don't know how or where, you may ask Deepseek/Chatgpt for most reputable Trading courses nearest to you.
Stay sharp, trade smart, and let consistency be your superpower. 📈🍵📙
Continue to trade; continue your life as it is!
Happy Trading!
** Please Boost 🚀/LIKE 👍, FOLLOW ✅, SHARE 🙌 and COMMENT ✍ if you enjoy this idea! Share your trading journey to encourage peoples who pursing the same journey.

HSI testing resistance levels —will it break through or bounced?25/03/2025
🚨🚨🚨
HSI resistance is being tested for short-term!
Investors tend to take profit towards quarter end.
HSI:HSI
MACD - Deadcross formed 20/3/2025.Resistance 24750-24600 level.
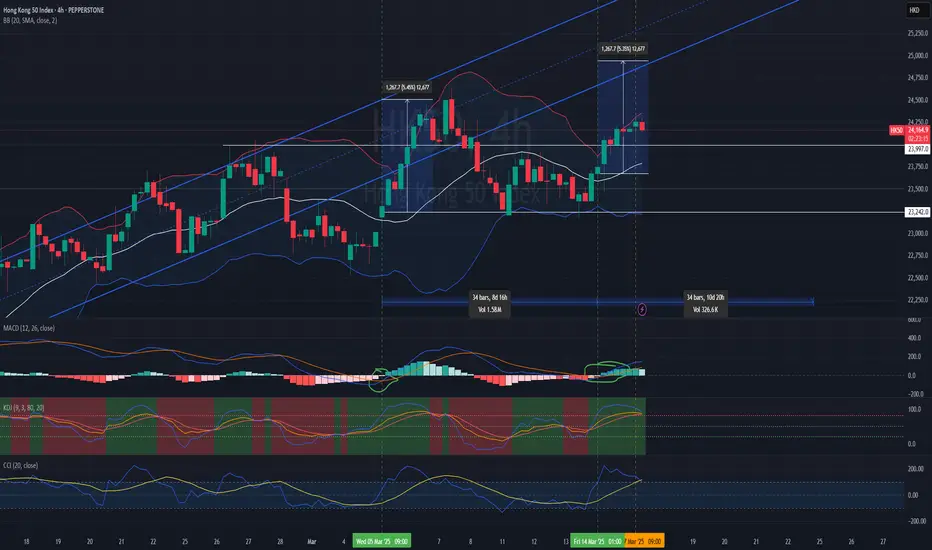
4H chart: PEPPERSTONE:HK50
at point of writing ✍️: the Index uptrend mode is paused and moving out of bound from the uptrend channel.
MACD : moving below zero line - Bearish mode.
KDJ: below 30 level in the bearish zone. Hopefully the divergence cycle completing soon for a strong reversal.
BB - ranging at lower BB; mid-line:23986 (this is your 🗝️ level for your long/short TP/SL level)
Set your TP/SL and let the markets works.
For this week trade plan: Most likely short the index for days to few weeks until get confirmation of trendline back to uptrend channel. Buy into support Sell at resistance. Set your TP/SL.
🚨 as of ✍️ :
Support/Resistance Levels :
22979
23030
23242(23374)
23526
23997
24385
24586
24648
24945
🗝️🗝️🗝️Level: 23526-23620
HSI continues its Bullish mode.
W Chart:-
17Mar2025 -
24Mar2025 -
📰 another -ve news, but this might be distraction. 🚨
www.tradingview.com
Shares in Hong Kong slumped 487 points or 2.0% to 23,417 on Tuesday morning, reversing gains from the prior session amid concerns over U.S. recession risks and China’s deflation threat.
www.tradingview.com
** Hong Kong's benchmark Hang Seng Index declined 2.2%, and the Hang Seng Tech Index
HSTECH lost 3.5%.
For current markets condition, the CHN & HKG can be volatile with the continuing noise from tariff.
🎯 Reminder: For long term (6-18 months) continue to accumulate China & HKG for the potential upside for the year! All retracement is a good entry point.
🔎 DYODD and don't listen to anyone. Invest in yourself, do some study and learn along the way while you trying to verify or finding the answer if to start invest in CHN/HKG markets. If you don't know how or where, you may ask Deepseek/Chatgpt for most reputable Trading courses nearest to you.
Let's follow our own strategy and zen with 📙 and 🍵 for profits.
** Please Boost 🚀/LIKE 👍, FOLLOW ✅, SHARE 🙌 and COMMENT ✍ if you enjoy this idea! Share your trading journey to encourage the trading buddies.

BBUSDT – Blue Box Support, Red Box Resistance! “Key levels in play—will buyers defend, or will resistance hold strong?”
🔥 Key Insights:
✅ Blue Box = Support Zone – If buyers step in, it’s a great reaction area.
✅ Red Box = Resistance Zone – A breakout or rejection will decide the next move.
✅ LTF Breakouts & CDV Confirmations Are a Must – No confirmation, no trade.
💡 The Smart Plan:
Watch Blue Box for Buy Reactions – But only with CDV & LTF structure shifts.
Red Box is a Key Resistance – A clean breakout = bullish. A rejection = short opportunity.
Patience Wins – We wait for confirmation, not emotions.
“The market will decide—we just trade with the right signals!” 📈🔥
A tiny part of my runners:
🎯 ZENUSDT.P: Patience & Profitability | %230 Reaction from the Sniper Entry
🐶 DOGEUSDT.P: Next Move
🎨 RENDERUSDT.P: Opportunity of the Month
💎 ETHUSDT.P: Where to Retrace
🟢 BNBUSDT.P: Potential Surge
📊 BTC Dominance: Reaction Zone
🌊 WAVESUSDT.P: Demand Zone Potential
🟣 UNIUSDT.P: Long-Term Trade
🔵 XRPUSDT.P: Entry Zones
🔗 LINKUSDT.P: Follow The River
📈 BTCUSDT.P: Two Key Demand Zones
🟩 POLUSDT: Bullish Momentum
🌟 PENDLEUSDT.P: Where Opportunity Meets Precision
🔥 BTCUSDT.P: Liquidation of Highly Leveraged Longs
🌊 SOLUSDT.P: SOL's Dip - Your Opportunity
🐸 1000PEPEUSDT.P: Prime Bounce Zone Unlocked
🚀 ETHUSDT.P: Set to Explode - Don't Miss This Game Changer
🤖 IQUSDT: Smart Plan
⚡️ PONDUSDT: A Trade Not Taken Is Better Than a Losing One
💼 STMXUSDT: 2 Buying Areas
🐢 TURBOUSDT: Buy Zones and Buyer Presence
🌍 ICPUSDT.P: Massive Upside Potential | Check the Trade Update For Seeing Results
🟠 IDEXUSDT: Spot Buy Area | %26 Profit if You Trade with MSB
📌 USUALUSDT: Buyers Are Active + %70 Profit in Total
🌟 FORTHUSDT: Sniper Entry +%26 Reaction
🐳 QKCUSDT: Sniper Entry +%57 Reaction
📊 BTC.D: Retest of Key Area Highly Likely
I stopped adding to the list because it's kinda tiring to add 5-10 charts in every move but you can check my profile and see that it goes on..

HSI charging forward, but watch that resistance!Helloy everyone,
Yesterday the Index performed quite well; bullish.
Trying to go back to the uptrend channel.
PEPPERSTONE:HK50
at point of writing ✍️:
MACD - Deadcross formed. Sell/Short at resistance level 24730-24650
BB - 23953(lower BB) mid-line:24350 (this is your 🗝️ level for your long/short TP/SL level)
Quote from 17/3/2025 post
For this week trade plan: Buy into support Sell at resistance. Set your TP/SL.
🚨 as of ✍️ :
🗝️ Level : 22979-23242(23374)- 23997- 24385 - 24586 - 24648 - 24945
To retest 24385 again.
Set your TP/SL, let the market do its thing, and ride the trend with confidence! Manage your risk/reward (r/r).
HSI continues its Bullish mode.
HSI:HSI
W Chart:-
📰 another +ve news, but this might be distraction. 🚨
www.tradingview.com
🎯 Reminder: Continue to accumulate China & HKG for the potential upside for the year! All retracement is a good entry point.
🔎 DYODD and don't listen to anyone. Invest in yourself, do some study and learn along the way while you trying to verify or finding the answer if to start invest in CHN/HKG markets. If you don't know how or where, you may ask Deepseek/Chatgpt for most reputable Trading courses nearest to you.
** Please Boost 🚀/LIKE 👍, FOLLOW ✅, SHARE 🙌 and COMMENT ✍ if you enjoy this idea! Share your trading journey to encourage the trading buddies.
While wait for the markets cook, you may zen with 📙 and 🍵because stress won’t make the candles move! 🚶
Happy Trading!

Was the break over? HSI bulls are back on the field and ready?Hello everyone, happy Monday!
Last week movement, HSI retraced consecutive 4 trading days and slight recover on Friday yet closed with loss 271pts; -1.12% for the week of 10 Mar 2025. However, YTD it has logged an increased of +4216.69pts; +21.02%. HSI:HSI
MACD - Goldencross was marked in Green (5Mar25; 14Mar25)
BB - Currently trading within upper BB channel.the Mid-line 4H chart at 23789 at point of writing ✍️.
For this week trade plan:
Buy into support Sell at resistance. Set your TP/SL.
🚨 as of ✍️ :
🗝️ Level : 22979-23242(23374)- 23997- 24385 - 24586 - 24648 - 24945
To retest 24385 again.
The Index continues its Bullish mode.
With some catalyst news to support Long call.
www.tradingview.com
🎯 Reminder: Continue to accumulate China & HKG for the potential upside for the year! All retracement is a good entry point.
🔎 DYODD and don't listen to anyone. Invest in yourself, do some study and learn along the way while you trying to verify or finding the answer if to start invest in CHN/HKG markets. If you don't know how or where, you may ask Deepseek/Chatgpt for most reputable Trading courses nearest to you.
** Please Boost 🚀/LIKE 👍, FOLLOW ✅, SHARE 🙌 and COMMENT ✍ if you enjoy this idea! Share your trading journey to encourage the trading buddies
oh wow, seems the Index has the wheel to run!Hello everyone! Happy Friday!
News📰 : anticipate more positive news to come (of course mixed with some -ve for retracement) 🔮
Look at the HSI D Chart
- posted 28Feb2025
- posted 3Mar2025
- 7March2025 at point of writing; the index trading above the support level of 23500 (the 28Feb2025 Hi); it tried to go back to uptrend channel and staying above! (broke on 28Feb2025).
Monitor the Trading volume: finance.yahoo.com
Avg past 3 months : 77.909Bn (+19.18% for the past avg vol); this imply the fund flow is abundance, hopefully this continues! Although the vol is slightly less than the last Oct 2024.
Look at the 4H chart
PEPPERSTONE:HK50
The HSI last Dec 2021 Hi @ 24385 is being tested again today!
Now, what's next? 25147, btw now and then Next level that we are looking at to break (oh wow! we need to add in past Higher Hi):
22840-22900
23241-23275-23314- 23471 (need to break above this level to change back to uptrend movement, else probably is gonna be sideways, continue to monitor and confirm)
23952-24101
24385
24586
24747
24800
25147
🚨 as of ✍️ :
Resistance : 24385 - 24586 - 24800. Let's monitor; this level is now being tested and see if breaks and staying above.
🗝️ support level
22750 -23535 (this level being tested few times; it's now became strong support level). Don't think this can easily broke down.
MACD - Goldencross was marked in Green (5Mar25)
KDJ - Remained at Bullish green zone since 4Mar25, the CFD is now in a short bullrun cycle.
BB - Still within lower BB channel and gap up trading at upper BB channel/
the Mid-line 4H chart at 22960-975 was corrected from 23320.
Trade Plan : 23477-24385 - 24751
Buy into support & Sell at resistance
the 1H showing it's now bullrun on the 2nd half of today. Ride on the waves and locked in your profits.
🚨🚨🚨 Locked your profits and watch out for reversal for retracement!
Monitor the 1H,4H movement with confirmation using MACD & KDJ indicator.
Set your tf, have your entry and exit plan!
Pay attention to the Goldencross/DeadCross; practice makes perfect.
Let's follow our own strategy and zen with 📙 and 🍵 for profits.
Happy Trading everyone!
🎯 Start to accumulate China & HKG for the potential upside for the year! All retracement is a good entry point.
🔎 DYODD and don't listen to anyone. Invest in yourself, do some study and learn along the way while you trying to verify or finding the answer if to start invest in CHN/HKG markets.
HKEX:2800 - 22.90-22.82 if it happens to retrace back to this level, otherwise anytime NOW is entry point! It's confirmed by the 200MA (above in W chart) ; also the W chart MACD GoldenCross. Cross-check it; if need helps let us know.
HKEX:2823 - 13.17-14.75 can start to open position and start accumulate, is allowed to wait for confirmation once it breaks 14.75 level. But you will be getting at higher cost...
HKEX:2801 - open position at price : 23.73-23.80 or anytime NOW! if ever retraced back to 23.36-23.66 accumulate more.
HKEX:3067 - open position now, add position when it retraced to 11.63,,11.33 or below. If you have missed, you may tk position still good to start at 11.85,11.99,12.15
** Please Boost 🚀/LIKE 👍, FOLLOW ✅, SHARE 🙌 and COMMENT ✍ if you enjoy this idea! Share your trading journey to encourage the trading buddies

is the Trumph speech boost the Index? n is Wednesday the humpdayHello everyone! How was yesterday trade? Hope everyone stick to the strategy set the SL/TP for your day trade.
News📰 : as expected and anticipate more positive news this week 🔮
www.tradingview.com
**China shares waver, HK bounces as Beijing vows more support for consumption, AI**
HSI +1.30% at this news published.😂
Look at the HSI D Chart
- posted 28Feb2025
at point of writing; the index closed below key support level of 22900-23000 (the strong level of 23000 which is the 10MA level, the uptrend is broken 28Feb25); as mentioned this level has been retest 3 times, let's continue to monitor.
However, today the Index open Hi. So trade ⚠ cautiously. Don't chase Hi.
Trading volume: finance.yahoo.com
Date Volume
Mar 3,2025 4,338,200,000
Feb 28, 2025 6,578,300,000
Feb 27, 2025 6,257,000,000
Feb 26, 2025 5,138,100,000
Feb 25, 2025 4,449,800,000
Monthly
Mar 1 2025 - 4,338,200,000 (as of todate)
Feb 1 2025 - 93,960,700,000 (+7.53% from prev month)_correction
Jan 1 2025 - 52,385,800,000
Dec 1 2024 - 56,349,200,000
Avg past 3 months : 77.909Bn (+19.18% for the past avg vol); this imply the fund flow is abundance, hopefully this continues! Although the vol is slightly less than the last Oct 2024.
Look at the 4H chart
PEPPERSTONE:HK50
The HSI last Oct Hi @ 23241 has been broken, this level could be the resistance level for the Index to break the next level Hi. The HK50 last Oct Hi @ 23258.
Now, what's next?
As updated:-
Next level that we are looking at to break:
20985
21336-21350
22020-22535, 22840-22900
23241-23275-23314- 23471 (need to break above this level to change back to uptrend movement, else probably is gonna be sideways)
23952-24101
24385
🚨 as of ✍️ :
it stays above 22535(retest 3 times and this might formed very strong support level).
🗝️ support level :
22990 broken :22340-22750 (this level being tested 3 times 17,20Feb & 4Mar; last tested at 22535.3)
MACD - Deadcross was marked in Green, continue to curving down (4h Chart)
KDJ - Reverse to Bullish green zone on 4Mar25; the CFD continue to trading the upwards trend till now.
BB - Still within lower BB channel and gap up trading at upper BB channel/
the Mid-line 4H chart at 22960-975 was corrected from 23320.
Trade Plan: might pullback to 23020 to fill the gap. Range : 23025-23258
Buy into support : 22880-22960(confirm with indicators)
Sell at resistance : 23150, 23190, 23372/400, 23454,23512(it soared to hit ,this morning)
Monitor the 1H,4H movement with confirmation using MACD & KDJ indicator.
Set your tf, have your entry and exit plan!
Pay attention to the Goldencross/DeadCross; practice makes perfect.
Let's follow our own strategy and zen with 📙 and 🍵 for profits.
Happy Trading everyone!
🎯 Start to accumulate China & HKG for the potential upside for the year! All retracement is a good entry point.
🔎 DYODD and don't listen to anyone. Invest in yourself, do some study and learn along the way while you trying to verify or finding the answer if to start invest in CHN/HKG markets.
HKEX:2800 - 22.90-22.82 if it happens to retrace back to this level, otherwise anytime NOW is entry point! It's confirmed by the 200MA (above in W chart) ; also the W chart MACD GoldenCross. Cross-check it; if need helps let us know.
HKEX:2823 - 13.17-14.75 can start to open position and start accumulate, is allowed to wait for confirmation once it breaks 14.75 level. But you will be getting at higher cost...
HKEX:2801 - open position at price : 23.73-23.80 or anytime NOW! if ever retraced back to 23.36-23.66 accumulate more.
HKEX:3067 - open position now, add position when it retraced to 11.63,,11.33 or below. If you have missed, you may tk position still good to start at 11.85,11.99,12.15
** Please Boost 🚀/LIKE 👍, FOLLOW ✅, SHARE 🙌 and COMMENT ✍ if you enjoy this idea or need help! *

Looks like HSI got a morning energy boost is not a Weakday!3/3/2025
Hello everyone! Happy Monday today is not a Weakday but a wonderful weekday start of the week 🫰 🫶
News📰 : this was from 28Feb2025
www.tradingview.com
N this is this morning 3Mar2025 - what do you think? I suspect more good news will come this week. 🔎🔮
www.tradingview.com
Look at the HSI D Chart
- posted 25Feb2025
- posted 26Feb2025
- posted 27Feb2025
- posted 28Feb2025
at point of ✍️; the index closed near the key support level of 22900-23000 (the strong level of 23000 which is the 10MA level); as mentioned this level has been retest 3 times, let's continue to monitor.
Trading volume: finance.yahoo.com
Date Volume
Feb 28, 2025 6,578,300,000
Feb 27, 2025 6,257,000,000
Feb 26, 2025 5,138,100,000
Feb 25, 2025 4,449,800,000
Feb 24, 2025 5,264,600,000
Monthly
Mar 1 2025 - 93,960,700,000 (+7.53% from prev month)
Feb 1 2025 - 87,382,400,000
Jan 1 2025 - 52,385,800,000
Dec 1 2024 - 56,349,200,000
Avg past 3 months : 77.909Bn (+19.18% for the past avg vol); this imply the fund flow is abundance, hopefully this continues! Although the vol is slightl less than the last Oct 2024.
Look at the 4H chart
PEPPERSTONE:HK50
The last Oct Hi @ 23241 has been broken, this level could be the resistance level for the Index to stay above for the next level.
Now, what's next?
As updated:-
Next level that we are looking at to break:23330, 23525, 23990, 24101, 24385.
🚨 as of ✍️ :it seems it stay above the key support level of 22990.
🗝️ support level : 23500 (broken) , 23175 (broken), 22990 (testing), 22741
MACD - last marked WAS deadcross and curving down as marked in YELLOW. After 8 bars-it reversed as marked in GREEN. and NOW it formed Deadcross again (as marked in YELLOW)
KDJ - Remained in bearish red zone with chance that it could reverse upwards.
BB - Still within lower BB channel and testing to break the BB mid-line for 4H chart at 23330.
Today Trade Plan: 22785-23504
Buy into support : 22900 ,23,005, 23169,23283 (confirm with the indicator if it's on the bullish zone)
Sell at resistance : 23400, 23353, 23335 (short/TP with shorter timeframe bearish zone, cross-check and wait for confirmation.)
Monitor the 1H,4H movement with confirmation using MACD & KDJ indicator.
Set your tf, have your entry and exit plan!
Pay attention to the Goldencross/DeadCross; practice makes perfect.
Let's follow our own strategy and zen with 📙 and 🍵.
Happy Trading everyone!
🎯 Start to accumulate China & HKG for the potential upside for the year! All retracement is a good entry point.
🔎 DYODD and don't listen to anyone. Invest in yourself, do some study and learn along the way while you trying to verify or finding the answer if to start invest in CHN/HKG markets.
HKEX:2800 - 22.90-22.82 if it happens to retrace back to this level, otherwise anytime NOW is entry point! It's confirmed by the 200MA (above in W chart) ; also the W chart MACD GoldenCross. Cross-check it; if need helps let us know.
HKEX:2823 - 13.17-14.75 can start to open position and start accumulate, is allowed to wait for confirmation once it breaks 14.75 level. But you will be getting at higher cost...
HKEX:2801 - open position at price : 23.73-23.80 or anytime NOW! if ever retraced back to 23.36-23.66 accumulate more.
HKEX:3067 - open position now, add position when it retraced to 11.63,,11.33 or below. If you have missed, you may tk position still good to start at 11.85,11.99,12.15
** Please Boost 🚀/LIKE 👍, FOLLOW ✅, SHARE 🙌 and COMMENT ✍ if you enjoy this idea or need help! *

HSI clocked out early, TP sit back and relax wait for next move!
Hello everyone! Today one of the web hot topic - all the 7 stars align and there must be something happen!
What do you think?
"Bulls took profits, bears took chances—HSI took a nap before the next round!" 😴📈📉
Here you go...now come with this news 📰
www.tradingview.com
**Shares in Hong Kong plunged 309 points or 1.3% to 23,415 on the last trading day of February, marking a second session of losses.
The Hang Seng fell further from its highest in over three years, set earlier in the week, and was on track for its first weekly drop in seven weeks, with all sectors posting sharp losses.
Still, markets were on course for solid monthly gains, up around 15% so far, marking a third month of rises as hopes mounted that China’s 2025 Two Sessions meeting next week will outline key policy priorities, including potential support measures for the economy.**
Look at the HSI D Chart
- posted 25Feb2025
- posted 26Feb2025
- posted 27Feb2025
- posted 28Feb2025 at point of writing; the index broke the key support level of 22900-23000 (the strong level of 23000 which is the 10MA level; let's monitor closely next week the new start for the month and see this level can be maintained. (this level has been retest 3 times)
Trading volume: finance.yahoo.com
Date Volume
Feb 27, 2025 6,257,000,000
Feb 26, 2025 5,138,100,000
Feb 25, 2025 4,449,800,000
Feb 24, 2025 5,264,600,000
Monthly
Feb 1 2025 - 87,382,400,000
Jan 1 2025 - 52,385,800,000
Dec 1 2024 - 56,349,200,000
Avg past 3 months : 65.3Bn ; current as of todate / month volume > past 3 mnths avg (i.e 57.98bn)
Look at the 4H chart (main chart)
PEPPERSTONE:HK50
The last Oct Hi @ 23241 has been broken hence retracement is not a surprised!
With the month closing today, the strong pullback is inevitable for institute and whale to take profit.
Please trade cautiously today! 🚨 🚨 🚨
Now, what's next?
As updated:-
Next level that we are looking at to break and steadily staying above this level - 23525, 23990, 24101, 24385
🚨 as of ✍️ it seems break the first support level this morning- and let's see if it could rebound today else it will go down ⬇ 👇 to 23175-22990 level, then 22741.
🗝️ support level : 23500 (broken) , 23175 (broken), 22990 (testing), 22741
MACD - last marked WAS deadcross and curving down as marked in YELLOW. After 8 bars-it reversed as marked in GREEN. and NOW it formed Deadcross again (as marked in YELLOW)
KDJ - Now reversed turned into bearish red zone. It remained in bearish zone.
BB - It is now entered lower BB channel and testing to break the lower BB and create new Lo.
Today Trade Plan: 23000-23504
Buy into support : 22795- 22900 (confirm with the indicator if its on reversal mode otherwise stayaway)
Sell at resistance : 24040,23454,23250 (short and TP within shorter timeframe, cross-check and wait for confirmation)
Monitor the 1H,4H movement with confirmation using MACD & KDJ indicator.
Set your tf, have your entry and exit plan!
Pay attention to the Goldencross/DeadCross; practice makes perfect.
Let's follow our own strategy and zen with 📙 and 🍵.
Happy Trading everyone!
🎯 Start to accumulate China & HKG for the potential upside for the year! All retracement is a good entry point.
🔎 DYODD and don't listen to anyone. Invest in yourself, do some study and learn along the way while you trying to verify or finding the answer if to start invest in CHN/HKG markets.
HKEX:2800 - 22.90-22.82 if it happens to retrace back to this level, otherwise anytime NOW is entry point! It's confirmed by the 200MA (above in W chart) ; also the W chart MACD GoldenCross. Cross-check it; if need helps let us know.
HKEX:2823 - 13.17-14.75 can start to open position and start accumulate, is allowed to wait for confirmation once it breaks 14.75 level. But you will be getting at higher cost...
HKEX:2801 - open position at price : 23.73-23.80 or anytime NOW! if ever retraced back to 23.36-23.66 accumulate more.
HKEX:3067
** Please Boost 🚀/LIKE 👍, FOLLOW ✅, SHARE 🙌 and COMMENT ✍ if you enjoy this idea or need help! *

Not every run is a marathon— it needs pit stop! Hello everyone!
Here you go...now come with this news 📰
Market Chatter: China Plans 400-Billion-Yuan Capital Injection for Banks -- 💰💰💰?
www.tradingview.com
Look at the HSI D Chart
- posted 25Feb2025
- posted 26Feb2025
- posted 27Feb2025 at point of writing; the index seems doing quite well since open this morning,
trying to stay above the support level 💣💣💣23500 (and strong level of 23000 which is the 10MA level, if break below this level the Index bullrun end, but it's unlikely as it has been retest 3 times)
Trading volume: finance.yahoo.com
Date Volume
Feb 27, 2025
Feb 26, 2025 5,138,100,000
Feb 25, 2025 4,449,800,000
Feb 24, 2025 5,264,600,000
Monthly
Feb 1 2025 - 81,125,400,000
Jan 1 2025 - 52,385,800,000
Dec 1 2024 - 56,349,200,000
Avg past 3 months : 63.28Bn ; current month Feb volume > 3 mnths avg
Look at the 4H chart
PEPPERSTONE:HK50
The last Oct Hi @ 23241 has been broken hence retracement is not a surprised!
Now, what's next? This is tough question 🙋 - Next level that we are looking at to break and steadily staying above this level - 23525, 23990, 24101, 24385
🚨if it breaks below 23454-23500 (& not rebound) it could go down ⬇ 👇 to 23250-23175
🗝️ support level : 23500, 23175, 22741 t
MACD - last marked WAS deadcross and curving down as marked in YELLOW. After 8 bars-it reversed as marked in GREEN.
KDJ - Now reversed turned into bearish red zone.
BB - continue moving above the mid line of BB, this morning touches the mid-line; so be cautious 🚨🚨🚨
Today Trade Plan: 23454-24050
Buy into support : 23454 -23550 (TP :23600-23775)
Sell at resistance : 23800-24050 (TP : 23525-23454)
Monitor the 1H,4H movement with confirmation using MACD & KDJ indicator.
Set your tf, have your entry and exit plan!
Pay attention to the Goldencross/DeadCross; practice makes perfect.
Let's follow our own strategy and zen with 📙 and 🍵.
Happy Trading everyone!
🎯: start to accumulate China & HKG for the potential upside for the year! All retracement is a good entry point.
🔎 DYODD and don't listen to anyone. Invest in yourself, do some study and learn along the way while you trying to verify or finding the answer if to start invest in CHN/HKG markets.
HKEX:2800 - 22.90-22.82 if it happens to retrace back to this level, otherwise anytime NOW is entry point! It's confirmed by the 200MA (above in W chart) ; also the W chart MACD GoldenCross. Cross-check it; if need helps let us know.
HKEX:2823 - 13.17-14.75 can start to open position and start accumulate, is allowed to wait for confirmation once it breaks 14.75 level. But you will be getting at higher cost...
HKEX:2801 - open position at price : 23.73-23.80 or anytime NOW! if ever retraced back to 23.36-23.66 accumulate more.
HKEX:3067
** Please Boost 🚀/LIKE 👍, FOLLOW ✅, SHARE 🙌 and COMMENT ✍ if you enjoy this idea or need help! *

Rebound lik a champ, monitor the vol c if the guests left early?Hello everyone! How was your zentradingstrategy? Hope everyone embrace with the retracement.
Sell on news? or Buy the dip?
What did we noticed on yesterday news? pfft..Distraction, distraction...
but here you go for today 😂😂😂: www.tradingview.com
**Shares in Hong Kong surged 520 points or 2.3% to 23,555 on Wednesday, shifting from a weak session the day before amid robust gains across all sectors.**
Look at the HSI D Chart
- posted 25Feb2025
- 26Feb2025 at point of writing; the index seems doing quite well since open this morning, trying to stay above the support level 22990.
Yesterday trading volume: finance.yahoo.com
Date Volume
Feb 26, 2025
Feb 25, 2025 4,449,800,000
Feb 24, 2025 5,264,600,000
Look at the 4H chart
PEPPERSTONE:HK50
The last Oct Hi @ 23241 has been broken hence retracement is not a surprised!
MACD - last marked WAS deadcross and curving down as marked in YELLOW. After 8 bars-it reversed as marked in GREEN.
KDJ - WAS at bearish zone curving down; and now reversed and turned bullish in green zone.
BB - now moving above the mid line of BB from yesterday ranging within the mid-line.
22990 resistance level now reversed as SUPPORT level. Hopefully the retracement is completed. Let's monitor especially the volume see if this is just a rehearsal.
Today Trade Plan: 23150-23670 (ahemmm...trust you can do the math 😂)
Buy into support : 23150 -23175 (TP :23600-23630)
Sell at resistance : 23465-23670 (TP : 23450-23500)
Monitor the 1H,4H movement with confirmation using MACD & KDJ indicator.
Set your tf, have your entry and exit plan!
Pay attention to the Goldencross/DeadCross; practice makes perfect.
Let's follow our own strategy and zen with 📙 and 🍵.
Happy Trading everyone!
Reminder : start to accumulate China & HKG for the potential upside for the year! All retracement is a good entry point.
HKEX:2800 - 22.90-22.82 if it happens to retrace back to this level, otherwise anytime NOW is entry point! It's confirmed by the 200MA (above in W chart) ; also the W chart MACD GoldenCross. Cross-check it; if need helps let us know.
HKEX:2823 - 13.17-14.75 can start to open position and start accumulate, is allowed to wait for confirmation once it breaks 14.75 level. But you will be getting at higher cost...
HKEX:2801 HKEX:3067
** Please Boost 🚀/LIKE 👍, FOLLOW ✅, SHARE 🙌 and COMMENT ✍ if you enjoy this idea or need help! 😍 **
