BCHUSD H1 | Bullish Bounce Off Pullback SupportThe price is falling towards our buy entry level at 578.39, which is a pullback support that aligns with the 50% Fibonacci retracement.
Our stop loss is set at 561.98, which is a multi-swing low support.
Our take profit is set at 600.45, which is a multi swing high resistance.
High Risk Investment Warning
Stratos Markets Limited fxcm.com Stratos Europe Ltd fxcm.com
CFDs are complex instruments and come with a high risk of losing money rapidly due to leverage. 69% of retail investor accounts lose money when trading CFDs with this provider. You should consider whether you understand how CFDs work and whether you can afford to take the high risk of losing your money.
Stratos Global LLC fxcm.com Losses can exceed deposits.
Please be advised that the information presented on TradingView is provided to FXCM (‘Company’, ‘we’) by a third-party provider (‘TFA Global Pte Ltd’). Please be reminded that you are solely responsible for the trading decisions on your account. Any information and/or content is intended entirely for research, educational and informational purposes only and does not constitute investment or consultation advice or investment strategy. The information is not tailored to the investment needs of any specific person and therefore does not involve a consideration of any of the investment objectives, financial situation or needs of any viewer that may receive it. Past performance is not a reliable indicator of future results. Actual results may differ materially from those anticipated in forward-looking or past performance statements. We assume no liability as to the accuracy or completeness of any of the information and/or content provided herein and the Company cannot be held responsible for any omission, mistake nor for any loss or damage including without limitation to any loss of profit which may arise from reliance on any information supplied by TFA Global Pte Ltd.
Stratos Trading Pty. Limited fxcm.com
Trading FX/CFDs carries significant risks. FXCM AU (AFSL 309763), please read the Financial Services Guide, Product Disclosure Statement, Target Market Determination and Terms of Business at fxcm.com
BCH

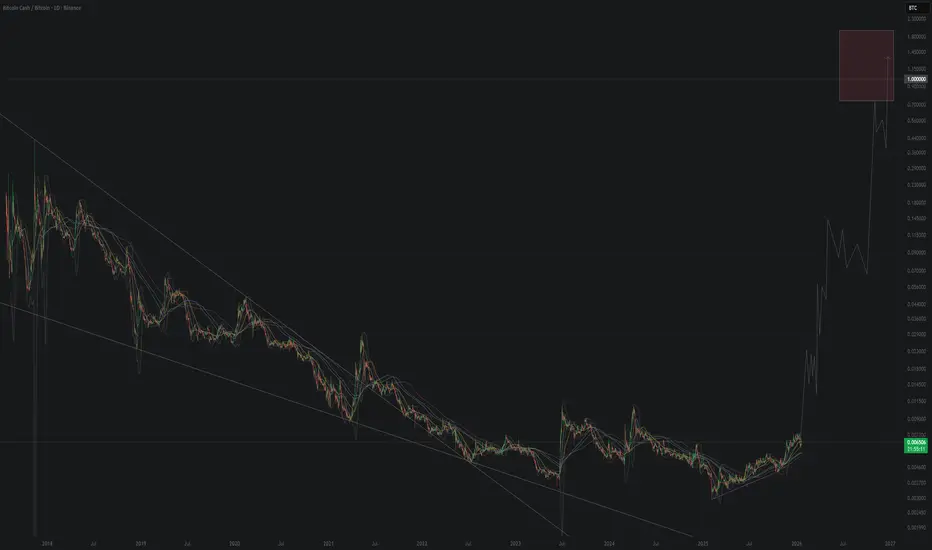
The Bitcoin Cash/Bitcoin bull runBitcoin Cash/Bitcoin began its bull run in February 2025
Long entry: 6500 sats
Take profit: between 0.70 / 1.90 btc
This is my personal opinion and this is not a financial advice! Good trading!
The Bitcoin Cash bull runBitcoin Cash began its bull run in June of 2023, we are currently only 20% of the way through the bull run.
I think the bull run will end around the end of 2026.
Long entry: 580 USD
Take profit: between 0,4 million and 2,4 million USD
In my opinion there is a high probability that it will reach between 1 and 2.5 million, 1.2 million could be a likely target.
This is my personal opinion and this is not a financial advice! Good trading!

BCHUSD H4 | Bearish Drop OffThe price has rejected our sell entry level at 592.22, which is a pullback resistance.
Our stop loss is set at 618.93, which is an overlap resistance.
Our take profit is set at 552.16, which is an overlap support.
High Risk Investment Warning
Stratos Markets Limited (fxcm.com/au), Stratos Europe Ltd (fxcm.com/au):
CFDs are complex instruments and come with a high risk of losing money rapidly due to leverage. 69% of retail investor accounts lose money when trading CFDs with this provider. You should consider whether you understand how CFDs work and whether you can afford to take the high risk of losing your money.
Stratos Global LLC (fxcm.com/en): Losses can exceed deposits.
Please be advised that the information presented on TradingView is provided to FXCM (‘Company’, ‘we’) by a third-party provider (‘TFA Global Pte Ltd’). Please be reminded that you are solely responsible for the trading decisions on your account. Any information and/or content is intended entirely for research, educational and informational purposes only and does not constitute investment or consultation advice or investment strategy. The information is not tailored to the investment needs of any specific person and therefore does not involve a consideration of any of the investment objectives, financial situation or needs of any viewer that may receive it. Past performance is not a reliable indicator of future results. Actual results may differ materially from those anticipated in forward-looking or past performance statements. We assume no liability as to the accuracy or completeness of any of the information and/or content provided herein and the Company cannot be held responsible for any omission, mistake nor for any loss or damage including without limitation to any loss of profit which may arise from reliance on any information supplied by TFA Global Pte Ltd.
Stratos Trading Pty. Limited (fxcm.com/au):
Trading FX/CFDs carries significant risks. FXCM AU (AFSL 309763), please read the Financial Services Guide, Product Disclosure Statement, Target Market Determination and Terms of Business at fxcm.com/au

Bitcoin Cash distribution underway (4H)As discussed in our previous analysis, we identified a bullish diametric structure on Bitcoin Cash. That structure has now fully matured, with the final leg — wave G — reaching completion. According to Elliott Wave and complex corrective behavior, the completion of wave G in a diametric often signals trend exhaustion, and at this stage the market typically transitions into a corrective or impulsive move in the opposite direction.
At the current price location, market structure suggests that BCH is preparing to form a bearish wave, rather than continuing higher. This expectation is not based on a single signal, but on confluence.
Trendline Break & Shift in Control
A short-term ascending trendline, marked clearly with a dashed line on the chart, has now been broken to the downside. This breakdown is important because it represents a loss of bullish momentum and confirms a shift in market control.
When price fails to respect a short-term trendline after completing a higher-degree structure (like a diametric), it often means that buyers are no longer willing to defend higher prices, while sellers are becoming increasingly aggressive. In simple terms:
➡️ Sellers are now stronger than buyers.
Market Maker Perspective – Why Price Moves Like This
From a market maker perspective, this behavior makes perfect sense. After completing wave G, price typically enters a zone where liquidity above the highs is harvested. Market makers often push price slightly higher or keep it ranging to:
Trigger late long entries
Run stop-losses above resistance
Create the illusion of continuation
Once sufficient liquidity is collected, price is then distributed and pushed lower. This is why we often see:
Fake breakouts
Slow grinding price action near highs
Sharp bearish moves after structure completion
In this case, the diametric completion combined with the trendline break strongly suggests that distribution has already occurred, and the market is now transitioning into the markdown phase.
Trade Execution – DCA Entries
We have identified two clear entry zones for this setup. Rather than entering with full size immediately, the plan is to scale into a sell/short position using DCA (Dollar Cost Averaging).
This approach:
Reduces emotional decision-making
Protects against short-term market maker wicks
Aligns with how smart money builds positions
Patience is key here. Market makers often attempt one last push to shake out early shorts before the real move begins.
Targets & Expectations
All targets are clearly marked on the chart for transparency and planning purposes. While intermediate targets exist, the primary target is the green zone, which represents:
A high-probability liquidity area
Structural support
A logical termination zone for the bearish leg
This area is where we expect profit-taking and potential reaction.
Invalidation Level – Risk Management First
No analysis is complete without a clear invalidation point.
If a daily candle closes above the invalidation level, this entire bearish scenario will be invalidated.
A daily close above that level would indicate:
The diametric structure is no longer respected
Market makers are targeting higher liquidity zones
Bias must be reassessed objectively
Until that happens, the bearish bias remains valid.
Final Notes for Traders
This setup is not about prediction — it’s about structure, liquidity, and behavior.
When structure completes, trendlines break, and liquidity aligns, the probabilities favor a directional move.
Trade with discipline, respect your invalidation, and remember:
Market makers move price to where the most pain exists — not where the crowd expects it.
$BCH Next Stop: $700?BINANCE:BCHUSDT has some of the cleanest price action right now, still trending higher and building a solid base.
It’s been repeating the same behavior consistently: consolidates for a while, then kicks into another expansion.
Right now, it looks like it’s coiling up again inside this range. As long as the base holds and we don’t lose key support, I like the odds of another push higher.
If we get a clean breakout, $690–700 is the next area I’m watching.

Bitcoin Cash BCH Breaking Out Of A Sym Triangle With A Bull FlagHello Traders,
Here is my chart for Bitcoin Cash BCH. As you can see it looks like the price has broken out of a symmetrical triangle and has bounced on top of the top trendline of the symmetrical triangle which is a bullish sign.
Also the price looks to have formed a bull flag as the price has broken the top trendline of the symmetrical triangle and the price looks to be pushing up from the bull flag. Momentum looks good on the RSI as well with the monthly reading 61.5 (middle ground) , weekly 55.5 (middle) and the daily RSI at 47 (below middle). The 4hr RSI is at 44. The reason I am saying this is when I have watched the price break out of something before and the RSI is already into overbought territory so +70 on any timeframe its likely the price has topped and its a false breakout.
Anyway, it looks like the price wants to go up from here. If the price goes up and breaks the previous LH with conviction then my target is the other LH at $1642.
Lets see what happens.

BCHUSDT Is Providing Opportunity Only Smart Traders Will Catch Yello Paradisers! Are you watching this closely enough? Because #BCH respecting critical ascending support, and if you're not prepared, you might miss out on a huge opportunity. Additionally, we are seeing selling climax has been formed, a classic probability that institutional buyers are stepping in. This is where things start to get exciting.
💎#BCH overall structure is bullish on higher time frames and on retracement #BCH respecting the ascending support. Further the Relative Strength Index (RSI) is showing clear divergence, adding more weight to the bullish case.
💎#BCH holds momentum within the Fair value within the demand zone, the setup remains high probability targeting an initial upside move toward 645, a key moderate resistance and structural level.
💎#BCH formed selling climax, a bullish probability that confirms accumulation. During the retracement we saw a selling climax followed by a climactic action candle with ultra-high volume a textbook probability that smart money is loading up. Most importantly, if it breaks the above the upper trigger line of the selling climax (climactic action bar) with a momentum candle, these are the clearest probabilities that the big players are positioning for upside. If this momentum sustained, #BCH could climb toward 665, which is a major resistance to watch.
💎If #BCH fails to hold bullish momentum and a momentum candle closes below 561, the current bullish probability becomes invalid. In that case, we could see further downside pressure.
That is why Paradisers, we are playing it safe right now. If you want to be consistently profitable, you need to be extremely patient and always wait only for the best, highest probability trading opportunities only on confirmations.
MyCryptoParadise
iFeel the success🌴

BCHUSD H4 | Bearish BreakoutThe price is reacting off our sell entry level at 620.10, which is an overlap resistance.
Our stop loss is set at 660.37, which acts as a multi-swing high resistance.
Our take profit is set at 580.20, an overlap support.
High Risk Investment Warning
Stratos Markets Limited (

Bitcoin Cash (BCH) — Weekly OutlookPrice is approaching a major weekly resistance zone that has capped price multiple times in the past.
This level is key — how price reacts here will define the next macro leg.
Current structure:
Strong impulse from long-term support
Clean higher highs & higher lows
Momentum remains intact while holding above weekly support
Key level to watch:
~630–680 zone → previous resistance
This area must flip into support to unlock continuation
If price:
Flips & holds above resistance → continuation toward the $1,000+ region becomes likely
Rejects hard → expect a deeper retracement before continuation
No need to front-run.
Weekly closes will tell the real story.
What’s your bias here — clean flip or first rejection before continuation? 👇👇👇
MrC

BCHUSD H4 | Bullish ContinuationThe price is reacting off our buy entry level at 620.10, which is a pullback support that aligns with the 61.8% Fibonacci retracement.
Our stop loss is set at 592.44, which is an overlap support.
Our take profit is set at 661.06, which is a swing high resistance.
High Risk Investment Warning
Stratos Markets Limited (

BCHUSD H1 | Bullish BounceThe price is falling towards our buy entry level at 621.76, which acts as a pullback support that is slightly below the 50% and the 38.2% Fibonacci retracement.
Our stop loss is set at 592.44, which is an overlap support.
Our take profit is set at 661.06, which is a swing high resistance.
High Risk Investment Warning
Stratos Markets Limited (

BCH - BOOOM ???CRYPTOCAP:BCH - Weekly Setup shared on 19th December...
MAGIC TWEET INCOMING??
YES
NO

BCH/USDT – Higher Timeframe Long ContinuationPrice has reclaimed a key HTF level and is holding above the previous resistance, now acting as support. Structure remains bullish, with price positioned for continuation toward higher liquidity levels.
Entry: 638.2
Stop Loss: 571.9
TP1: 705.9
Final TP: 802.2
Bias remains bullish as long as price holds above the support zone.
#BCH #BCHUSDT

BCHUSD H4 | Bullish Bounce Off Pullback SupportBased on te h4 chart analysis, we could see the price fall to our buy entry level at 577.67, which is a pullback support that lines up with the 78.6% Fibonacci retracement.
Our stop is set at 552.67, which is an overlap support.
Our take profit is set at 619.93, which is a multi swing high resistance.
High Risk Investment Warning
Stratos Markets Limited (

BCH - LONG IDEAMy long-term review: It's a profitable trade that continues to this day.
(RU version) -
Now may be a good time for those who don't want to wait months to enter.
We have a beautiful 4H FVG long position, so let's see how it reacts. If it consolidates, we enter. If it falls below the lows, we ignore the idea.
It's very simple. The nearest target is $700+.
BINANCE:BCHUSDT.P

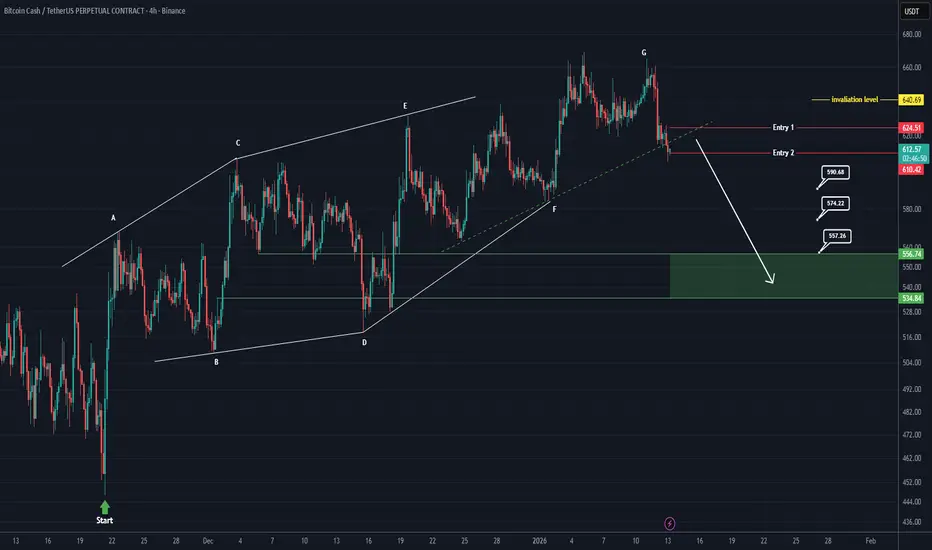
BITCOIN CASH Analysis (4H)From the point marked with the green arrow on the chart, Bitcoin Cash has formed a bullish diametric pattern. At this stage, wave E of the diametric appears to be completed, and price has entered wave F.
We have identified two entry zones on the chart, where positions should be built using a DCA strategy.
The targets for wave G have been clearly marked on the chart.
A daily candle close below the invalidation level will invalidate this scenario.
For risk management, please don't forget stop loss and capital management
When we reach the first target, save some profit and then change the stop to entry
Comment if you have any questions
Thank You

BCH Buy/Long Signal (4H)The structure of Bitcoin Cash is bullish and it continues to form higher highs and higher lows.
Each bullish wave in this fractal moves more than 1 percent and the previous lows are not taken. We expect the same behavior this time as well with the price rising at least 19 percent.
Therefore buy or long positions can be considered at the support levels of the previous wave.
The targets are marked on the chart.
Do not enter the position without capital management and stop setting
Comment if you have any questions
thank you

Bitcoin cash looks set for a weekly rally! Technical outlook [ NYSE:BCH / USDT]:
✅ Bullish
✅ Ascending structure weekly (bull accumulation likely)
✅ Ascending accumulation structure (above uptrend) monthly!
Accumulation under resistances often lead to explosive move!
The current price is stuck under the 630 & 705 resistances, but a weekly candle break above $630 could unleash a huge bull rally!
I see an upcoming rally toward 860then 980 - $ 1,000 📈
The good question is when sir? 👀
⚠️ Not financial advice - DYOR.

BCH: $700–$800 Before the Next Bear MarketBCH Macro Resistance Before Bear Market
Based on historical price structure, Bitcoin Cash (BCH) appears to be approaching a macro resistance zone around $700–$800 , which has previously marked the final upside before major bear markets.
In 2018 and 2022, BCH followed a very similar pattern:
A prolonged accumulation phase
A strong push into a horizontal resistance zone
A rejection from that zone, followed by a deep bear market decline
The current structure closely mirrors those past cycles. Price is once again testing the same historical supply zone, where sellers previously stepped in aggressively.
Key idea:
I expect BCH to reach the $700–$800 range
This level could act as the last distribution zone before the broader market transitions into a new bear market phase
This is not a short-term trade idea, but a macro perspective based on repeating market behavior and long-term resistance reactions.
⚠️ As always, confirmation is needed, and this scenario is invalidated i f price accepts and holds above the resistance zone.

BCHUSD Wants to Run Drawn a large broadening structure allowing the formation of the next bull move up to the upper line.
ALT SEASON ?
Weekly chart

BCHI expect Bitcoin Cash to make a 25% correction from this level. This is the first flag, and it may not correct here and instead wait for the second flag, then pull back to the level I’ve marked.
The analysis is based on a strategy called NDS.

BCH Sell/Short Signal (1H)Add this symbol to your watchlist and enter the position once it reaches the entry zone.
Considering that BCH is in a bearish structure on the hourly timeframes, we are looking for sell/short opportunities at order blocks and origin zones.
We have identified two targets. At the first target, secure partial profits and then move the position to break-even.
Do not enter the position without capital management and stop setting
Comment if you have any questions
thank you
