BCH long riding this through the bull market After the FOMC meeting we should get a clearer direction. I will be watching this pair for the duration so stick around!!!
BCH

BCH usdt a fast and small tradethere is a pretty small risk move so i will take it
SHORT/SELL BCH USDT
50% at 135.1 TP 132.4 SL 140.1
50% at 137 TP 133.3 SL 140.1
I expect it to be completed in the next few hours.
FOLLOW FOR MORE

Bitcoin Cash Finally Descending Channel Breakout & Retest Has Already Confirmed
Expecting 180 To 200% bulish Wave
Always Go With Good Risk To Reward Ratio

BCHUSD Potential for Bullish Continuation | 27th January 2023Looking at the Daily chart, my overall bias for BCHUSD is bullish due to the current price being above the Ichimoku cloud, indicating a bullish market. Looking for a buy stop entry at 138.53, where the recent high is, we are looking to take profit at 164.97, where the previous swing high is. Stop loss will be placed at 125.82, where the previous overlap support and 23.6% Fibonacci line is.
Any opinions, news, research, analyses, prices, other information, or links to third-party sites contained on this website are provided on an "as-is" basis, as general market commentary, and do not constitute investment advice. The market commentary has not been prepared in accordance with legal requirements designed to promote the independence of investment research, and it is therefore not subject to any prohibition on dealing ahead of dissemination. Although this commentary is not produced by an independent source, FXCM takes all sufficient steps to eliminate or prevent any conflicts of interest arising out of the production and dissemination of this communication. The employees of FXCM commit to acting in the clients' best interests and represent their views without misleading, deceiving, or otherwise impairing the clients' ability to make informed investment decisions. For more information about the FXCM's internal organizational and administrative arrangements for the prevention of conflicts, please refer to the Firms' Managing Conflicts Policy. Please ensure that you read and understand our Full Disclaimer and Liability provision concerning the foregoing Information, which can be accessed on the website.

Wait for congratulations ( bull run??)Hi guys
Are you bullish on Bitcoin?
I still did not publish the comment, welcome to the bull market.
So I'm not sure right now.
Bitcoin has now hit its biggest downtrend line. With its failure, the market will go up. But to break it, at least 2 weekly candles should be closed above it.
If the price drops sharply, it can drop up to 13,000.
So wait for my next analysis.
Also, be sure to see my previous analysis.

bchIt has a resistance range and a midline of the channel
If it passes, the first resistance is the roof of the channel
In case of correction, green numbers can be taken as support in 30 minutes time

Potential Breakout in BCH, Target at 135The main view of this trade idea is on the Daily Chart.
The cryptocurrency Bitcoin Cash (BCH) appears to be in an asymmetrical triangle setup. The downward trendline of lower highs of 156 and 124 was broken on 8th January, 2023. The support trendline of 88 and 95 continues to be held. Expectations are for the breakout of the triangle to continue and BCH is expected to rally towards 135. This view will be negated if BCH were to decline below 95.
Technical Indicators
The technical indicators corroborates this view. BCH’s Supertrend is back in buy-mode after the Index crossed above 103. Also, BCH is back above the Daily MA, the 1st time since 13th December, 2022. The Awesome Oscillator is above 0 and trending higher while the RSI is above 50.
The intra-day trend following indicators of the cryptocurrency also display uptrends in the 15-Min, 2-Hour and 4-Hour time frames. Short to medium term support is seen around the 95 - 98 price range.
Recommendation
The recommendation will be to go long at market, with a stop loss at 95 and a target of 135. This produces a risk/reward ratio of 2.21.
Disclaimer
The views expressed are mine and do not represent the views of my employers and business partners. Persons acting on these recommendations are doing so at their own risk. These recommendations are not a solicitation to buy or to sell but are for purely discussion purposes.

Real Test Of Bitcoin Recently We Seen massive buying Volume In btc
In higher Tfs Btc Is Testing Structure Level (Higher Low) And I think Its real Test Of btc strength Once We Got weekly close Above 25200 Then Btc will Start Its Uptrend Officially
For Further Confirmation I Added 50Ema IF We Look On Btc History Of Past Years Then We Can clearly See Whenever Btc Breaks 50ema Btc Makes New Ath
Massive Rsi Divergence Also Indicating Reversal
Final Thoughts When Btc Breaks Hl And 50Ema Moving Average ( Once That Happens Lots Of longterm Investors Will In ) and btc will Easily Test Its ath
however its just an idea dyor before taking any action share your thoughts in comments section

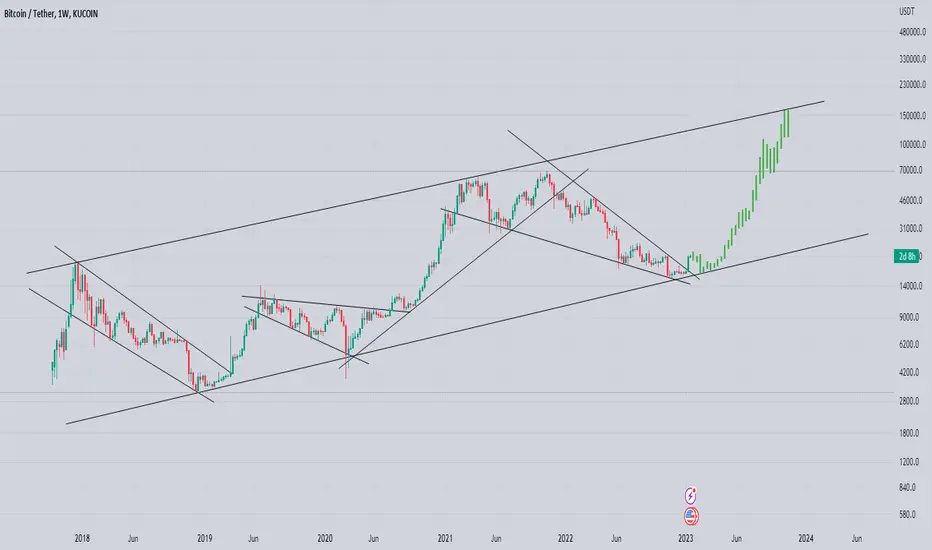
Bitcoin Higher Timeframe Analysis Lets Check Btc Behaviour Of Recent years
Btc Over All Moving In Ascending Channel From few Years In weekly Timeframe
And Btc Test Trendlines Of Channel And If Its breaks Pattern Withen Channel Than Usually Btc tests Opposite Tl Of channel
Now Btc tested Trendline Beautifully And Bounced With strong Buying volume Also Btc Breaks Falling Wedge withen Channel
And If we Compare Btc From Its recent history than We Can See Clearly A test Of Upper trendline Of ascending Channel almost (180000) Area
BCHUSD - 30% Jump Incoming After Breaking Descending TrendBCHUSD has recently received a buy signal from Crypto Tipster v2 after bouncing off recent support on the underside.
This suggests that the cryptocurrency may be entering a bullish market and could see a significant increase in value. The question now is whether BCHUSD will be able to break through a descending trend line to reach 30% in profit after a year and a half of a generally downward trend.
***
If you enjoyed or agree with this idea - drop us a comment, like & follow! :)
***

✴️ Bitcoin Cash Major Breakout, Looks Good To Me!Here we are again with the same conditions as visited before in the Binance Coin and Cardano charts... Bullish consolidation.
I was sharing in the BNBUSDT article yesterday the fact that corrections tend to become felt in crypto.
Retraces can happen slowly which means that the current consolidation can turn into a retrace but as for corrections, they go down fast and strong as soon as a resistance level is hit.
This type of action we are seeing with Bitcoin Cash (BCHUSDT) kinds of breeds doubt and uncertainty... But, as shared in the BTC CME Futures GAPs article, Who's selling ?
Bitcoin Cash looks good...
After the break above EMA100, we have 6 days of consolidation. This consolidation is taking place above EMA10 and all the rest.
The RSI is super strong.
As long as the consolidation continues to be this strong, our bullish bias remains intact and we aim for the next target... $150 followed by $170 and so on.
You can read below to expand on this trade idea.
Three relevant articles mentioned are:
1) ✴️ Binance Coin | New Money Enters The Market, BULLS Confirmed!
2) 🅱️ BTC CME Futures GAPs Points To $35K, Who's Selling? | Go UP!
3) 🅱️ (₿) The Real Meaning Of A Bitcoin "Overbought" Daily RSI...
Thanks a lot for the support.
Namaste.

bch breaking the channelevery thing is clear on chart
i set the targets on chart
and supply and demand is clear on chart
what is your idea?

Bitcoindescending Channel Breakout Confirmed recently 200 Sma Breakout done After 14 Months
Now Expecting Retest Of sma200 Incase Of successful Retest Expecting Test Of Descending Broadening Wedge trendline Test If Wedge Brokes Too Then Midterm Target Would Be 31k Then Final Target Would 50K
I would Recommend To Wait for Broadening Wedge Breakout Then Enter For targets 31k and 50k Further Will Updates In comment Section According Price Action

DINO Coins will OUTPREFORM BTC! (And no I don't like BCH)DINO Coins will OUTPREFORM BTC! (And no I don't like BCH but the Charts NEVER lie.)
Sitting above Daily 200 EMA with strong momentum still.
Euphoria is entering the market.
KEEP AN EYE ON DINOS!
This is the 3rd Example of 2x plays that can possibly play out by Mid FEB!
ENTRY:
100-125$ and HOLD
SL open or 25-30% of DCA Entry.
TP 1/8 50%
1/8 75%
1/2 100%
Remaining runner 150%
Signs why Below:
Buy above 4h 200 EMA
(With Smaller Bullish patterns)
Confirmed Breakout
(Look at RSI , Trendlines , Volume )
Look for catalyst News
(Anything that rehypes the shitcoin, or it's bluechip chain)
Buy SPOT ONLY and HODL!
Swing until 2x profit, or weakness. no SL but if needed a loss of 50% would be a SL
FIND THIS IN OTHER SHITCOINS AS WELL!
PLAY THEM ALL
BTW there is an order to this, I will not share it, you will need to DYOR.
but this is a prime example which will likely 2x by MID Feb

Bitcoin Cash important zones of buying and selling aggressionWhat price did you buy at or do you believe is the best buy for bitcoin cash?
I want to read your comment and discuss it in the community!

✴️ Bitcoin Cash Strong Breakout Is Only The BeginningA very strong breakout... Bitcoin Cash grew 30% in just 10 days... Here is the previous chart (2-Jan)
Looking at the weekly timeframe, this is only the beginning.
Last week BCHUSDT was still trading above EMA10, just this week it moved above this level, telling us that the bullish wave is just beginning.
EMA50 is sitting at 191 so we have a long way to go, up.
The next target is set at 150 for an additional 27% from the current price.
A peak for this wave can be hit at 189 for an additional 60%.
I say additional because we've been tracking this pair since it was at 100... Now we sit back, relax, watch and wait... With sell orders placed.
Namaste.

BCHUSD 30 % dump comingAs the bear market continues , the price can't break the resistance and it remains in the downtrend.
We expect 30 % dump before any significant bounce. If it happens BCH would drop to 75 $ which are lows from December 2018.
It also likely that we will see price lower than 75 $ in this bear market.
Any bounce probably will be a short lifted and the price eventually will go down.
Good luck

There are three types of triangle patterns: ascending, descendinHello, welcome to this Types of Three Triangle Pattern Update.
I have tried to bring the best possible outcome to this update
TRIANGLE PATTERN ANALYSIS:-
Symmetrical triangle; The symmetrical triangle follows a bullish trend, so watch carefully for a breakout below the ascending support line, which will signal a market reversal for a downtrend. The symmetrical triangle should be monitored for an upside breakout signal of a bullish market reversal.
A breakout from a symmetrical triangle is generally considered a strong indication of future trend direction that traders can follow with some confidence. Again, the triangle formation provides easy identification of appropriate stop-loss order levels – below the bottom of the triangle when buying, or above the triangle when selling short.
Ascending Triangle; Ascending Triangle Pattern
Because the ascending triangle is a bullish pattern, it’s important to pay close attention to the supporting ascension line because it indicates that bears are gradually exiting the market. Bulls (or buyers) are then capable of pushing security prices past the resistance level indicated by the flat top line of the triangle.
As a trader, it’s wise to be cautious about making trade entries before prices break above the resistance line because the pattern may fail to fully form or be violated by a move to the downside. There is less risk involved by waiting for the confirming breakout. Buyers can then reasonably place stop-loss orders below the low of the triangle pattern.
Descending Triangle; The descending triangle pattern is the exact opposite of the pattern we just discussed. This triangle pattern provides traders with a bearish signal, indicating that the price will continue to move lower as the pattern completes. Again, two trendlines form the pattern, but in this case, the bottom support line is flat, while the top resistance line is sloping down.
Which is formed in a downtrend. If it appears during a long-term uptrend, it is usually taken as a sign of a potential market reversal and trend change. However, each attempt to push the price up is less successful than the one before. , and eventually, the sellers take control of the market and push the price below the supporting lower line of the triangle. This action confirms the signal of the descending triangle pattern that prices are going down. Traders can sell short at the time of a downside breakout, with stop-loss orders placed slightly above the highest price during the formation of the triangle.
Hit the like button if you like it and share your charts in the comments section.
Thank you

Current waveIf the current wave can break through the previous ceiling area at $104.6, we can expect price growth to continue up to the ceiling of the main descending channel at $110.4. But if the price goes back below the $100 range due to selling pressure, a retest of the $95 support is likely. In general, in the daily time frame, we expect the range trend to continue.

✳️ Bitcoin Cash vs Bitcoin | Maximize Earnings PotentialHere we have Bitcoin Cash and an uptrend has already been set.
As many people say, all that is left is to follow the trend.
We can easily see 40% growth on the next bullish wave.
If you use bitcoin to buy BCHBTC and bitcoin grows, you do not lose out on anything...You get to earn from both, BCH and BTCs growth.
That's the beauty of the Altcoins vs Bitcoin pairs when both together rise in price... Your bitcoins are multiplied and at the same time these bitcoins value also rise.
Win-win-win.
For this, you need to trade/buy using BTC.
Namaste.

Bitcoin Deep analysis Lets analyz deeply
In Bigger Picture we can Clearly See Btc consolidating In Descending Broadening Wedge (Its bulish Pattern)
And if we look Closer Then we Have Descending Channel Too For bulish momentum Btc Needs to clear descending Channel,s Resistance (18800 to 19200)
Then we Have Another Resistance Is In Between (20800 to 21300) Area Once Btc Cleared Trendline Resistance Then Expecting Bulish rally Iat Least For Midterm
(Expecting Move towards 45k)
Keep In Mind Btc will Remain in downtrend Until descending Broadening Wedge,s breakout
In These analysis Ii discussed Technical Outlook according Price action)

BCHUSD Short
The long-term downward trend continues.
The initial targets derived from the "Head & Shoulders" pattern have been reached around $92.
At the moment there is an accumulation area in the form of a descending rectangle, which is likely to be broken down.
The next scenario I expect is that Bitcoin Cash will fall to $63-73 and either Double Bottom or Small Spring will be formed.

BCHUSDT Over All Moving In Descending Broadening Wedge
for Bulls Bch Needs To Break Both Black trendlines
Once Trendlines Got Cleared Can Expect Massive Bulish Moves
