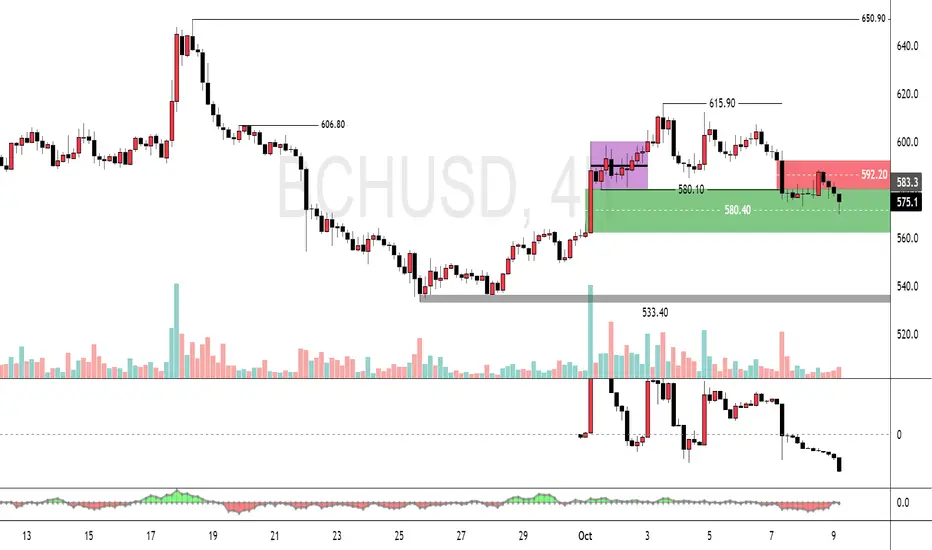
BCH Bulls on Thin Ice: Watch $580 CloselyFenzoFx—Bitcoin Cash dropped from $615.90, testing the bullish fair value gap as support. The 4-hour chart shows price respecting the bearish FVG mean threshold, while cumulative volume delta declines—signaling bearish pressure.
Immediate resistance is at $592.20. If selling continues, BCH may fill the bullish FVG down to $580.0. A break below $580.40 could open the path toward equal lows at $533.40. The bearish outlook remains valid unless BCH closes above $592.20.
Bchforecast
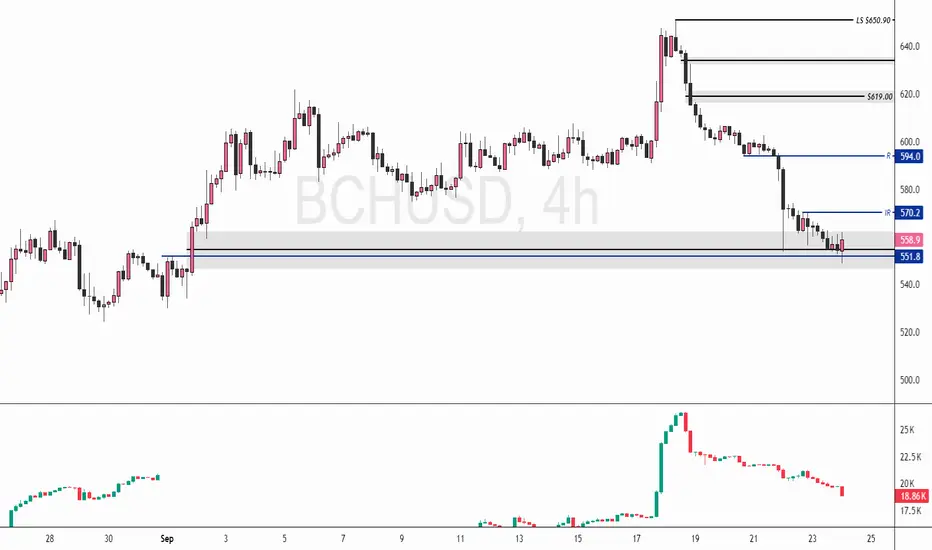
BCH: Cumulative Volume Delta Signals Potential UpsideFenzoFx—Bitcoin Cash (BCH) is consolidating within the bullish fair value gap, supported at $551.80 and trading at $560.00, up 0.48% today. Despite a new lower low, volume remains bullish, suggesting the current bearish momentum may be consolidation rather than a downtrend.
Immediate resistance is at $570.20. If price closes and stabilizes above this swing high, BCH/USD could form a bullish wave toward $594.00.
Bitcoin Cash Tests $528.3 as Double Top FormsBitcoin Cash faces resistance at $528.3, forming a double top and trading slightly below this level. Stochastic readings above 80.0 signal an overbought market, increasing the risk of a correction.
If BCH fails to break above $528.3, a pullback to $514.1 and $500.0 is likely, offering potential bullish re-entry zones. Alternatively, a confirmed breakout above $528.3 could pave the way toward the next supply area at $560.0.

BCH Faces Resistance at $500.0 Amid Bearish SignalsBitcoin Cash rose to $500.0, a resistance zone backed by the June 19 high. Stochastic reads 85.0, indicating short-term overpricing.
The 4-hour chart shows a possible double top pattern, suggesting consolidation. If BCH stays below $500.8, it could target $494.8 and, if selling continues, drop to $480.9.

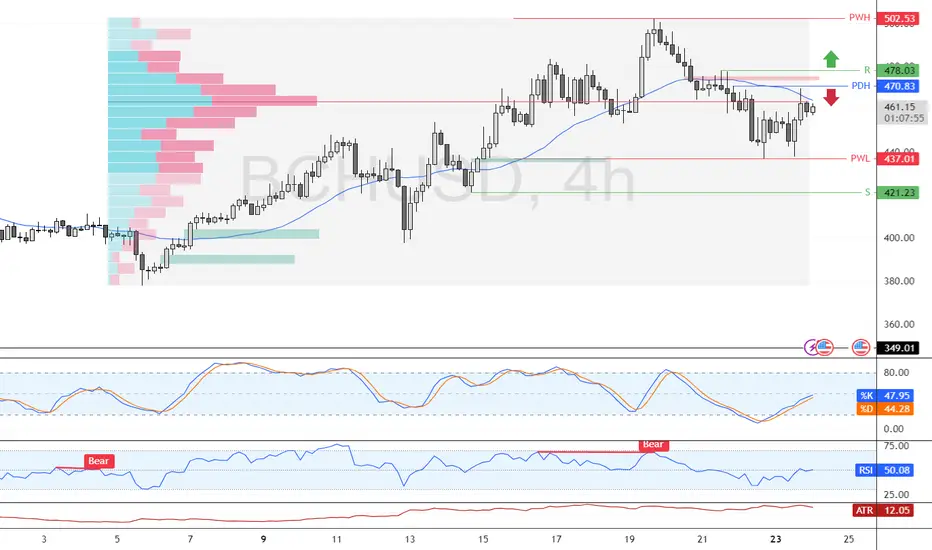
Bitcoin Cash Faces Pressure Below Key Resistance ZoneFenzoFx—Bitcoin Cash rose from $437.0 support, now trading near $461.3 and testing resistance backed by volume profile and the 50-period SMA.
If BCH stays below $470.8, bearish momentum may resume, targeting $437.0 and potentially $421.2. A bullish breakout could follow a close above $470.8, aiming for $478.0.
BCHUSDT 1W Where to sell Bitcoin Cash if the growth startsToday, we want to focus your attention on the global and maximum chart of the BCHUSDT trading pair
In August 2017, it was "a very hot summer": the alt season was in full swing, and there was also a BTC fork, as a result of which Bitcoin holders received free BCH 1:1. The same manipulation took place after during the fork of Bitcoin Gold - another sad fork coin.
After the fork, the BCHUSDT price soared to $4200-4400 on various exchanges.
And then the success story of BCH disappeared.
At the time when BTC during 2019-2021 was able to increase in price 20 times, the price of BCH could not even rise to half of the ATH indicator.
On November 15, 2018, the Bitcoin Cash blockchain was split (hard fork) into two branches — BCHABC and BCHSV.
There is also a lot of controversial information surrounding one of the biggest supporters and the organizer of the BCH fork - Roger Ver
In a word, we bypass such projects and do not trade it.
Now, about the chart
The 13th week of red candles and an uncorrected fall in the BCH price continues.
There is not much left to the absolute price minimum, in the area of $75.
We cannot recommend the purchase of this asset. At the moment, there are many different interesting projects for investment
If a miracle happens on the market and the price of BCHUSD does turn upwards , then on the graph we have shown where it would be good to sell off your BCH.
Here, each individual has to look at his deposit where he bought BCH and where it is profitable for him to sell.
Levels from above for sales: $250, $350, $550. The most positive and still weakly realistic forecast for the growth of the Bitcoin Cash price is $900
_______________________________
Since 2016 , we have been analyzing and trading the cryptocurrency market.
We transform our knowledge, trading moods and experience into ideas. Each "like under the idea" boosts the level of our happiness by 0.05%. If we help you to be calmer and richer - help us to be happier :)

#BCHUSDT looks prime for 500% Rally!Welcome to this quick BCH/USDT 1day analysis in the chart.
I have tried my best to bring the best possible outcome in this chart.
Reason of trade:-#BCH/USDT looks triangle pattern create and 500% Rally confirms and long term hold!
Entry:-$262
$317
Target:- 400% TO 500%
Stoploss:-$210
With leverage 3x to 5x
And long term hold and good profit 😉🙂😊✈️✈️
Q:-What do you think about this?
Do you think we will see a new ATH of BCH in the next quarter?
Share your views in the comment section.
Remember:-This is not a piece of financial advice. All investment made by me is under my own risk and I am held responsible for my own profit and losses. So, do your own research before investing in this trade.
Happy trading.
Sorry for my English it is not my native language.
Do hit the like button if you like it and share your charts in the comments section.
Thank you...

BItcoin Cash Midterm Analysis📊 BCHUSDT (Bitcoin Cash )
💹 Time Frame: Daily (Update)
➖➖➖➖➖➖➖➖
🟡 BCH is now trading near the S/R area of 350$. BCH has already broken the trend line and holding it well. You can build your position in BCH near the 370$ _ 400$ area but . The first resistance is $620 area
and the major resistance is $700-$720 area. The next good support is 260$_ 300$ area.
⚠ Use proper stops in trades as the market may become Volatilein the coming days.
💎 This analysis will be updated
Amir Hossein
📅 02.11.2022
⚠️ (DYOR)

BCH 1D Waiting for Bitcoin Cash at $20,000 and there is no typo)In our portfolio of ideas, a series of accurate predictions for the BCHUSDT pair have gathered, it's time to continue it)
In January 2021, we wrote about buying BCH at $380 and possible sales at $1200
Further in May, they wrote that growth to $1,700 is still possible, and this is what happened, after which the cryptocurrency market collapsed together.
The price of BCHUSD fell by -77% - a lot, but another thing is interesting, the fall was aggressively bought off twice from $380-400 .
That there is an aggressive buyer, we wrote in the previous ideas.
This combination of information suggests that the real bull run on the BCH chart is yet to come.
We think that below $400, buyers will not let the Bitcoin Cash price drop, that is, it is logical to try to gain longs with a grid on a spot in the $400-450 zone.
The first top targets are $1500-1650.
Correction to $750 and you can dream of moving towards ATH, which is close to $4000.
If the holders of 2017 say: $4000 is not enough for us - this is just our break-even point, but how can we make money?, We will say - it is not a problem)
For you, the market has the levels for growth of $12,000 and $20,000 , respectively)
We will take this global idea as a basis and as we grow, we will add additions to it.
Therefore, write a comment under the idea and put like for that you received update notifications in future
_______________________________
Since 2016, we have been analyzing and trading the cryptocurrency market.
We transform our knowledge, trading moods and experience into ideas. Each "like under the idea" boosts the level of our happiness by 0.05%. If we help you to be calmer and richer - help us to be happier :)

I ANALYZE FOR YOUR COMFORT - BITCOIN CASHI am looking for coins with growth possibilities today for your profit, and BCH is definitely one of them. With bullish formations in the cascade, with technical courses like the book, BCH has a strong long prediction for the rest of the day, so dear friends, let's take our profits.
If you appreciate my analysis please like and follow. If you want other tools analyzed, leave their names in the comments, and in the next hour I will publish the analysis. Everything on green !!

BCH 1D Previous goal achieved, which scenario is next?Almost 4 months have passed since the publication of the previous global BCHUSD idea.
It's time to take stock:
First, the price of BCHUSD dropped by -25%, giving a tasty purchase at $380 (the minimum was $370)
And then we had +300% growth when the goal reached $1215
In the end, you can check everything yourself by looking at the idea below.
And although BCH is called the most successful BTC fork, it still lacks the strength and enthusiasm to repeat the achievement of its father.
Since the price of BTCUSD has already tripled the maximum of the end of 2017, and in the meantime, the price of BCHUSDT was able to grow only by 30% from the maximum values of the end of 2017, which were about $4000 on different exchanges.
But as we noted in the previous idea, we think that Bitcoin Cash accumulated for 9 months for a reason last year and this growth is only the first bell.
It may be more fun further)
Although at first, a correction suggests itself - if the price of BCHUSDT is kept in the zone of $800-870 , then it will be very tasty for taking a long position with a target for growth to $1700
Write in the comments your opinions, what prospects await BitcoinCash
_______________________________
Since 2016 , we have been analyzing and trading the cryptocurrency market.
We transform our knowledge, trading moods and experience into ideas. Each "like under the idea" boosts the level of our happiness by 0.05%. If we help you to be calmer and richer - help us to be happier :)

BCH/USD TRIANGLE BCH is inside the D1 bullish channel. We can see the triangle formation. If we stay in the channel and breakout the descending line go LONG.

BCH reached strong resistance - BCH/USD entry levels - LONGBCH rocket was launched a little bit later than on BTC, but it is here. We reached an important resistance around $632. We are heading for a correction, but Bitcoin Cash is still bullish. You have several options to jump in.
ENTRY LEVELS BCH/USD LONG:
$532
$497
$466
If we break the price of $632, buy with a pullback but be careful.

BCH-4h. The price goes to the range of $ 257-268.The month on the BCH market passed in a wide consolidation range.
Buyers managed to barely update the previous high and give false hope to buyers to continue the trend.
Since December 21, the price has fallen by 25% virtually unhindered. The main volumes are concentrated within this consolidation in the range of $310-320 . Buyers have lost control of this range. If BTC does not break the $22,500 mark and goes to update the historical high - BCH buyers have a chance to regain control of $310-320 .
However, it is safest to buy a coin in the range of $257-268.
________________
We create both short-term ideas (for a local understanding of the market situation) and medium-term forecasts of price movements.
Subscribe to us and get daily concise analytics!

BCH. 3D. A break of $195 will open the way to $160.An old BTC fork showed great promise in 2017. When it was worth $4,000 , many predicted that sky-high growth would continue.
Now, BTH is trading around $225.
The volatility is low and it can be traded as a diversification asset.
From the level $195, the price has already been thrown up several times, but perhaps in order to sell more expensive.
If the price falls below $195, then the next target is below $160.
If everything is very bad on the crypto market, we would gladly buy this asset at $120.
_____________________________
Each " like under the idea" boosts the level of our happiness by 0.05% . If we help you to be calmer and richer - help us to be happier :)

BCH Bullish DivergenceTripple bottom formation on 1hr chart.
4hr chart is looking to make a turn around soon.
If this price rise happens, look to the 1D chart for a near drop in price possibly breaking $300 resistance.
Influx of volume today will confirm or cancel out this forecast.
______________________________________________________
Bitcoin and other cryptocurrencies are a very speculative investment and involves a high degree of risk. Investors must have the financial ability, sophistication/experience and willingness to bear the risks of an investment, and a potential total loss of their investment.
Information provided by King Midas is not intended to be, nor should it be construed or used as investment, tax or legal advice, a recommendation, or an offer to sell, or a solicitation of an offer to buy, an interest in cryptocurrency. An investment in cryptocurrency is not suitable for all investors.

BCH (Prj.2019.P01.E01).BCH looking goodObservations:
On the weekly chart, BCH has been performing well and has reached the main resistance.
If the candle stick open and closes above this resistance, then the trend is confirmed bullish. 21 EMA acting support.
On the daily chart, BCH has moved up while BTC has dropped. If BTC was to drop further, it will be unlikely BCH will continue in the upside.
On the 4 hourly chart, it has also reached the main resistance with RSI and stochastic RSI indicating its extended *above 70% and 80% with these indicators
Conclusion:
We need a min. of an open and close 4 hrly candle above this main resistance. Preferably on the daily candle to give the green light to enter (long)
4 HRLY Chart
Weekly Chart: 21 EMA acting support.

Free At Last!Broken out of Monthly downtrend Channel and on high volume,
Bullish Breakout seems legit and since it's on monthly timeframe, the move to upside must be significant.

BCH/BTC - retrace before continuation upwardsMy expectation for price action is indicated by the thin green and red arrows.
Blue triangle indicates the current range.
The large dotted green arrow indicates the overall trend.
Green box is buy.
Red box is sell.
Blue line indicates major support/resistance identified by the fib channels.
Green & Red lines indicate t/p.
Black dotted lines are fib retracements.
Thick white lines are fib channels.
The green arrow indicates the overall trend.
This is a log chart.
This is not financial advice. All charts shown on my page, including this one, are just for fun.
If you enjoy my ideas please give this post a like and follow my page if you would like to see future posts! :)

BCHABC: Bitcoin Cash ABC Descending Channel 50% !!BCHABC Trade Setup Buy Around 0.037000 and Sell 0.055000
You Can Also set Own Risk reward.
Let see what Will be Next Move.
Warning- I m Not a Financial Advisor this idea Only For Educational Purpose Only.
Thank You !!

All looks Good! Keep it simple.If the next candle (Day) turns out Green ABC will fly high upto 300-400 dollars
Wait for the signal !
Enjoy profitable trades :)
Remember , for validity there has to be a Green Candle (Day chart)
or else new pattern will follow.
Good luck
"Invest at your Risk"

BCH vs USD - Bitcoin Cash on the road to recoveryThe Bitcoin Cash market has slowly been recovering alongside BTC, lets take a look at the chart to get an idea of where we stand vs the Dollar.
We can see that the candles are making higher lows on the 4 hr candle chart.
This is a good place for the higher risk trader to get in on the action, stacking buy orders down into the $1260 support zone for quick gains on the way to $1300. Please note this is not advisable for the new trader, markets can change quickly.
The safer entry would be when markets consolidate above $1300 – $1360, providing we have good trading volume, this will be a good confirmation for the new bullish trend.
On the flip side should $1260 fail, we will most likely retest previous support at $1200 – $1000
Short term support is around $1200 and we have solid resistance above $1360, lets be patient while the bulls and the bears battle out.
Feel free to discuss this trade idea with me on Discord. Safe trades.
