BCHUSD H1 | Bullish Bounce Off Pullback SupportThe price is falling towards our buy entry level at 578.39, which is a pullback support that aligns with the 50% Fibonacci retracement.
Our stop loss is set at 561.98, which is a multi-swing low support.
Our take profit is set at 600.45, which is a multi swing high resistance.
High Risk Investment Warning
Stratos Markets Limited fxcm.com Stratos Europe Ltd fxcm.com
CFDs are complex instruments and come with a high risk of losing money rapidly due to leverage. 69% of retail investor accounts lose money when trading CFDs with this provider. You should consider whether you understand how CFDs work and whether you can afford to take the high risk of losing your money.
Stratos Global LLC fxcm.com Losses can exceed deposits.
Please be advised that the information presented on TradingView is provided to FXCM (‘Company’, ‘we’) by a third-party provider (‘TFA Global Pte Ltd’). Please be reminded that you are solely responsible for the trading decisions on your account. Any information and/or content is intended entirely for research, educational and informational purposes only and does not constitute investment or consultation advice or investment strategy. The information is not tailored to the investment needs of any specific person and therefore does not involve a consideration of any of the investment objectives, financial situation or needs of any viewer that may receive it. Past performance is not a reliable indicator of future results. Actual results may differ materially from those anticipated in forward-looking or past performance statements. We assume no liability as to the accuracy or completeness of any of the information and/or content provided herein and the Company cannot be held responsible for any omission, mistake nor for any loss or damage including without limitation to any loss of profit which may arise from reliance on any information supplied by TFA Global Pte Ltd.
Stratos Trading Pty. Limited fxcm.com
Trading FX/CFDs carries significant risks. FXCM AU (AFSL 309763), please read the Financial Services Guide, Product Disclosure Statement, Target Market Determination and Terms of Business at fxcm.com
BCHUSD

BCHUSD H4 | Bearish Drop OffThe price could rise to our sell entry level at 584.62, which is a pullback resistance.
Our stop loss is set at 607.01, which is a pullback resistance.
Our take profit is set at 563.43, which is a multi swing low support.
High Risk Investment Warning
Stratos Markets Limited fxcm.com Stratos Europe Ltd fxcm.com
CFDs are complex instruments and come with a high risk of losing money rapidly due to leverage. 69% of retail investor accounts lose money when trading CFDs with this provider. You should consider whether you understand how CFDs work and whether you can afford to take the high risk of losing your money.
Stratos Global LLC fxcm.com Losses can exceed deposits.
Please be advised that the information presented on TradingView is provided to FXCM (‘Company’, ‘we’) by a third-party provider (‘TFA Global Pte Ltd’). Please be reminded that you are solely responsible for the trading decisions on your account. Any information and/or content is intended entirely for research, educational and informational purposes only and does not constitute investment or consultation advice or investment strategy. The information is not tailored to the investment needs of any specific person and therefore does not involve a consideration of any of the investment objectives, financial situation or needs of any viewer that may receive it. Past performance is not a reliable indicator of future results. Actual results may differ materially from those anticipated in forward-looking or past performance statements. We assume no liability as to the accuracy or completeness of any of the information and/or content provided herein and the Company cannot be held responsible for any omission, mistake nor for any loss or damage including without limitation to any loss of profit which may arise from reliance on any information supplied by TFA Global Pte Ltd.
Stratos Trading Pty. Limited fxcm.com
Trading FX/CFDs carries significant risks. FXCM AU (AFSL 309763), please read the Financial Services Guide, Product Disclosure Statement, Target Market Determination and Terms of Business at fxcm.com

The Bitcoin Cash bull runBitcoin Cash began its bull run in June of 2023, we are currently only 20% of the way through the bull run.
I think the bull run will end around the end of 2026.
Long entry: 580 USD
Take profit: between 0,4 million and 2,4 million USD
In my opinion there is a high probability that it will reach between 1 and 2.5 million, 1.2 million could be a likely target.
This is my personal opinion and this is not a financial advice! Good trading!

BCHUSD H4 | Bearish Drop OffThe price has rejected our sell entry level at 592.22, which is a pullback resistance.
Our stop loss is set at 618.93, which is an overlap resistance.
Our take profit is set at 552.16, which is an overlap support.
High Risk Investment Warning
Stratos Markets Limited (fxcm.com/au), Stratos Europe Ltd (fxcm.com/au):
CFDs are complex instruments and come with a high risk of losing money rapidly due to leverage. 69% of retail investor accounts lose money when trading CFDs with this provider. You should consider whether you understand how CFDs work and whether you can afford to take the high risk of losing your money.
Stratos Global LLC (fxcm.com/en): Losses can exceed deposits.
Please be advised that the information presented on TradingView is provided to FXCM (‘Company’, ‘we’) by a third-party provider (‘TFA Global Pte Ltd’). Please be reminded that you are solely responsible for the trading decisions on your account. Any information and/or content is intended entirely for research, educational and informational purposes only and does not constitute investment or consultation advice or investment strategy. The information is not tailored to the investment needs of any specific person and therefore does not involve a consideration of any of the investment objectives, financial situation or needs of any viewer that may receive it. Past performance is not a reliable indicator of future results. Actual results may differ materially from those anticipated in forward-looking or past performance statements. We assume no liability as to the accuracy or completeness of any of the information and/or content provided herein and the Company cannot be held responsible for any omission, mistake nor for any loss or damage including without limitation to any loss of profit which may arise from reliance on any information supplied by TFA Global Pte Ltd.
Stratos Trading Pty. Limited (fxcm.com/au):
Trading FX/CFDs carries significant risks. FXCM AU (AFSL 309763), please read the Financial Services Guide, Product Disclosure Statement, Target Market Determination and Terms of Business at fxcm.com/au

Bitcoin Cash distribution underway (4H)As discussed in our previous analysis, we identified a bullish diametric structure on Bitcoin Cash. That structure has now fully matured, with the final leg — wave G — reaching completion. According to Elliott Wave and complex corrective behavior, the completion of wave G in a diametric often signals trend exhaustion, and at this stage the market typically transitions into a corrective or impulsive move in the opposite direction.
At the current price location, market structure suggests that BCH is preparing to form a bearish wave, rather than continuing higher. This expectation is not based on a single signal, but on confluence.
Trendline Break & Shift in Control
A short-term ascending trendline, marked clearly with a dashed line on the chart, has now been broken to the downside. This breakdown is important because it represents a loss of bullish momentum and confirms a shift in market control.
When price fails to respect a short-term trendline after completing a higher-degree structure (like a diametric), it often means that buyers are no longer willing to defend higher prices, while sellers are becoming increasingly aggressive. In simple terms:
➡️ Sellers are now stronger than buyers.
Market Maker Perspective – Why Price Moves Like This
From a market maker perspective, this behavior makes perfect sense. After completing wave G, price typically enters a zone where liquidity above the highs is harvested. Market makers often push price slightly higher or keep it ranging to:
Trigger late long entries
Run stop-losses above resistance
Create the illusion of continuation
Once sufficient liquidity is collected, price is then distributed and pushed lower. This is why we often see:
Fake breakouts
Slow grinding price action near highs
Sharp bearish moves after structure completion
In this case, the diametric completion combined with the trendline break strongly suggests that distribution has already occurred, and the market is now transitioning into the markdown phase.
Trade Execution – DCA Entries
We have identified two clear entry zones for this setup. Rather than entering with full size immediately, the plan is to scale into a sell/short position using DCA (Dollar Cost Averaging).
This approach:
Reduces emotional decision-making
Protects against short-term market maker wicks
Aligns with how smart money builds positions
Patience is key here. Market makers often attempt one last push to shake out early shorts before the real move begins.
Targets & Expectations
All targets are clearly marked on the chart for transparency and planning purposes. While intermediate targets exist, the primary target is the green zone, which represents:
A high-probability liquidity area
Structural support
A logical termination zone for the bearish leg
This area is where we expect profit-taking and potential reaction.
Invalidation Level – Risk Management First
No analysis is complete without a clear invalidation point.
If a daily candle closes above the invalidation level, this entire bearish scenario will be invalidated.
A daily close above that level would indicate:
The diametric structure is no longer respected
Market makers are targeting higher liquidity zones
Bias must be reassessed objectively
Until that happens, the bearish bias remains valid.
Final Notes for Traders
This setup is not about prediction — it’s about structure, liquidity, and behavior.
When structure completes, trendlines break, and liquidity aligns, the probabilities favor a directional move.
Trade with discipline, respect your invalidation, and remember:
Market makers move price to where the most pain exists — not where the crowd expects it.
BCHUSDT Is Providing Opportunity Only Smart Traders Will Catch Yello Paradisers! Are you watching this closely enough? Because #BCH respecting critical ascending support, and if you're not prepared, you might miss out on a huge opportunity. Additionally, we are seeing selling climax has been formed, a classic probability that institutional buyers are stepping in. This is where things start to get exciting.
💎#BCH overall structure is bullish on higher time frames and on retracement #BCH respecting the ascending support. Further the Relative Strength Index (RSI) is showing clear divergence, adding more weight to the bullish case.
💎#BCH holds momentum within the Fair value within the demand zone, the setup remains high probability targeting an initial upside move toward 645, a key moderate resistance and structural level.
💎#BCH formed selling climax, a bullish probability that confirms accumulation. During the retracement we saw a selling climax followed by a climactic action candle with ultra-high volume a textbook probability that smart money is loading up. Most importantly, if it breaks the above the upper trigger line of the selling climax (climactic action bar) with a momentum candle, these are the clearest probabilities that the big players are positioning for upside. If this momentum sustained, #BCH could climb toward 665, which is a major resistance to watch.
💎If #BCH fails to hold bullish momentum and a momentum candle closes below 561, the current bullish probability becomes invalid. In that case, we could see further downside pressure.
That is why Paradisers, we are playing it safe right now. If you want to be consistently profitable, you need to be extremely patient and always wait only for the best, highest probability trading opportunities only on confirmations.
MyCryptoParadise
iFeel the success🌴

BCHUSD H4 | Bearish BreakoutThe price is reacting off our sell entry level at 620.10, which is an overlap resistance.
Our stop loss is set at 660.37, which acts as a multi-swing high resistance.
Our take profit is set at 580.20, an overlap support.
High Risk Investment Warning
Stratos Markets Limited (

BCH/USD :: Trend Continuation Scenario in Play🔥 Title: BCH/USD 📈 Professional Bullish Swing Setup – Layered Entry Thief Strategy 🚀
🔔 Asset: Bitcoin Cash vs U.S. Dollar (BCH/USD) – CRYPTO MARKET
A high-probability Bullish pathway trade idea with multi-layer limit entries and technical confluence.
📊 Trade Plan — Structured & Strategic
Market Bias: Bullish confirmed with Hull Moving Average pullback validation + momentum structure forming higher lows.
Strategy Style: Thief Layered Limit Entries (multiple bull layers) using precise limit orders to scale in smoothly and reduce risk.
💡 Layered Entry Levels (suggested):
🎯 630 | 📍 640 | 🟢 650
➡️ Add more layers based on your risk management & market depth.
Entry Logic:
Multiple limit orders stacked to capture demand zone strength — aim to accumulate with discipline rather than chase.
🎯 Targets & Key Zones
🚀 Primary Target: 700 — psychological + technical resistance zone.
⚠️ Major resistance confluence likely near 700+ from volume profile & overbought signals.
💡 TIP: Take partial profits at earlier minor levels (e.g., 675, 690) to lock gains.
🛑 Risk Control
⚡ Stop-Loss Base: 620 (discipline zone)
Always adjust SL based on volatility & time frame — trade your plan, not my screen.
⚠️ Risk disclosure: This is guidance, not financial advice. YOU choose SL & TP based on YOUR risk comfort.
🔗 Correlation & Pairs Watchlist
Watch closely for correlated moves:
📌 BTC/USD – leads broad sentiment & liquidity moves
📌 ETH/USD – risk-on reference for alt strength
📌 XRP/USD – often shows early breakout continuation
Correlation Insight:
When BTC rallies or breaks key levels → BCH often follows with amplified volatility due to liquidity shifts and shared trader flows.
📈 Technical Signals & Clues
✔ Pullback to Hull MA indicates healthy correction
✔ Structure higher lows building demand base
✔ Volume inflow at key levels supports continuation bias
🌍 Fundamentals + Macro Drivers (London Time)
📌 Institutional adoption catalysts: Major bank filings for crypto ETFs (Bitcoin, Solana) signals deeper traditional finance entry, boosting sentiment across alts.
📌 Macro liquidity & regulation: Crypto markets in 2026 are shaped by clearer regulation and growing institutional flows, influencing asset allocation behaviors.
📌 Global crypto policy shifts:
– UK crypto regulatory proposals aim for clarity & investor protections.
– Italian financial review on crypto risk highlights macro prudential focus.
📌 Crypto vs macro environment:
Risk assets like BCH react to central bank policies (rates & liquidity). Lower rates or easing liquidity often support bullish moves in crypto.
📌 Market sentiment flashes: Leading players debate whether 2026 will sustain a bullish trend or stay range-bound — sentiment catalysts are hitting crypto each session.
🚀 Why This Is Not a Boring Idea
✅ Multi-layer strategy gives entry flexibility
✅ Includes macro + fundamental watch factors
✅ Designed for engagement (clarity + actionable steps + fun tone + emojis)
✅ Comparative market drivers explained for broader context
📣 Final Note to Traders:
Be adaptive — markets can surprise. If you take profit early on strength, that’s winning. If you tighten your stop after entry, that’s smart. Trade with discipline & evolve your style. 🚀📊

BCHUSD H4 | Bullish ContinuationThe price is reacting off our buy entry level at 620.10, which is a pullback support that aligns with the 61.8% Fibonacci retracement.
Our stop loss is set at 592.44, which is an overlap support.
Our take profit is set at 661.06, which is a swing high resistance.
High Risk Investment Warning
Stratos Markets Limited (

BCHUSD H1 | Bullish BounceThe price is falling towards our buy entry level at 621.76, which acts as a pullback support that is slightly below the 50% and the 38.2% Fibonacci retracement.
Our stop loss is set at 592.44, which is an overlap support.
Our take profit is set at 661.06, which is a swing high resistance.
High Risk Investment Warning
Stratos Markets Limited (

BCH - BOOOM ???CRYPTOCAP:BCH - Weekly Setup shared on 19th December...
MAGIC TWEET INCOMING??
YES
NO

BCH/USDT – Higher Timeframe Long ContinuationPrice has reclaimed a key HTF level and is holding above the previous resistance, now acting as support. Structure remains bullish, with price positioned for continuation toward higher liquidity levels.
Entry: 638.2
Stop Loss: 571.9
TP1: 705.9
Final TP: 802.2
Bias remains bullish as long as price holds above the support zone.
#BCH #BCHUSDT

BCHUSD H4 | Bullish Bounce Off Pullback SupportBased on te h4 chart analysis, we could see the price fall to our buy entry level at 577.67, which is a pullback support that lines up with the 78.6% Fibonacci retracement.
Our stop is set at 552.67, which is an overlap support.
Our take profit is set at 619.93, which is a multi swing high resistance.
High Risk Investment Warning
Stratos Markets Limited (

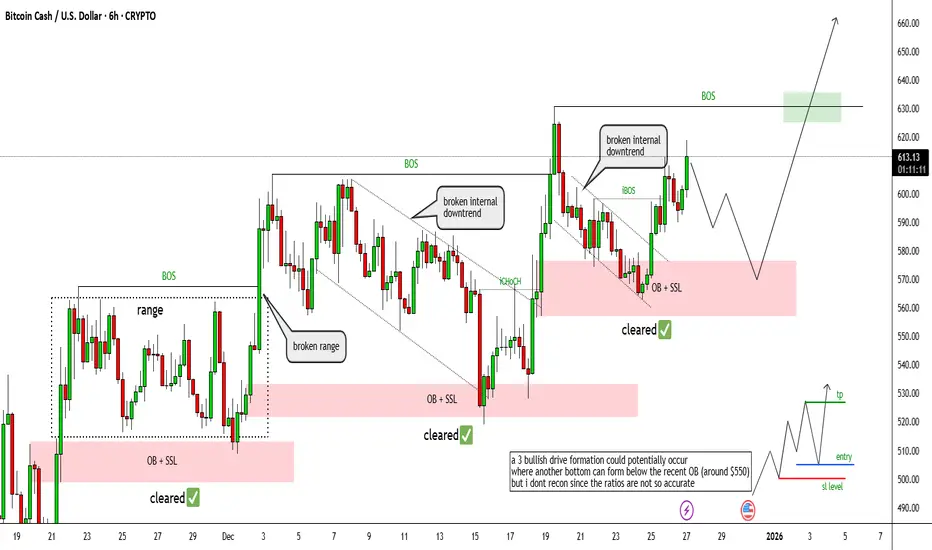
BCHUSD The Exact Blueprint For Late BuyersHello traders,
Bitcoincash broke a very strong downtrend earlier and we had a very good entry point at $527 (already 15% ahead so far)
So for late buyers, is it over? Not really imo. Here is my break down.
Price has made 2 major BOS in a 4HTF uptrend. That confirms the market intentions to push price higher. We trade where the overall structure flows.
I think the most recent OB and SSL has been swept. However, a not very common scenario can happen which is a 3 bullish drive formation. Where price can sweep deeper liquidity around $550 then push higher.
If you are a late buyer, set a buy limit order @$550, $570 and wish for the best.
But what if price didn't retract that much? Take your buy orders @$630 AFTER a clear BOS & retest of support zone. I repeat... AFTER a break & retest.
That is your blueprint for this BCH move.
Good Luck!
All our analysis is shared with honesty, care, and real effort. If you find value in it, a like or comment means a lot to show your support🙏📊
Bitcoin Cash Aligns With Broader Crypto Upside Momentum🚨 BCH/USD CRYPTO PROFIT PATHWAY SETUP 🎯 | Bitcoin Cash Bull Trap Escape Strategy
💰 ASSET: BCH/USD (Bitcoin Cash vs U.S. Dollar)
Market: CRYPTO | Strategy Type: SWING TRADE | Plan: 📈 BULLISH
📊 CURRENT MARKET DATA (Real-Time Verified)
Current Price: $614.41 USD
24H Volume: $365.33M USD
Market Cap Rank: #11
24H Change: +1.49%
YTD Performance: +35% (Strong Bullish Momentum)
🎯 "THIEF STRATEGY" - LAYERED ENTRY SYSTEM
💎 Entry Zones (Layer Your Positions):
The "Thief Strategy" uses multiple limit orders to scale into positions strategically:
Layer 1: Entry @ $560 (20% of position)
Layer 2: Entry @ $580 (25% of position)
Layer 3: Entry @ $600 (30% of position)
Layer 4: Entry @ $610 (25% of position)
💡 Alternative: Market entry at ANY PRICE LEVEL for aggressive traders (current: ~$614)
⚠️ Note for Thief OG's: You can adjust layers and increase entry points based on your own risk tolerance and capital allocation strategy.
🛑 STOP LOSS MANAGEMENT
Thief's SL: @ $550
⚡ CRITICAL REMINDER - Dear Ladies & Gentlemen (Thief OG's):
This is MY stop loss based on MY strategy
Adjust YOUR stop loss according to YOUR risk management rules
Consider your position sizing and portfolio allocation
This is NOT a recommendation—it's reference data
YOUR money = YOUR decisions = YOUR risk
🎖️ TARGET: POLICE FORCE RESISTANCE ZONE
Primary Target: @ $690 🚀
📈 Why $690?
✅ POLICE FORCE acts as strong resistance + oversold bounce zone
✅ Historical correlation support at this level
✅ Accumulation zone before potential breakout
✅ Smart money trap escape point
⚠️ CRITICAL REMINDER - Dear Ladies & Gentlemen (Thief OG's):
This is MY take profit target based on MY analysis
Set YOUR targets according to YOUR trading plan
Scale out at multiple levels if preferred
Take profits when YOU are comfortable
NOT a recommendation—trade at YOUR own risk
🔗 CORRELATED PAIRS TO WATCH
Monitor these pairs for market correlation and confirmation signals:
Primary Correlations:
BTC/USD - Current: $87,900.93 | BCH follows Bitcoin's macro direction
ETH/USD - Current: $2,936.87 | Layer-1 competition indicator
BCH/BTC - Direct correlation ratio tracking
Key Correlation Points:
BCH hashrate above 7.71 EH/s (above 2017 peak) = Network strength confirmation
Bitcoin correlation shows BCH experiencing 61,561% liquidation imbalance, suggesting price decoupling potential
Watch Bitcoin dominance levels—currently at 59.5%
🔥 FUNDAMENTAL & ECONOMIC FACTORS (Latest Updates)
✅ Recent Bullish Catalysts:
1. Major Technology Upgrades (2025):
NEAR Integration (Dec 23, 2025) - Cross-chain swaps with 120+ assets across 25+ chains
Cashinals Launch (Dec 18, 2025) - BCH-20 token standard debuts, expanding NFT ecosystem
May 2025: VM Limits & BigInt Support activated - enabling Ethereum-like smart contracts
2. Network Strength Indicators:
Hashrate at 7.71 EH/s, surpassing 2017 peak
Circulating supply: 19,972,656 BCH (approaching 21M max supply)
Over 2,550 merchants now accepting BCH
3. Institutional & Whale Activity:
Whale Activity Peaks (Dec 24, 2025) - Record transaction sizes signal accumulation
$482M moved by large holders in July 2025
Grayscale's rumored BCH ETF filing
4. Technical Price Action:
Confirmed double bottom pattern near $300 region
BCH testing critical $600 zone for breakout to $800-$1,000
Strong buy signal on technical indicators
📅 Upcoming Events to Monitor:
2026: Quantum-resistant cryptography development
2026: Enhanced VM Limits & BigInt CHIPs for DeFi integration
Ongoing: Cross-chain liquidity expansion via NEAR Protocol
⚡ KEY RESISTANCE & SUPPORT LEVELS
Immediate Resistance:
R1: $620-$630 (Current test zone)
R2: $650 (Breakthrough target)
R3: $680-$690 (Major resistance—TARGET)
R4: $800-$1,000 (Extended targets)
Support Levels:
S1: $580-$600 (Strong buyer accumulation)
S2: $560 (Layer entry zone)
S3: $520-$560 (Pullback cushion)
S4: $445-$450 (50W-EMA support)
📊 PRICE PREDICTIONS & ANALYST CONSENSUS
2025 Outlook:
Bullish scenario: BCH could reach $701 with increased hype
Bearish scenario: Support around $450-$507
Year-end target: Potential $799
Medium-Term (2026-2027):
2026 maximum: $1,160
Bullish targets: $1,200-$1,597 by end 2025/early 2026
Potential retest of $4,300 ATH if smart money accumulates
🎯 TRADING STRATEGY SUMMARY
Setup Type: Swing Trade (Multi-day to Multi-week hold)
Risk Level: Medium-High (Crypto volatility)
R:R Ratio: Approximately 1:2.5 (depending on entry)
Timeframe: Daily/4H chart focus
Strategy: Layered entry + correlation monitoring + fundamental backing
📱 FOLLOW FOR MORE SETUPS
If this analysis helps YOUR trading journey, smash that 👍 and follow for more Profit Pathway Setups!
Drop a 🔥 if you're entering this trade!
Thief Strategy Squad: Make money, manage risk, escape the trap! 🏃♂️💨
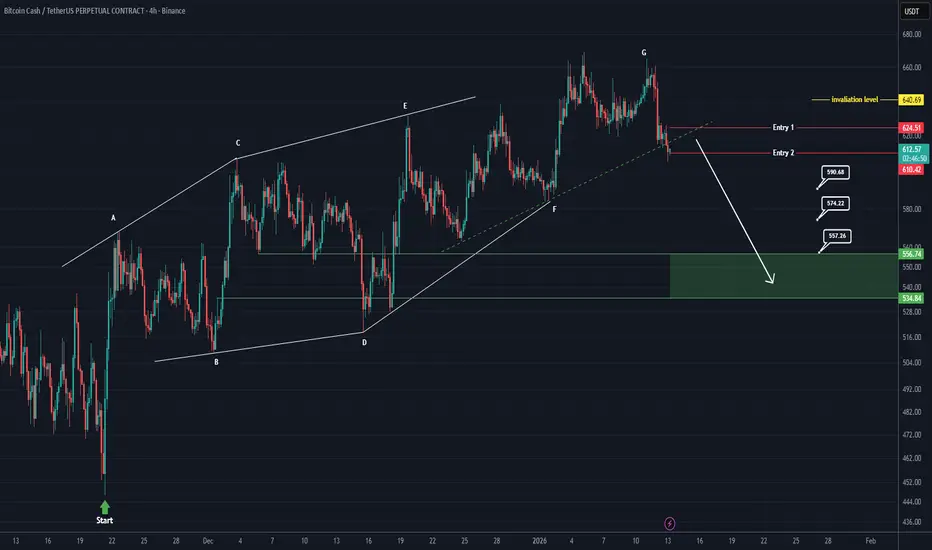
BITCOIN CASH Analysis (4H)From the point marked with the green arrow on the chart, Bitcoin Cash has formed a bullish diametric pattern. At this stage, wave E of the diametric appears to be completed, and price has entered wave F.
We have identified two entry zones on the chart, where positions should be built using a DCA strategy.
The targets for wave G have been clearly marked on the chart.
A daily candle close below the invalidation level will invalidate this scenario.
For risk management, please don't forget stop loss and capital management
When we reach the first target, save some profit and then change the stop to entry
Comment if you have any questions
Thank You

BCH Buy/Long Signal (4H)The structure of Bitcoin Cash is bullish and it continues to form higher highs and higher lows.
Each bullish wave in this fractal moves more than 1 percent and the previous lows are not taken. We expect the same behavior this time as well with the price rising at least 19 percent.
Therefore buy or long positions can be considered at the support levels of the previous wave.
The targets are marked on the chart.
Do not enter the position without capital management and stop setting
Comment if you have any questions
thank you

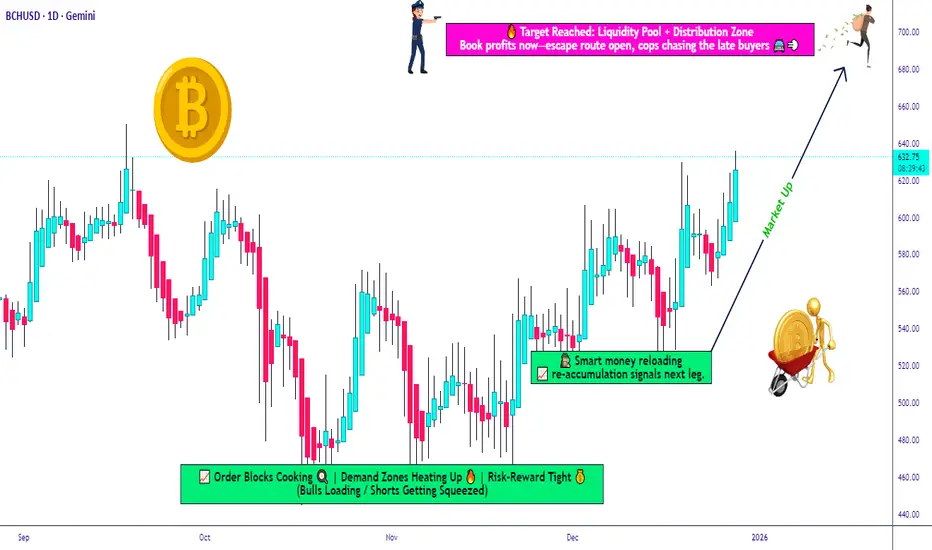
BCH: $700–$800 Before the Next Bear MarketBCH Macro Resistance Before Bear Market
Based on historical price structure, Bitcoin Cash (BCH) appears to be approaching a macro resistance zone around $700–$800 , which has previously marked the final upside before major bear markets.
In 2018 and 2022, BCH followed a very similar pattern:
A prolonged accumulation phase
A strong push into a horizontal resistance zone
A rejection from that zone, followed by a deep bear market decline
The current structure closely mirrors those past cycles. Price is once again testing the same historical supply zone, where sellers previously stepped in aggressively.
Key idea:
I expect BCH to reach the $700–$800 range
This level could act as the last distribution zone before the broader market transitions into a new bear market phase
This is not a short-term trade idea, but a macro perspective based on repeating market behavior and long-term resistance reactions.
⚠️ As always, confirmation is needed, and this scenario is invalidated i f price accepts and holds above the resistance zone.

BCHUSD Wants to Run Drawn a large broadening structure allowing the formation of the next bull move up to the upper line.
ALT SEASON ?
Weekly chart

BCHI expect Bitcoin Cash to make a 25% correction from this level. This is the first flag, and it may not correct here and instead wait for the second flag, then pull back to the level I’ve marked.
The analysis is based on a strategy called NDS.

BCH Sell/Short Signal (1H)Add this symbol to your watchlist and enter the position once it reaches the entry zone.
Considering that BCH is in a bearish structure on the hourly timeframes, we are looking for sell/short opportunities at order blocks and origin zones.
We have identified two targets. At the first target, secure partial profits and then move the position to break-even.
Do not enter the position without capital management and stop setting
Comment if you have any questions
thank you

BCHUSD Potential path ways - {15/12/2025}Educational Analysis says that BCHUSD (Crypto Pair) may give trend Trading opportunities from this range, according to my technical analysis.
Broker - Bitstamp
So, my analysis is based on a top-down approach from weekly to trend range to internal trend range.
So my analysis comprises of two structures: 1) Break of structure on weekly range and 2) Trading Range to fill the remaining fair value gap
Let's see what this Crypto Pair brings to the table for us in the future.
DISCLAIMER:-
This is not an entry signal. THIS IS FOR EDUCATIONAL PURPOSES ONLY.
I HAVE NO CONCERNS WITH YOUR PROFITS OR LOSS,
Happy Trading,
FX Pairs & Crypto Curreny Trade Analysis.
My Analysis is:-
Short term trend may be go to the external demand zone.
Long term trend breaks the new high after going from discount zone.

Is BCH/USDT Setting Up a Downside Swing? Structure Explained🔻 BCH/USDT – Crypto Market Opportunity Blueprint (Swing Trade)
“Bitcoin Cash vs Tether: Bearish Structure in Focus”
📉 Trade Outlook
The bearish plan has been confirmed following a decisive weighted moving average dynamic-support breakdown, signaling potential downside momentum.
📌 Entry
You may enter at any price level that aligns with your trading framework and confirmation signals.
🛑 Stop-Loss (SL)
This setup uses a reference SL @ 520.0.
Dear Ladies & Gentleman (Thief OG’s), adjust your stop-loss according to your strategy, your confirmation, and your risk appetite.
Place the SL only after the breakout confirmation.
Note: This SL is not a recommendation. Manage your trade independently and execute based on your own risk tolerance.
🎯 Target (TP)
The moving average currently acts as a strong resistance zone, combined with overbought conditions + a potential trap setup.
Our reference target stands at 460.0 — lock in profits if the structure moves in your favor.
Note: This TP is also not mandatory. Choose your own exit based on your analysis and risk preferences.
📚 Market Structure Breakdown
Dynamic support has clearly failed → signals bearish momentum
Price retesting lower MA zones indicates weak bullish pressure
Volume profile confirming seller strength
Structure favors downside continuation if resistance holds
🔍 Related Pairs to Watch (Correlation Insights)
1. BITSTAMP:BTCUSD (Bitcoin)
BCH often mirrors BTC’s broader trend.
If BTC breaks key support levels, it can amplify downside on BCH.
Watch for MA rejections or liquidity grab zones.
2. BITSTAMP:ETHUSD (Ethereum)
ETH weakness frequently leads to crypto-wide risk-off sentiment.
ETH/BTC ratio drop usually pressures altcoins, including BCH.
3. COINBASE:LTCUSD (Litecoin)
A close competitor to BCH with similar structure behavior.
If LTC forms bearish MA crossovers or loses trendline support, BCH weakness can follow.
4. BINANCE:BNBUSDT (Binance Coin)
BNB drives exchange-based flows.
Increased selling in BNB can trigger broader altcoin corrections, hinting at BCH continuation.
5. BINANCE:BCHBTC (Bitcoin Cash vs Bitcoin)
Direct correlation indicator.
A falling BCHBTC pair signals relative weakness, strengthening the bearish case.
📌 Final Notes
This blueprint provides a structured guide for your analysis — but execution, SL, TP, and risk remain your personal decision.
Trade safe, stay disciplined, and follow your confirmation signals.
