BCHUSD Wants to Run Drawn a large broadening structure allowing the formation of the next bull move up to the upper line.
ALT SEASON ?
Weekly chart
BCHUSD

BCHI expect Bitcoin Cash to make a 25% correction from this level. This is the first flag, and it may not correct here and instead wait for the second flag, then pull back to the level I’ve marked.
The analysis is based on a strategy called NDS.

BCH Sell/Short Signal (1H)Add this symbol to your watchlist and enter the position once it reaches the entry zone.
Considering that BCH is in a bearish structure on the hourly timeframes, we are looking for sell/short opportunities at order blocks and origin zones.
We have identified two targets. At the first target, secure partial profits and then move the position to break-even.
Do not enter the position without capital management and stop setting
Comment if you have any questions
thank you

BCHUSD Potential path ways - {15/12/2025}Educational Analysis says that BCHUSD (Crypto Pair) may give trend Trading opportunities from this range, according to my technical analysis.
Broker - Bitstamp
So, my analysis is based on a top-down approach from weekly to trend range to internal trend range.
So my analysis comprises of two structures: 1) Break of structure on weekly range and 2) Trading Range to fill the remaining fair value gap
Let's see what this Crypto Pair brings to the table for us in the future.
DISCLAIMER:-
This is not an entry signal. THIS IS FOR EDUCATIONAL PURPOSES ONLY.
I HAVE NO CONCERNS WITH YOUR PROFITS OR LOSS,
Happy Trading,
FX Pairs & Crypto Curreny Trade Analysis.
My Analysis is:-
Short term trend may be go to the external demand zone.
Long term trend breaks the new high after going from discount zone.

Is BCH/USDT Setting Up a Downside Swing? Structure Explained🔻 BCH/USDT – Crypto Market Opportunity Blueprint (Swing Trade)
“Bitcoin Cash vs Tether: Bearish Structure in Focus”
📉 Trade Outlook
The bearish plan has been confirmed following a decisive weighted moving average dynamic-support breakdown, signaling potential downside momentum.
📌 Entry
You may enter at any price level that aligns with your trading framework and confirmation signals.
🛑 Stop-Loss (SL)
This setup uses a reference SL @ 520.0.
Dear Ladies & Gentleman (Thief OG’s), adjust your stop-loss according to your strategy, your confirmation, and your risk appetite.
Place the SL only after the breakout confirmation.
Note: This SL is not a recommendation. Manage your trade independently and execute based on your own risk tolerance.
🎯 Target (TP)
The moving average currently acts as a strong resistance zone, combined with overbought conditions + a potential trap setup.
Our reference target stands at 460.0 — lock in profits if the structure moves in your favor.
Note: This TP is also not mandatory. Choose your own exit based on your analysis and risk preferences.
📚 Market Structure Breakdown
Dynamic support has clearly failed → signals bearish momentum
Price retesting lower MA zones indicates weak bullish pressure
Volume profile confirming seller strength
Structure favors downside continuation if resistance holds
🔍 Related Pairs to Watch (Correlation Insights)
1. BITSTAMP:BTCUSD (Bitcoin)
BCH often mirrors BTC’s broader trend.
If BTC breaks key support levels, it can amplify downside on BCH.
Watch for MA rejections or liquidity grab zones.
2. BITSTAMP:ETHUSD (Ethereum)
ETH weakness frequently leads to crypto-wide risk-off sentiment.
ETH/BTC ratio drop usually pressures altcoins, including BCH.
3. COINBASE:LTCUSD (Litecoin)
A close competitor to BCH with similar structure behavior.
If LTC forms bearish MA crossovers or loses trendline support, BCH weakness can follow.
4. BINANCE:BNBUSDT (Binance Coin)
BNB drives exchange-based flows.
Increased selling in BNB can trigger broader altcoin corrections, hinting at BCH continuation.
5. BINANCE:BCHBTC (Bitcoin Cash vs Bitcoin)
Direct correlation indicator.
A falling BCHBTC pair signals relative weakness, strengthening the bearish case.
📌 Final Notes
This blueprint provides a structured guide for your analysis — but execution, SL, TP, and risk remain your personal decision.
Trade safe, stay disciplined, and follow your confirmation signals.

8 Years Break ? Bitcoin Cash $BCH ! 1. The Resistance Line (The "Bear" Trend)
The descending trendline (top line) connects the major peaks:
Point 1 (Dec 2017): The All-Time High / Cycle Top.
Point 2 (2021): The mid-cycle peak.
Points 3 & 4 (2024-2025): Recent lower highs where sellers stepped in.
Significance: Every time the price touched this line previously, it was rejected forcefully. This created a sequence of Lower Highs, indicating selling pressure.
2. The Support Line (The "Bull" Trend)
The ascending trendline (bottom line) connects the major lows:
2018 Lows: The bear market bottom.
2022/2023 Lows: The accumulation phase post-FTX crash.
Significance: The market established a sequence of Higher Lows, indicating that buyers are stepping in at increasingly higher prices over the long term.
The Breakout Zone: Point 5
Point 5 represents the apex of this multi-year compression.
The Breakout: The chart indicates that BCH has pierced the long-term descending resistance line (around the $450-$500 zone).
Current Price Action ($566.28): The current price is trading above the breakout trendline. This is technically a bullish confirmation. The price action immediately following Point 5 looks like a "backtest" or "consolidation," where the previous resistance is being tested as new support.
Projections and Targets
The chart features a large upward arrow projecting a parabolic move. Here are the technical targets based on this structure:
Intermediate Resistance: The first major hurdles are likely the previous swing highs around $700, followed by the 2021 highs around $1,600.
The "Measured Move" (Macro Target): The horizontal dotted line at the top of the chart sits at $4,338.94.
This target likely corresponds to a retest of the 2017 All-Time Highs.
In T.A., the target of a triangle breakout is often calculated by measuring the height of the back of the triangle (2017-2019 range) and projecting it from the breakout point. This calculation aligns with the arrow pointing toward the $3,000 - $4,500 region.
This is a classic "volatility compression" play. The chart suggests that the long "crypto winter" for BCH is ending. The break of the 8-year downtrend line is the most significant technical event on this chart.

BCH/USD Breakout Opportunity! MA Compression Signals Expansion📈 BCH/USD — BITCOIN CASH vs USD | Crypto Market Profit Pathway (Swing Trade)
🧭 PLAN (Bullish Setup)
BCH is showing a triangular moving-average breakout, confirming bullish momentum on swing-trade structure.
For this setup, the Thief Layering Entry Strategy is applied — stacking limit orders to capture premium entries during volatility.
🎯 ENTRY (Layering Method)
Thief layer entries placed at:
👉 $510 | $520 | $530 | $540
(Traders may increase layers based on their own liquidity distribution and volatility tolerance.)
This layered approach helps reduce timing pressure while averaging into strength — a classic “build position while the market sleeps” tactic.
🛑 STOP-LOSS (Risk Layer)
Thief SL: $480
Dear Ladies & Gentlemen (Thief OG’s), you are free to adjust your SL according to:
✔ Your risk model
✔ Account size
✔ Market volatility
I’m NOT recommending you rely only on my SL — operate at your own comfort level.
🎯 TARGET (Exit & Escape Plan)
Market shows overbought confluence + resistance trap zone + correlation alerts.
Police are waiting at our resistance zone, so escape with profits at:
👉 TP: $620
Again, dear Thief OG’s — take profit at your own discretion. Extract money and run at your own risk management.
🔍 RELATED PAIRS TO WATCH (Correlation Guide)
1️⃣ BITSTAMP:BTCUSD — Bitcoin
BCH often follows BTC directional momentum.
A strong BTC breakout continues boosting BCH liquidity flows.
If BTC stalls at resistance, BCH upside momentum may slow.
2️⃣ BITSTAMP:ETHUSD — Ethereum
ETH strength normally increases altcoin confidence.
When ETH volatility expands, BCH tends to attract short-term speculative inflows.
3️⃣ COINBASE:LTCUSD — Litecoin
LTC and BCH share similar “digital payment” narratives.
High correlation in mid-cap crypto momentum cycles.
4️⃣ BINANCE:BNBUSD — Binance Coin
Strong BNB rallies usually signal broader altcoin rotation.
Useful to confirm if altcoin capital is expanding or contracting.
5️⃣ BINANCE:BCHBTC — Relative Strength Chart
Key chart to gauge whether BCH is outperforming Bitcoin or simply following.
Breakout in BCH/BTC = higher conviction for BCH/USD long positions.
🧠 WHY THESE CORRELATIONS MATTER
✔ Bitcoin sets overall market tone
✔ Ethereum influences altcoin confidence
✔ Mid-cap correlations confirm sector strength
✔ BCH/BTC ratio reveals relative performance
✔ Cross-asset rotation helps anticipate reversals early
This gives you a multi-angle confirmation structure — not just trading BCH, but understanding the flow behind the move.

#BCHUSDT — Weekly OutlookBCH has officially broken out of its multi-month descending trendline, and more importantly, we now have a clean confirmation:
a retest of the trendline followed by a strong bullish weekly candle closing back above it.
This is exactly the kind of structure you want to see after a breakout.
🔹 Key Points
✅ Breakout + Confirmation (trendline broken and retested)
✅ Holding above the 50% Fib ($453)
✅ Strong weekly momentum building
✅ Market structure shifting from compression → expansion
As long as BCH keeps closing above the $520–$540 zone, the bullish continuation scenario remains valid.
🔹 Targets
🎯 $680–$720 (first major liquidity pocket)
🎯 $900–$920 (macro resistance + ~78.6% Fib)
🔹 Invalidation
A weekly close back under $499 would weaken the structure and re-open the lower range.

BCHUSD Breaks a 2 months Downtrend — What's next?When a pair breaks clean out of a 2 months downtrend, this kind of structure is often the first signal of a major trend shift. That happens while BTC has been in a massive selling and extreme fear phase.
Price has pushed above the descending trendline that has been capping BCH for 2 months now.
This breakout shows buyers interest of pushing the price higher.
If BCH holds above this grey block, it confirms the breakout and adds a strong belief into a bullish continuation. As of right now, price is hovering around this zone and im expecting a retest soon.
OBV is usually an underrated indicator. It shows you where accumulation starts to happen and when volume starts to rise even if price is -still- not following. Its a great forecasting indicator.
I'm very bullish on BCH and here are my targets.
• TP1: $610
• TP2: $710
• TP3: $804
• TP4: $+1000
• SL: Daily close below $433
Good Luck!

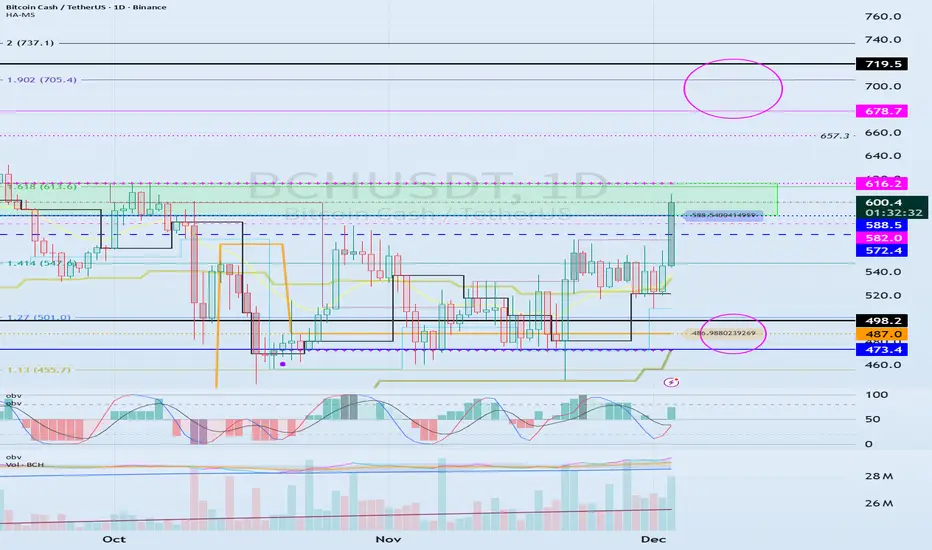
The key is whether it can break above 588.5-616.2
Hello, traders!
Follow us to get the latest information quickly.
Have a great day.
-------------------------------------
(BCHUSDT 1D chart)
The 1D chart is rising towards the HA-High ~ DOM (60) range, raising expectations for a bullish trend.
Accordingly, the key question is whether the 588.5-616.2 range can be supported and the price can rise.
If it rises, we should examine whether it can break above the 678.7-719.5 range, which is the range formed by the DOM (60) indicator on the 1M chart and the previous high.
To continue the uptrend by breaking above key points or ranges, the StochRSI, TC, and OBV indicators must show upward trends.
If possible,
- The StochRSI indicator should not have entered an overbought zone.
- The TC indicator should remain above zero.
- The OBV indicator should remain above the High Line.
Therefore, we should examine the movements of the StochRSI, TC, and OBV indicators when the price rises above the DOM (60) indicator.
If the StochRSI falls below 80, it's considered a stop loss, as further declines are likely.
-
Thank you for reading.
We wish you successful trading.
--------------------------------------------------
FireHoseReel | BCH: Ready to Shock the Market ?🔥 Welcome To FireHoseReel !
Let's dive into the BCH ( BitcoinCash ) 4H analysis .
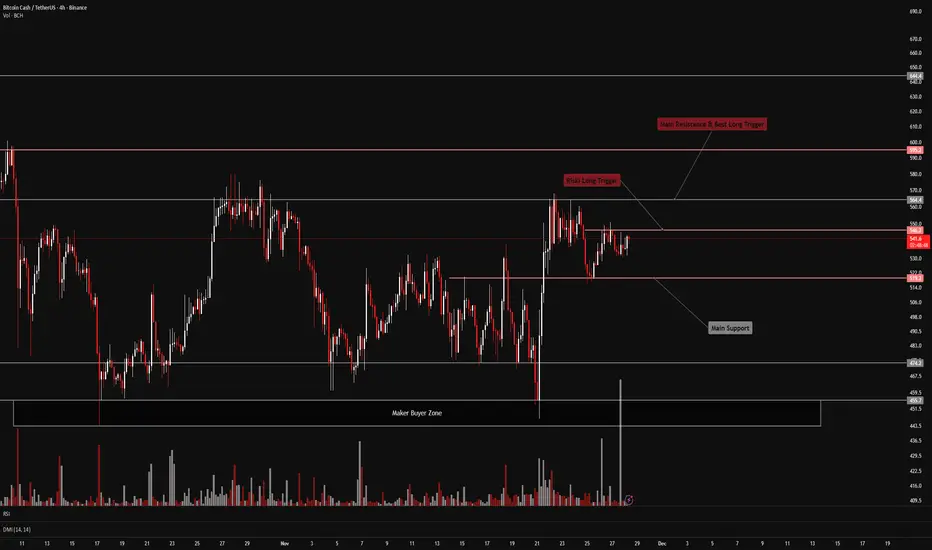
👀 Bitcoin Cash (BCH) – Market Structure Overview
After reacting strongly from the major buyer zone, Bitcoin Cash pushed higher and attacked the $564 resistance directly.
Price then faced rejection at this level and entered a multi-timeframe corrective phase. During this correction, sell volume declined, and in the most recent 4-hour candles, buy volume has increased noticeably.
BCH has now formed an early long trigger around $546.
If this level breaks with multi-timeframe confirmation, we can look for early long positions, anticipating a future breakout above $564.
📊 Volume Is the Key Signal
Pay close attention to BCH volume — volume is more important than price here.
Right now, after price reached the $546 resistance zone, we’re seeing a strong surge in buy volume that hasn’t appeared for several days.
This behavior can be an early signal of a trend shift and the potential start of another bullish rally.
✔️ BCH/BTC Additional Market Perspective Looking at the BCH/BTC pair, price has moved upward very smoothly and is currently in a corrective phase.
The support and resistance levels that generate entry triggers are clearly defined — and these levels align perfectly with the BCH/USDT pair.
Early trigger: 0.005961
Safer trigger: 0.0062
These levels can be used for multi-pair confirmation.
📌 Trading Scenarios for Bitcoin Cash
You can review the following scenarios alongside your own strategy:
🟢 Long Scenario
A breakout above the $546 high, supported by rising buy volume, can offer a solid early long setup.
This setup is mainly for front-running the main breakout with lower initial risk.
If BCH later breaks and confirms above the stronger resistance at $564, we can safely add more size to existing long positions.
🔴 Short Scenario
Since the BCH/BTC pair is currently in a strong bullish structure, I do not expect a deep correction for Bitcoin Cash at this stage.
Therefore, short setups are not preferred in the current market context.
🛞 Risk Management & Disclaimer
Please remember to always use proper risk management and position sizing. Nothing in this analysis is financial advice. The market can change quickly, so always trade based on your own strategy, research, and risk tolerance. You are fully responsible for your own trades.
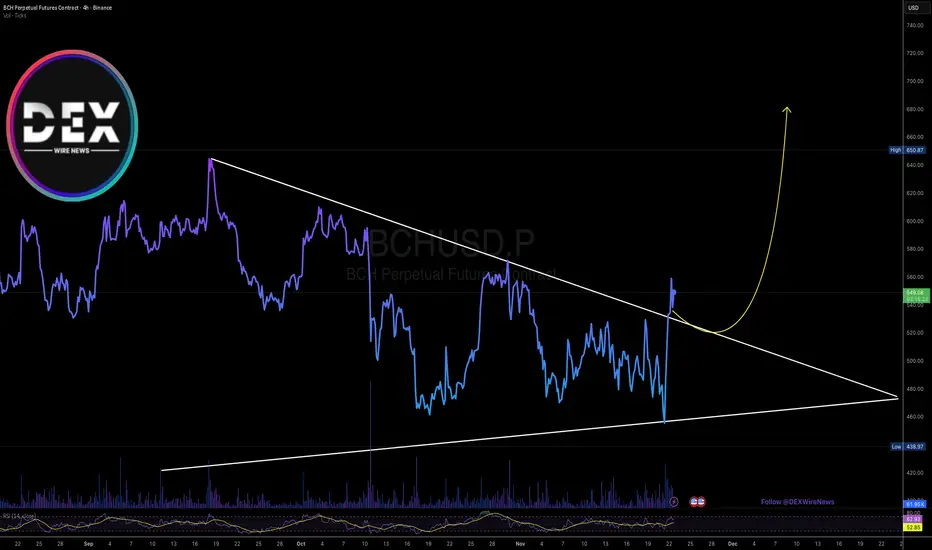
Bitcoin Cash ($BCH) is Up 12% Today, Albeit Market Dip The price of Bitcoin Cash ( CRYPTOCAP:BCH ) saw a notewhorthy uptick of 12% albeit market turmoil. the altcoin is oscillating within a tight symmetrical triangle pattern gearing for a bullish continuoution pattern.
As of the time of writing, CRYPTOCAP:BCH is up 2.58% gearing for a bullish spike. With the RSI at 62, CRYPTOCAP:BCH is more than able to make a mov to the $700 resistance point.
What Is Bitcoin Cash (BCH)?
Bitcoin Cash (BCH) is a peer-to-peer electronic cash system that aims to become sound global money with fast payments, micro fees, privacy and larger block size. As a permissionless, decentralized cryptocurrency, Bitcoin Cash requires no trusted third parties.
Bitcoin Cash Price Data
The Bitcoin Cash price today is $545.45 USD with a 24-hour trading volume of $1,049,904,696 USD. Bitcoin Cash is up 11.57% in the last 24 hours. The current CoinMarketCap ranking is #11, with a market cap of $10,885,408,966 USD. It has a circulating supply of 19,956,897 BCH coins and a max. supply of 21,000,000 BCH coins.
BCH needs to break monthly resistanceIn order to get the explosive move we saw with Zcash. BCH needs to break the yellow line on the monthly time frame. Everyone has been focused on breaking the red line which we did in July, but there hasn't been any substantial uptrend. This is because the red line is formed using wicks and the real resistance is the solid candle of the yellow line.

BCH BITCOINCASH 1D - 1W TFWe can clearly see a large triangle formation along with a well-defined channel, which together outline the structure the price is likely to follow in the near future.
Based on this setup, the price is expected to move toward the highlighted targets as long as it respects the channel and continues developing within this broader triangle pattern.
There is also a possibility that the price may drop to the bottom of the channel — the blue zone — before moving upward.
This would still remain within the overall market structure and would not invalidate the bullish scenario as long as the channel holds.

BCHUSD - Resistance Broken This long term resistance line has been approached and broken through by price
I think a bigger break out is coming if this is a true break of this trend line
In my opinion a very undervalued crypto right now
Daily timeframe

BCH Short ideaCurrent BINANCE:BCHUSDT Market Status
The current BCH market status is as follows:
We previously had a strong bullish trendline that drove the price from $250 to $650. However, this structure has been broken, and it appears we have entered a ranging phase between $650 and $500, with the price oscillating between these two points multiple times.
What's interesting is the old Fair Value Gap (FVG) at $500 to $525. It acted as a resistance multiple times, and after being broken, it has turned into a strong support. This strength can likely be attributed to the high number of attempts and retests it took to break through that initial resistance.
Regarding a Short Position
There are several reasons to consider a short position, at least down to the $500 level. These include the price ranging box, the market's inability to decisively break the $640 resistance, and other factors that are clearly visible on the chart.
Please Note:
This is not financial advice. Do your own research and only invest what you can afford to lose.

BCHUSD H | Bearish Reversal DevelopingBCH/USD has rejected off the sell entry, which is a pullback resistance that is slightly below the 78.6% Fibonacci retracement and could drop from this level to the take profit.
Sell entry is at 566.81, which is a pullback resistance that is slightly below the 78.6% Fibonacci retracement.
Stop loss is at 611.6, which is a pullback resistance.
Take profit is at 507.42, which is a pullback support that aligns with the 61.8% Fibonacci retracement.
Stratos Markets Limited (tradu.com ):
CFDs are complex instruments and come with a high risk of losing money rapidly due to leverage. 68% of retail investor accounts lose money when trading CFDs with this provider. You should consider whether you understand how CFDs work and whether you can afford to take the high risk of losing your money.
Stratos Europe Ltd (tradu.com ):
CFDs are complex instruments and come with a high risk of losing money rapidly due to leverage. 70% of retail investor accounts lose money when trading CFDs with this provider. You should consider whether you understand how CFDs work and whether you can afford to take the high risk of losing your money.

BCHUSD M30 | Potential Upside MoveBCHUSD has reacted off the buy entry, which is a pullback support and could rise from this levle to the upside.
Buy entry is at 475.84, whichis a pullback support.
Stop loss is at 463.77, which is a multi-swing low support.
Take profit is at 500.15, which is a pullback resistance.
Stratos Markets Limited (tradu.com/uk ):
CFDs are complex instruments and come with a high risk of losing money rapidly due to leverage. 68% of retail investor accounts lose money when trading CFDs with this provider. You should consider whether you understand how CFDs work and whether you can afford to take the high risk of losing your money.
Stratos Europe Ltd (tradu.com/eu ):
CFDs are complex instruments and come with a high risk of losing money rapidly due to leverage. 70% of retail investor accounts lose money when trading CFDs with this provider. You should consider whether you understand how CFDs work and whether you can afford to take the high risk of losing your money.

BCHUSD H4 | Bearish Reversal in PlayBCH/USD has rejected off the sell level, which is an overhead resistance could drop this level to the downside.
Sel entry is at 534.31
Stop loss is at 567.75, which is a pullback resistance that aligns with the 61.8% Fibonacci retracement.
Take profit is at 490.25, which is a pullback support that aligns with the 61.8% Fibonacci projection.
High Risk Investment Warning
Trading Forex/CFDs on margin carries a high level of risk and may not be suitable for all investors. Leverage can work against you.
Stratos Markets Limited (tradu.com ):
CFDs are complex instruments and come with a high risk of losing money rapidly due to leverage. 65% of retail investor accounts lose money when trading CFDs with this provider. You should consider whether you understand how CFDs work and whether you can afford to take the high risk of losing your money.
Stratos Europe Ltd (tradu.com ):
CFDs are complex instruments and come with a high risk of losing money rapidly due to leverage. 66% of retail investor accounts lose money when trading CFDs with this provider. You should consider whether you understand how CFDs work and whether you can afford to take the high risk of losing your money.
Stratos Global LLC (tradu.com ):
Losses can exceed deposits.
Please be advised that the information presented on TradingView is provided to Tradu (‘Company’, ‘we’) by a third-party provider (‘TFA Global Pte Ltd’). Please be reminded that you are solely responsible for the trading decisions on your account. There is a very high degree of risk involved in trading. Any information and/or content is intended entirely for research, educational and informational purposes only and does not constitute investment or consultation advice or investment strategy. The information is not tailored to the investment needs of any specific person and therefore does not involve a consideration of any of the investment objectives, financial situation or needs of any viewer that may receive it. Kindly also note that past performance is not a reliable indicator of future results. Actual results may differ materially from those anticipated in forward-looking or past performance statements. We assume no liability as to the accuracy or completeness of any of the information and/or content provided herein and the Company cannot be held responsible for any omission, mistake nor for any loss or damage including without limitation to any loss of profit which may arise from reliance on any information supplied by TFA Global Pte Ltd.
The speaker(s) is neither an employee, agent nor representative of Tradu and is therefore acting independently. The opinions given are their own, constitute general market commentary, and do not constitute the opinion or advice of Tradu or any form of personal or investment advice. Tradu neither endorses nor guarantees offerings of third-party speakers, nor is Tradu responsible for the content, veracity or opinions of third-party speakers, presenters or participants.

BCHUSD H4| Bullish Bounce Off Major SupportBCH/USD has bounced off the buy entry which is a multi-swing low support and could rise from this level to the upside.
Buy entry is at 527.26, which is a multi-swing low support.
Stop loss is at 509.38, which is a pullback support that aligns with the 127.2% Fibonacci extension.
Take profit is at 566.31, which is a pullback resistance that lines up with the 50% Fibonacci retracement.
High Risk Investment Warning
Trading Forex/CFDs on margin carries a high level of risk and may not be suitable for all investors. Leverage can work against you.
Stratos Markets Limited (tradu.com ):
CFDs are complex instruments and come with a high risk of losing money rapidly due to leverage. 65% of retail investor accounts lose money when trading CFDs with this provider. You should consider whether you understand how CFDs work and whether you can afford to take the high risk of losing your money.
Stratos Europe Ltd (tradu.com ):
CFDs are complex instruments and come with a high risk of losing money rapidly due to leverage. 66% of retail investor accounts lose money when trading CFDs with this provider. You should consider whether you understand how CFDs work and whether you can afford to take the high risk of losing your money.
Stratos Global LLC (tradu.com ):
Losses can exceed deposits.
Please be advised that the information presented on TradingView is provided to Tradu (‘Company’, ‘we’) by a third-party provider (‘TFA Global Pte Ltd’). Please be reminded that you are solely responsible for the trading decisions on your account. There is a very high degree of risk involved in trading. Any information and/or content is intended entirely for research, educational and informational purposes only and does not constitute investment or consultation advice or investment strategy. The information is not tailored to the investment needs of any specific person and therefore does not involve a consideration of any of the investment objectives, financial situation or needs of any viewer that may receive it. Kindly also note that past performance is not a reliable indicator of future results. Actual results may differ materially from those anticipated in forward-looking or past performance statements. We assume no liability as to the accuracy or completeness of any of the information and/or content provided herein and the Company cannot be held responsible for any omission, mistake nor for any loss or damage including without limitation to any loss of profit which may arise from reliance on any information supplied by TFA Global Pte Ltd.
The speaker(s) is neither an employee, agent nor representative of Tradu and is therefore acting independently. The opinions given are their own, constitute general market commentary, and do not constitute the opinion or advice of Tradu or any form of personal or investment advice. Tradu neither endorses nor guarantees offerings of third-party speakers, nor is Tradu responsible for the content, veracity or opinions of third-party speakers, presenters or participants.

BCHUSD | H4 Bearish ReversalBased on the H4 chart analysis, we can see that the price has rejected off the sell entry, which is a pullback resistance, and could drop from this level to the downside.
Sell entry is at 583.57, which is a pullback resistance.
Stop loss is at 606.73, which is a pullback resistance.
Take profit is at 547.24, which his a pullback support that lines up with the 78.6% Fibonacci retracement.
High Risk Investment Warning
Trading Forex/CFDs on margin carries a high level of risk and may not be suitable for all investors. Leverage can work against you.
Stratos Markets Limited (tradu.com ):
CFDs are complex instruments and come with a high risk of losing money rapidly due to leverage. 65% of retail investor accounts lose money when trading CFDs with this provider. You should consider whether you understand how CFDs work and whether you can afford to take the high risk of losing your money.
Stratos Europe Ltd (tradu.com ):
CFDs are complex instruments and come with a high risk of losing money rapidly due to leverage. 66% of retail investor accounts lose money when trading CFDs with this provider. You should consider whether you understand how CFDs work and whether you can afford to take the high risk of losing your money.
Stratos Global LLC (tradu.com ):
Losses can exceed deposits.
Please be advised that the information presented on TradingView is provided to Tradu (‘Company’, ‘we’) by a third-party provider (‘TFA Global Pte Ltd’). Please be reminded that you are solely responsible for the trading decisions on your account. There is a very high degree of risk involved in trading. Any information and/or content is intended entirely for research, educational and informational purposes only and does not constitute investment or consultation advice or investment strategy. The information is not tailored to the investment needs of any specific person and therefore does not involve a consideration of any of the investment objectives, financial situation or needs of any viewer that may receive it. Kindly also note that past performance is not a reliable indicator of future results. Actual results may differ materially from those anticipated in forward-looking or past performance statements. We assume no liability as to the accuracy or completeness of any of the information and/or content provided herein and the Company cannot be held responsible for any omission, mistake nor for any loss or damage including without limitation to any loss of profit which may arise from reliance on any information supplied by TFA Global Pte Ltd.
The speaker(s) is neither an employee, agent nor representative of Tradu and is therefore acting independently. The opinions given are their own, constitute general market commentary, and do not constitute the opinion or advice of Tradu or any form of personal or investment advice. Tradu neither endorses nor guarantees offerings of third-party speakers, nor is Tradu responsible for the content, veracity or opinions of third-party speakers, presenters or participants.

BCHUSD - An Altcoin ChoiceAn expanding wedge allows for price extension so high, this will be the last move for this wedge.
It is a massive move but im not sure what is soon to come for alts.
I'm bullish on BCH for its real world applicability.
Weekly chart

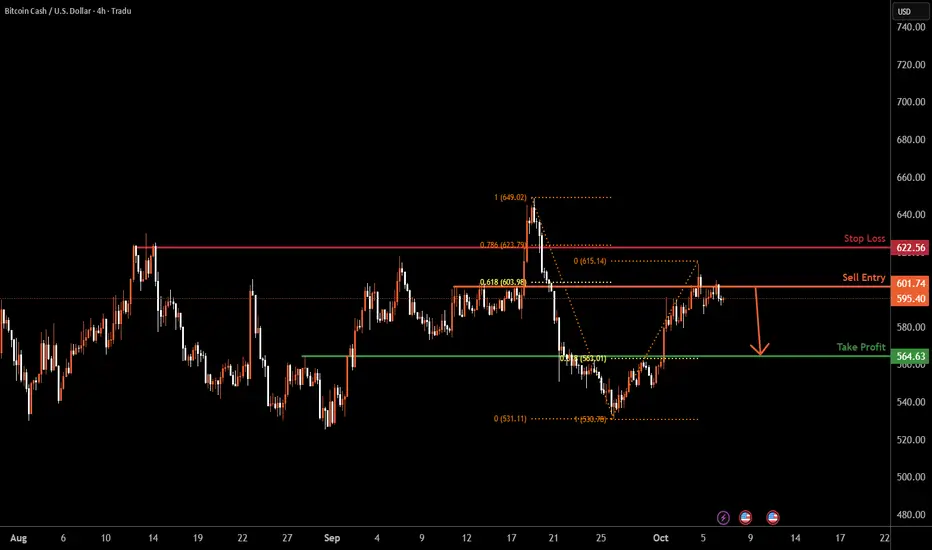
BCHUSD H4 | Bearish reversal from 61.8% Fibonacci resistanceBCH/USD has rejected off the sell entry, which is a pullback resistance that aligns with the 61.8% Fibonacci retracement and could drop from this level to the downside.
Sell entry is at 601.74, which is a pullback resistance that aligns with the 61.8% Fibonacci retracement.
Stop loss is at 643.95, which is a pullback resistance that aligns with the 78.6% Fibonacci retracement.
Take profit is at 564.63, which is a pullback support that aligns with the 61.8% Fibonacci retracement.
High Risk Investment Warning
Trading Forex/CFDs on margin carries a high level of risk and may not be suitable for all investors. Leverage can work against you.
Stratos Markets Limited (tradu.com ):
CFDs are complex instruments and come with a high risk of losing money rapidly due to leverage. 65% of retail investor accounts lose money when trading CFDs with this provider. You should consider whether you understand how CFDs work and whether you can afford to take the high risk of losing your money.
Stratos Europe Ltd (tradu.com ):
CFDs are complex instruments and come with a high risk of losing money rapidly due to leverage. 66% of retail investor accounts lose money when trading CFDs with this provider. You should consider whether you understand how CFDs work and whether you can afford to take the high risk of losing your money.
Stratos Global LLC (tradu.com ):
Losses can exceed deposits.
Please be advised that the information presented on TradingView is provided to Tradu (‘Company’, ‘we’) by a third-party provider (‘TFA Global Pte Ltd’). Please be reminded that you are solely responsible for the trading decisions on your account. There is a very high degree of risk involved in trading. Any information and/or content is intended entirely for research, educational and informational purposes only and does not constitute investment or consultation advice or investment strategy. The information is not tailored to the investment needs of any specific person and therefore does not involve a consideration of any of the investment objectives, financial situation or needs of any viewer that may receive it. Kindly also note that past performance is not a reliable indicator of future results. Actual results may differ materially from those anticipated in forward-looking or past performance statements. We assume no liability as to the accuracy or completeness of any of the information and/or content provided herein and the Company cannot be held responsible for any omission, mistake nor for any loss or damage including without limitation to any loss of profit which may arise from reliance on any information supplied by TFA Global Pte Ltd.
The speaker(s) is neither an employee, agent nor representative of Tradu and is therefore acting independently. The opinions given are their own, constitute general market commentary, and do not constitute the opinion or advice of Tradu or any form of personal or investment advice. Tradu neither endorses nor guarantees offerings of third-party speakers, nor is Tradu responsible for the content, veracity or opinions of third-party speakers, presenters or participants.