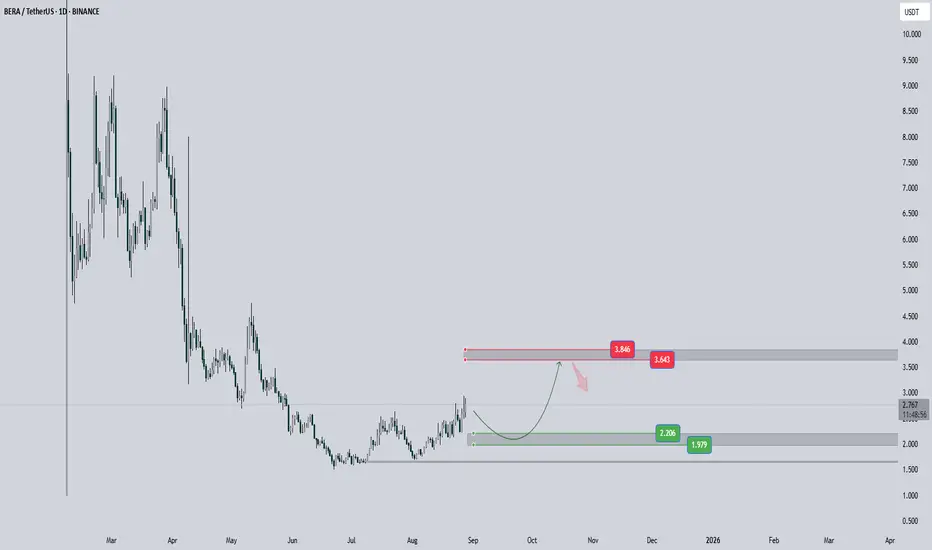
What I'd Like to See from BeraAfter a significant drop in its initial days following the launch and listing, the BINANCE:BERAUSDT has finally recovered, stabilizing at the $1.50 mark. This sharp decline was likely due to the project's free airdrop.
However, we are now seeing a strong performance from Bera, which has grown by nearly 100% in recent weeks, managing to climb back to the $2.50 range.
The most favorable scenario for continued growth would be a minor pullback to the $2.00 to $2.20 range, followed by a rally to $3.60-$3.80 and consolidation within that area.
Should this scenario play out, I anticipate a price correction around the $3.60 to $3.80 levels, although I am not yet sure of the timing or the extent of the correction.
⛔ Disclaimer: No Guarantee of Profit or Loss
Please be aware that all investments, trading, and financial decisions involve risk. The information provided is for general informational purposes only and should not be considered as financial advice. We do not guarantee any specific outcomes, profits, or returns.
You are solely responsible for your own investment decisions. The past performance of any investment or strategy is not a reliable indicator of future results. We recommend conducting your own research and consulting with a qualified financial advisor before making any financial decisions.
By using this information, you acknowledge that you will not hold us liable for any losses or damages incurred as a result of your financial activities.
BERAUSD
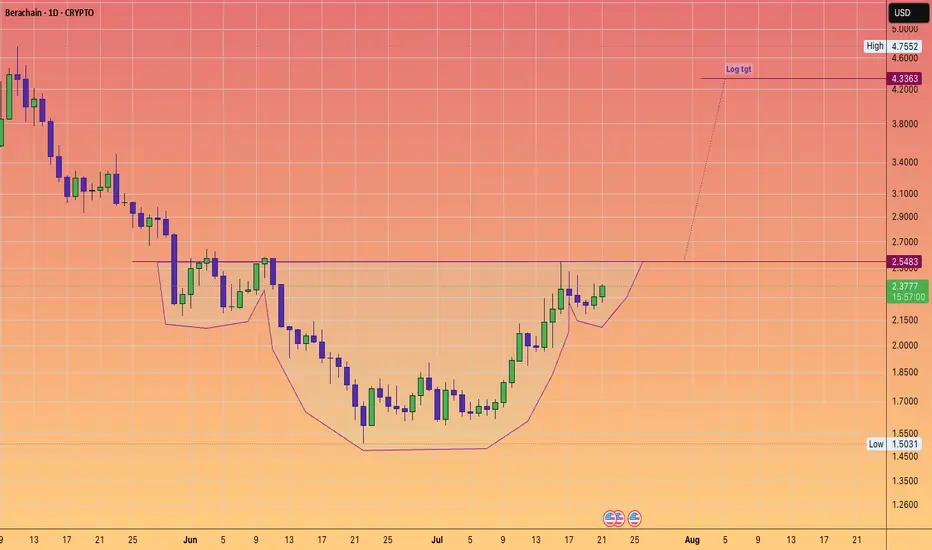
Berachain MOGGING the bears! Back to over $4#InverseHead&Shoulders
clean setup
log tgt provided.
sorry its altseason 100 things going on
no lengthy description needed :)
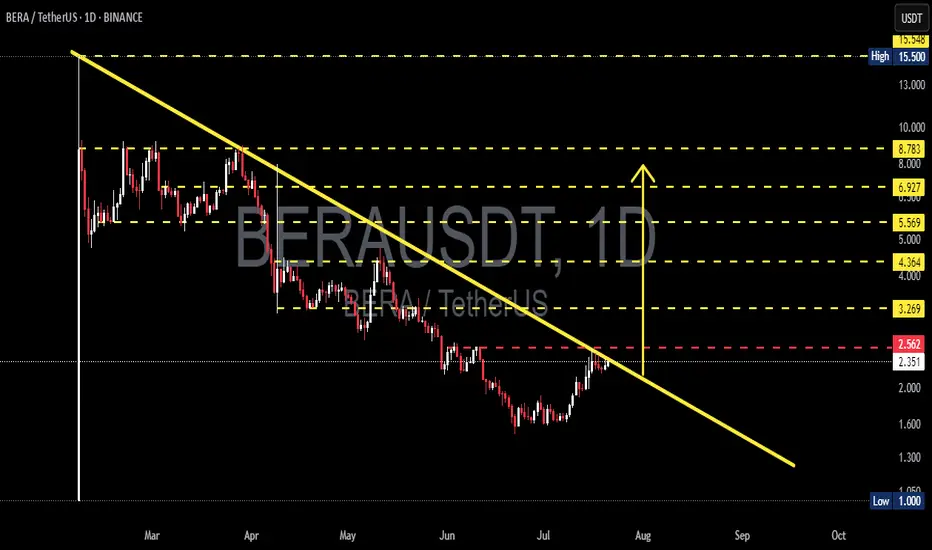
BERAUSDT Major Breakout in Progress? Early Signal of a Potential📊 Full Technical Analysis
The BERA/USDT pair is displaying a highly compelling structure on the daily time frame, where the price has formed a Falling Wedge / Descending Triangle pattern over the past 4+ months.
This type of pattern often signals a large-scale accumulation phase by smart money, followed by an explosive breakout once selling pressure is exhausted and demand starts to dominate.
🧱 Pattern Structure: Falling Wedge / Descending Triangle
Descending trendline resistance (yellow line): Has suppressed price action since early March 2025
Horizontal support formed around the $1.00 to $2.00 zone (strong accumulation area)
Volume has been contracting — a typical sign of a wedge nearing breakout point
Price is approaching the key breakout zone at ~$2.56, showing early signs of reversal
---
✅ Bullish Scenario (Potential Major Reversal)
If the daily candle closes above $2.56 with strong volume confirmation, the breakout could trigger significant upside, with potential targets as follows:
Target Resistance Levels Notes
$3.269 Minor resistance + breakout confirmation level
$4.364 Previous support turned resistance
$5.569 Key historical distribution zone
$6.927 – $8.783 Mid-term targets / potential profit zones
$15.500 Long-term ATH target if momentum continues
💡 Additional Bullish Catalysts:
Volume compression aligns with classic breakout behavior
Breakouts from such macro patterns can yield 100–300% rallies in crypto markets
❌ Bearish Scenario (Rejection or Fakeout Risk)
If the price gets rejected at the trendline near $2.56 and fails to break above:
A pullback to the $2.00 – $2.35 support zone is likely
Further selling pressure may push price down to $1.00 (major support & psychological level)
A drop below $1.00 would confirm a continuation of the downtrend, forming new lower lows
🚨 Caution: Be wary of false breakouts — especially if the breakout happens with low volume or against bearish divergences.
🧠 Trading Plan & Strategy
Conservative Entry: Wait for a confirmed breakout + retest + volume confirmation
Aggressive Entry: Enter on daily candle close above $2.56
Stop Loss (SL): Below previous support: $2.30 or tighter at $2.00
Take Profit (TP): Scale out at $3.2 – $4.3 – $5.5 – $6.9 – $8.7
🧭 Conclusion: Critical Moment for a Macro Reversal?
> BERA is at a pivotal point that could define its next major trend. A successful breakout from this long-term pattern could mark the beginning of a powerful bullish cycle.
The technical setup is solid, the breakout level is near, and the reward-to-risk ratio is highly attractive — ideal for swing traders, breakout traders, and mid-term investors.
#BERA #BERAUSDT #CryptoBreakout #FallingWedgePattern #AltcoinAnalysis
#BreakoutSetup #TechnicalAnalysis #SwingTrade #CryptoSignals
#BullishReversal
$BERAUSDT (30M Chart) – Bullish Breakout in PlayBIST:BERA has broken out of the descending triangle with conviction and is now consolidating just above the breakout zone.
🔹 Triangle breakout confirmed
🔹 Retesting previous resistance as support
🔹 Holding above 200 EMA, showing momentum shift
🎯 Targets:
• TP1: $3.311
• TP2: $3.424
• TP3: $3.586
🛑 Stop-loss: $3.077 (below structure)
Momentum is shifting. Watch for a strong candle close or volume spike on the retest to confirm continuation.

BERAUSDT 12H Analysis BERA ~ 12H Analysis
#BERA This coin has a strong bullish trend. Buy from here with a short-term target of at least 10%+

BERAUSDT 4HBERA ~ 4H Analysis
#BERA Pay attention to this charts. Wait for one of this line to be successfully penetrated.

BERAUSDTThe BERA/USDT trading pair is showing a moderate upward trend. The price is gradually increasing, indicating a steady buying interest without significant volatility. While the movement is not aggressive, it reflects a positive market sentiment. Key support and resistance levels should be monitored to assess potential breakout points or retracements.
