CHFJPY higher bearish expectations
OANDA:CHFJPY having strong bearish push, here for today still higher bearish expectations having, sug. lower invest.
SUP zone: 201.000
RES zone: 198.600, 197.700
Beyond Technical Analysis

US30 - 4H/D/M - Short Signal1. On the monthly timeframe, a sell signal had already been issued.
2. On the weekly and daily timeframes, there were no signs of a decline until recently.
3. However, daily and 4-hour charts are now showing early signs of bearish momentum.
4. The weekly close will be key in determining the next direction on the weekly timeframe.
5. Therefore, the optimal short entry level appears to be the zone marked on the chart.
6. Given the favorable risk-to-reward ratio, this entry seems logical from a trading perspective.

Psychological analysis - BTC in Investment zoneHello ,
In this short video I will be covering 1% psychological analysis of the current crypto market.
For me I entered a first order at 63k , but I see that all the range between 60k to 66k is very attractive for investment , specially after I sold my BTC at 118k.
A second order is ready in form of stablecoins. I will let you know when I will DCA.
Did you like the video ?
This is not a financial advice.
BITSTAMP:BTCUSD BINANCE:BTCUSDT COINBASE:BTCUSD BINANCE:BTCUSDT.P

Daily Chart | Elliott Wave + Options Flow $AMDNASDAQ:AMD 📉 Daily Chart | Elliott Wave + Options Flow
Price sitting right at the 0.702 fib ($213.44). If this level fails, next major support is the 1.236 extension at $172.73 — confluent with horizontal support at $172.85.
Wave (2) completion projected in that zone before a reversal into wave (3) up.
📡 Today's flow confirms the bias:
• 33 trades — 29 puts vs 4 calls
• $1.17M total premium, heavy bearish skew
Key levels:
🔴 Resistance: $266.22
🟡 Current: $213.22 (0.702 fib)
🟢 Target: $172.73-$172.85 (wave 2 completion)
Chart + flow alignment. Watching for breakdown below $207 (0.786 fib) for confirmation.
Not financial advice.
#AMD #ElliottWave #OptionsFlow #WaverVanir

what injected all this sudden volatility Rumbles price barely moved for a very long time. then on 12/2/21 the volatility went through the roof. What happened? this was around Christmas time but I don't think santa did this.

2200 | OVERBOUGHT RANGE — Rejection Risk at Static Resistance TADAWUL:2200 — 1D Chart | DSRTL-ML Algorithmic Reading
Matrix State: S3/D1 | Confidence: 55% | Bias: Rejection Risk (Overbought)
Price at SAR 5.28 sits mid-range between Static Support (SAR 4.73–4.77) and Static Resistance (SAR 5.38–5.44). The Dynamic state reads D1 (Overextended Up), meaning price is stretched above dynamic equilibrium without structural confirmation. This creates a classic overbought-in-range condition with mean reversion pressure.
Key Structural Observations
A resistance confluence sits directly overhead: Pivot Dyn ▲ (SAR 5.38) aligns exactly with Static R lower boundary (SAR 5.38). This double-wall makes a clean breakout unlikely without strong volume.
POC at SAR 5.33 is above current price — the volume-accepted fair value has not been reclaimed yet.
5PT Dyn ▲ at SAR 5.07 and Pivot Dyn ▼ at SAR 4.92 define the dynamic floor below.
Volume Profile shows the heaviest node at SAR 4.87 (59.05% of POC) — well below price, meaning support above it is structurally thin.
Buy delta is marginally positive (+103K), but sell volume (3.16M) nearly matches buy volume (3.27M) — no decisive buyer commitment.
Levels to Watch
Immediate Resistance: SAR 5.33 (POC) → SAR 5.38 (Pivot Dyn ▲ + Static R)
Immediate Support: SAR 5.07 (5PT Dyn ▲) → SAR 4.92 (Pivot Dyn ▼)
Verdict: SHORT-TERM BEARISH (Within Range)
The algorithm reads S3/D1 as an overextended condition inside a broader range. Price is pressing into a heavy resistance cluster (SAR 5.33–5.44) without sufficient volume confirmation. The D1 overextension signal — without price actually breaking any resistance — suggests exhaustion rather than strength. The expectation is a pullback toward SAR 5.07 (5PT Dyn ▲), with SAR 5.33–5.38 acting as a rejection zone. A clean daily close above SAR 5.44 would invalidate this bearish bias.
In summary: Range-bound structure with a bearish short-term lean. Rallies into SAR 5.33–5.38 are more likely to face rejection than breakout.
⚠️ This reading is generated entirely by the DSRTL-ML indicator's algorithmic output. It does not constitute investment advice.


Wait for choch as confirmation To confirm bullish intent, price should change character by displacing the Lower High then induce more sellers before buying.
If price buys from here, it will be to the daily High which is far.

52 Week High Breakout - Positional Trade - Long TermDisclaimer: I am not a Sebi registered adviser.
This Idea is publish purely for educational purpose only before investing in any stocks please take advise from your financial adviser.
52 Week Breakout. Stock has Crossed 52 week High. Keep in watch list. Buy above the high. Suitable for Positional Trade. Stop loss & Target Shown on Chart. Stop loss Trail by 30 SMA. Exit if Price Close below 30 SMA on Weekly Chart.
Be Discipline because discipline is the Key to Success in the STOCK Market.
Trade What you see not what you Think.

XAUUSD BREAKOUT COMINGJust like the world in Feb 2026, geopolitical tensions simmering, economies in liMBO, XAUUSD is trapped inside a massive IFC on the daily chart, coiling pressure for the next big sweep.
Breakout coming… but is it real institutional flow or just retail bait? TAKE TO ME... H4 BULLISH BREAK OUT

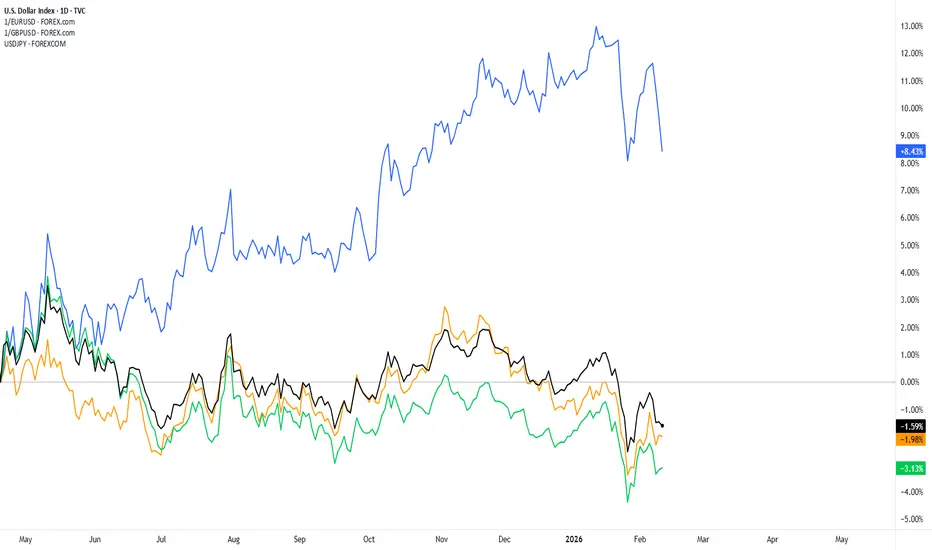
Yen Impact on the DXY Basket Because spot FX is traded in pairs it can often be difficult to isolate individual themes in currencies, especially amongst major pairs as some have the USD as the base currency in the quote and others as the counter currency.
Of late, the long-term carry trade in USD/JPY has had incredible impact in USD dynamics and that's had impact elsewhere, even in pairs like EUR/USD. This is similar to Q3 of 2024, when USD/JPY unwound quickly and the USD weakness emanating from that helped to drive a rally in EUR/USD up to the 1.1200 handle.
This image, however, I think does a good job of illustrating how impactful Yen-weakness has been to DXY since late-April of last year. In blue, we have USD/JPY with an 8.4% gain over that period of time. But in green we have EUR/USD, where the USD has lost value and in orange, the same illustration of lost value against the British Pound.
In black we have the DXY basket and visually, you can see where both EUR/USD and GBP/USD have been helping to drive the Dollar weaker even as USD/JPY has driven relative strength.
President Trump has been clear that he wants a weaker Dollar and the Yen-weakness that's been in-place over the past year has been a large factor as to why the USD has held up as well as it has, even with EUR/USD and GBP/USD both rallying up to fresh multi-year highs.
Can this break? Well there's the matter of fundamentals to consider as the rollover on the USD/JPY pair remains tilted to the long side. This doesn't mean that trends can only go up but it does mean that there's a higher bar for shorts to hold positions open as they have to pay rollover by being long the low yielder. And there's also the matter of possible collateral damage, a lesson that was learned well back in 2024 when the carry unwind episode drove a sell-off in US equities as the leverage built in to the system from that trade quickly came out.
But if we start to breach supports in USD/JPY that carry unwind theme can take over quickly, and this places significant importance at the 150.00 level on the pair. - js
GOLD Consolidation two scenario Structure Gold Price extended gains claiming back toward the resistance side now price the cross the level 5100 and again pulling back what should next ?
Gold and silver price futures each rallied on Wednesday with investor easing the likelihood of federal reserve rate cuts as well Geopolitical tension
Two scenarios for Gold reaction:
Gold price is Waiting for the stronger trigger the NFP report will set the short-term direct if the price again cross the level 5100 we see growth at 5172 to 5225 the key level 5000 the market has accumulated enormous potential and news could be driving force force is it possible that the market will test support 5032 to 4905
You may find more details in the chart,
Trade wisely best of luck buddies,
Ps; Support with like and comments for better analysis Thanks for Supporting.

SCHWAB - Trying to Find SupportRight now, buyers might try to establish support around the $96 level after a swift selloff from $107.
This level coincides with the 0.618 of the micro trend that started with the low in November 2025.
The daily RSI is also about to reach the green line which is where we have seen strength start coming back into this market.
If price does see a bounce somewhere in this range, then a retest of the flag pattern is likely as new resistance.
The flag pattern is identified with the white trendline. Normally this would be a bear flag, but since the flag was established after an uptrend it is not as powerful as if it was established after a downtrend. However, if price rallies back to the upside then the bottom of this flag pattern is still likely to create the next lower high. That lower high is predicted to be somewhere between $99-$103.
One other quick hypothesis. If price continues to drop and finds support somewhere between $89-91 then it could be establishing a larger Head & Shoulders pattern. Price could then rally back towards the $99 level, create a right shoulder, then establish the bear trend.
Something I may revisit in the future.

IWM forcing out early longsAs the market maker loves to do, it is going to force out all of the early longs which it lured in and fooled into thinking the uptrend had already begun. very similar program to what happened back in november.

GBPCAD bearish view
$GBPACAD we are have bearish push, currently three times bounce on sup. zone, look like its valid, from here now higher bearish expectations having.
SUP zone: 1.85700
RES zone: 1.84100, 1.83400

Strategic Investment Update – A Long-Term Rotation OpportunityThis investment is not in AI or technology.
It is in a sector that rarely receives attention, yet remains essential to the stability of the global economy.
The recent narrative of moving away from physical goods has begun to reverse. We are returning to an environment where tangible, real-world assets carry increasing value.
I have previously outlined why, at current valuations, I prefer energy producers over precious metals. But alongside energy, there is another overlooked sector that I believe is positioned for a significant re-rating:
Agriculture – specifically the critical inputs required to feed a growing global population.
For this reason, I am actively accumulating shares of Nutrien (NTR), the world’s largest provider of crop nutrients.
At current levels, the gap between Nutrien’s market valuation and the underlying fundamentals of global food security appears substantial. The company is trading at a fraction of its replacement value, while supply and demand dynamics for potash are tightening for the first time in years.
The market seems to be pricing in a prolonged downturn, yet the structural need for fertilizers and agricultural inputs continues to grow. Arable land is limited, global populations are expanding, and crop yields depend on these essential products.
From a risk-reward perspective, I am far more comfortable owning a business built on hard assets, recurring demand, and strong cash flow than I am holding speculative technology stocks trading at elevated multiples.
The downside is supported by tangible infrastructure and consistent demand. The upside lies in a potential market rotation as investors refocus on sectors grounded in real economic necessity.
I am sharing this position publicly because I believe it represents a compelling long-term opportunity.
This is not a short-term trade. It is a two to three-year investment thesis based on fundamentals rather than sentiment.
Regardless of what happens in technology markets or with AI-related stocks, one reality remains constant:
People must eat.
As always, this is not financial advice—only an overview of my personal strategy and perspective.

TJX TO CONT MARK UPLooks like, this is an atypical Re-Accmulation scehmatic 2 of Wyckoff
Supply from 26th jan- 1st feb succesfully absorbed
With Springboard , (Red line)
position intiated based on trigger bar today
**trigger bar still incomplete at the moment

Lowe’s ($LOW) pushing toward $285 as buyers defend $270 supportCurrent Price: 278.38 (Analysis was generated on Monday Morning)
Direction: LONG
Confidence level: 63%(Several professional traders highlight strong support at $270 and continued upside momentum toward $285, with X sentiment reinforcing a buy-the-dip mindset despite limited volume.)
Targets
Target 1: 285.0
Target 2: 290.0
Stop Levels
Stop 1: 270.0
Stop 2: 265.0
Key Insights:
Here’s what’s driving this setup. Price is holding well above both the 50‑day and 200‑day moving averages, which tells me the broader trend is still pointed higher. Several traders are watching the $270 area closely, calling it a line in the sand for buyers. As long as price stays above that zone, the path of least resistance looks higher into the mid‑$280s.
What’s interesting is how often $285 comes up in trader discussions. Multiple traders flagged it as the next real test. That gives us a clean, logical first target for this week. If momentum picks up on volume, the conversation quickly shifts toward a push into the high‑$280s, which is why I’m setting a secondary target at $290.
Recent Performance:
NYSE:LOW closed at $278.38 and has been grinding higher, staying near the upper end of its recent range. The stock has respected higher lows over the past sessions, which lines up with traders describing this as a controlled uptrend rather than an overheated move. Volume has been lighter than average, but price hasn’t given up ground, which usually tells me sellers aren’t very motivated.
Expert Analysis:
Several professional traders pointed out that RSI is still in a healthy bullish zone without flashing exhaustion. MACD remains positive, reinforcing the idea that momentum hasn’t rolled over yet. A few traders did mention that a rejection at $285 could cause a short pullback, but even those views still frame downside toward $270 as a buyable dip, not a trend change.
News Impact:
Recent earnings strength and an analyst price‑target bump have helped keep sentiment constructive. There’s also chatter around expansion plans and steady dividend appeal, which tends to attract longer‑term buyers and reduces the odds of sharp selloffs unless broader market conditions sour.
Trading Recommendation:
Putting it all together, I’m staying LONG on NYSE:LOW for this week. I like entries near current levels or on shallow dips, targeting $285 first and $290 if momentum accelerates. I’m keeping risk tight with a stop at $270 and a deeper fail‑safe at $265 in case the market turns against us. Confidence isn’t sky‑high because data volume is light, but the technical structure and trader consensus favor upside continuation.

DBC slips with commodities as traders lean defensive this week:Current Price: 24.01 (Analysis was generated on Monday Morning)
Direction: SHORT
Confidence level: 46%(Professional traders emphasize commodity and crude oil weakness while upside conviction is limited; social chatter is light and not supported by volume.)
Targets
Target 1: 23.50
Target 2: 22.90
Stop Levels
Stop 1: 24.60
Stop 2: 25.20
Key Insights:
Here’s what’s driving this setup. Professional traders tracking commodity indexes highlighted crude oil sliding hard, with DBC lagging alongside it. That matters because energy still carries meaningful weight in the index, and when oil sells off sharply, DBC usually struggles to hold gains in the same week.
What caught my attention is the lack of upside conviction. I’m not seeing traders step in aggressively on dips. Instead, the commentary revolves around “index down again” and defensive positioning. On the social side, there is a small pocket of bullish chatter, but it’s thin and not backed by volume or follow‑through.
Recent Performance:
You can see this caution show up in price action. DBC has slipped from recent highs near the mid‑$25 area and is now trading around $24 after a series of lower daily closes. The ETF is down on days when commodities broadly pull back, and rebounds have been shallow so far this week.
Expert Analysis:
Several professional traders I track are treating the $24 area as fragile rather than supportive. The consensus view is that if commodities don’t bounce quickly, DBC can drift lower toward the low‑$23s without much effort. That’s why I’m focusing on short-term downside targets rather than looking for a breakout that hasn’t materialized.
At the same time, traders are clear that a reclaim of the mid‑$24s would weaken the short thesis. That’s where I’m drawing my risk line.
News Impact:
Recent news hasn’t helped sentiment. The increase in the ETF’s expense ratio adds a small but real headwind, especially for short-term traders who have plenty of other commodity vehicles to choose from. Meanwhile, macro data showing modest inflation hasn’t sparked a commodity bid, which keeps pressure on funds like DBC.
Trading Recommendation:
Putting it all together, here’s my take: I’m favoring a SHORT position this week, targeting a move toward $23.50 first and potentially $22.90 if commodity weakness continues. I’d keep stops tight above $24.60, with a hard line at $25.20 in case energy snaps back unexpectedly. Confidence is below average because data volume is light, so position sizing should stay conservative.

ETH: The $80M "Whale Trap" (Why $1,930 Is Next)Most traders are celebrating the $80M Long that just opened on Hyperliquid.
They think this is a "Bullish Whale."
They are wrong.
My on-chain analysis confirms this is a classic Liquidity Hunt . Here is the data retail is missing:
1. The "Bait" (Hyperliquid Whale)
A fresh wallet (0x6C85) opened an $80.9M Long at ~$2,039 .
The Flaw: They used 20x Leverage .
The Math: Their Liquidation Price is mathematically pinned at ~$1,930 .
2. The "Hammer" (Trend Research)
Simultaneously, institutional fund Trend Research deposited 35,000 ETH ($80.8M) into Binance.
The Reality: While the Speculator is Longing on-chain, the Institution is preparing to Sell Spot on Binance.
The Goal: Drive the Index Price down to $1,930 to force-liquidate the Hyperliquid whale and grab that $80M liquidity pocket.
3. Technical Structure (Bearish)
Market Structure: We are trapped in a Converging Wedge with a "Bearish Order Block" overhead at $2,148 .
Funding Rates: BitMEX spiked to +0.049% (Extreme Greed). When funding goes positive during a downtrend, it signals a "Bull Trap."
🎯 The Trade Plan
I am betting AGAINST the whale. The path of least resistance is a flush to the liquidation magnet.
❌ SHORT ZONE: $2,100 - $2,125 (Rejection at Bearish OB).
📉 TARGET 1: $1,930 (Whale Liquidation).
📉 TARGET 2: $1,600 (The "Air Pocket" Vacuum).
Verdict: Do not long here. Let the institutions finish their war. We buy the blood at $1,600 , not the bait at $2,039 .
Safe Trading,

When to Close Losers and When to Hold WinnersClosing losers and holding winners is not a mindset problem. It is a structural one. The decision should come from whether the market has invalidated your narrative or continues to support it. Emotion enters when that framework is missing.
A losing trade should be closed when the reason for the trade no longer exists. In practice, this happens when structure breaks beyond the point that defined risk. If price violates the level that anchored the setup, the market has proven a different story. Holding beyond that point turns analysis into hope. The stop is not there to protect comfort. It is there to protect logic.
Losers also need to be closed when market conditions change.
Volatility expansion, liquidity drain, or session transitions can invalidate a setup even if price has not reached the stop. If execution relied on clean participation and that participation disappears, staying in the trade increases risk without increasing probability. Capital is better preserved for conditions that support the original thesis.
Winners require a different lens. A trade should be held as long as structure continues to support the direction. Higher lows in an uptrend or lower highs in a downtrend indicate that control remains intact. Premature exits usually occur when traders focus on unrealized profit instead of structural confirmation.
Partial profit-taking can be used to reduce pressure, but full exits should align with objective signals. Momentum decay, failure to progress toward the next liquidity objective, or a clear structural break against the position are valid reasons to reduce or exit.
Another consideration is location. When price reaches major opposing liquidity or higher timeframe levels, risk increases. Holding through these areas without reassessment often leads to giving back gains. Exiting or reducing exposure here is a strategic decision, not a fear-based one.
The discipline lies in treating losses and gains symmetrically. Both decisions are governed by structure, liquidity, and environment. When trades are managed by narrative instead of emotion, losses remain controlled and winners are allowed to develop. Over time, this alignment does more for performance than any adjustment to entry technique.

Why Risk Management works differently in Funded AccountsRisk management inside funded accounts is often reduced to position sizing and percentage risk. In reality, it operates under a very different set of constraints than personal capital. The presence of hard rules changes what risk actually represents.
In a funded account, risk is not only financial. It is structural. Daily loss limits, maximum drawdowns, and trailing equity thresholds define a fixed boundary. Once that boundary is crossed, the account ends. There is no recovery phase, no opportunity to adjust or wait for conditions to improve. This turns normal variance into a critical threat rather than a temporary setback.
Because of this, two trades with identical risk on paper can carry very different consequences. A perfectly valid loss taken early in the day may remove the ability to participate in high-quality setups later. A sequence of small losses, well within a strategy’s historical tolerance, can still violate account rules simply due to timing. Risk becomes path-dependent rather than distribution-based.
This reality shapes execution. Traders tighten stops to protect drawdown, even when market structure suggests wider protection is needed. They reduce position size beyond what their edge requires to survive longer. Some shift toward higher win-rate setups with lower expectancy to smooth equity. These adjustments are logical responses to constraints, but they redefine what “good” risk management looks like.
In personal accounts, drawdown is elastic. Losses are uncomfortable, but they do not end participation. This allows traders to think in terms of long-term expectancy, sample size, and recovery. Risk management focuses on sustainability over time rather than immediate survival.
Problems arise when traders apply real-account logic to funded environments, or vice versa. What feels conservative in one context can be reckless in another. Funded accounts reward survival within limits. Real accounts reward consistency across cycles.
Understanding this distinction removes confusion and self-blame. Effective risk management is not universal. It is conditional on capital structure. Traders who adapt their expectations and execution to those constraints stop fighting the rules and start working within them.

BTC : (Take Profit 68.700)Bitcoin has hit our take profit and reached a level of 68k before reversing to the downside, stay tuned for more and always follow all signals and instructions cautiously
