Platinum: Metals Enter a Confident Correction PhaseMetals are confidently moving into a correction.
The chart looks bearish — for platinum, the downside target is around 1500, and I don't expect it to go much lower.
I believe it’s reasonable to enter at current levels.
Place the stop above today’s high.
This is not a trend reversal or a metals crash — it’s a correction within an ongoing uptrend.
The bullish structure remains intact! So trade carefully, set your stops, and capture some profits on the downside.
Beyond Technical Analysis

PLTR Weekly Outlook (Oct 28–31)PLTR Weekly Outlook (Oct 28–31): “$190 Gatekeeper — Breakout to $200 or Range Back to $175?”
1) Weekly (1W) — Macro read
* Structure: multi-week BOS advance inside a rising channel; pressing right into the $188–$190 supply shelf.
* Momentum: MACD cooled but holding above zero; Stoch RSI curling up — favors continuation if $188+ holds.
* Key levels: Support: $173 → $169 → $142. Resistance: $190 (gate) → $200/205 channel tops.
My take: Higher-low trend intact; a weekly close above $190 shifts magnet to $200–$205.
2) Daily (1D) — Range control
* Price has chopped between $173–$190; last dip tagged demand near $173 then bounced back to the range high.
* A clean daily close above $190 converts prior supply to support and opens $195 → $200. Lose $186–$185, and the range rotates back toward $178–$173.
* Indicators: MACD flattening after a fade, Stoch RSI turning up — constructive if price holds mid-range.
Plan: Buy dips $186–$187 for a run at $195–$200; abandon if daily closes < $185.
3) 1-Hour (1H) — Execution zone
* Intraday trendline riding $186–$187; repeated BOS into $189–$190 then tight flag.
* Intraday triggers:
* Long: Break/hold $189.8–$190.2 → targets $192.5 → $195 (trail under VWAP/last HL).
* Short scalp: Only on < $186 with rising volume → $184.5 → $181; below $181 brings $178–$175.
4) GEX & Options Sentiment (from your chart)
* Highest positive NETGEX / Gamma wall: $188–$190 (acts like resistance/“pin”).
* Next call walls: $192.5 → $195 → $200 → $202.5.
* Put supports: $170, then $165.
* Stats on your panel: IVR 31.7, IVx avg ~71.2% (vol easing), Calls ~36% of GEX.
Implication: If price pins above $190, gamma can “walk” price toward $195–$200; failure back under $186 shifts magnet toward $175–$170 where puts dominate.
5) Suggested option plays (use small risk, scale in/out)
Bullish (preferred while > $186):
* Breakout: Buy 190C (0–2DTE) on a 15–30m hold above $190.
* Targets $192.5 / $195; lottery runner to $200.
* Invalidation: back inside $189 or a close < $186.
* Conservative: 190/195 or 190/200 call debit spread if IV upticks; better RR into gamma walls.
* Dip buy: If pullback to $186–$187 holds with higher low, take 190C for a push back to the top of range.
Bearish/Hedge (only if structure breaks):
* Lose $186 with volume → 185P (1–2DTE) targeting $181–$178; extend to $175/170 if momentum expands.
* Spread idea: 185/175 put debit if you want defined risk.
Neutral/income (trend intact, expect pin):
* Put credit spread 175/170 into week’s end if price holds $186+ and you prefer conservative theta.
Directional bias this week: Bullish if $186–$187 continues to hold and $190 flips to support → path of least resistance $195 → $200.
Risk line: A sustained break < $186 likely rotates price back to $181–$175 before buyers try again.
Educational only — not financial advice. Manage size, respect stops, and let the levels lead.

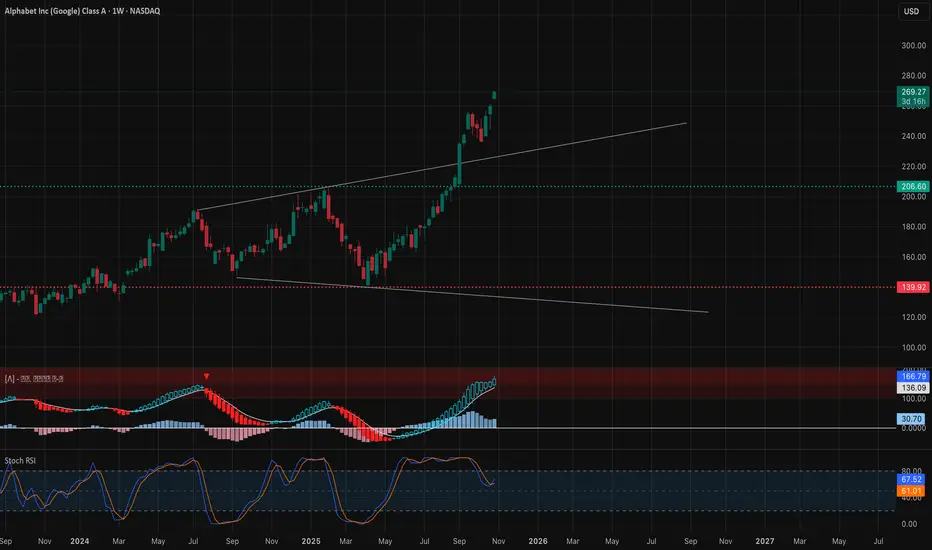
GOOGL Weekly Outlook (Oct 28–31)GOOGL Weekly Outlook (Oct 28–31): “Google Reclaims the Trend — Can It Hold Above $270?” 🔍
1. Weekly (1W) Structure – Macro Strength Reaffirmed
Alphabet’s weekly structure shows a textbook bullish continuation following a confirmed Break of Structure (BOS) above $207. After a brief Change of Character (CHoCH) pullback toward the $145–$150 demand zone, GOOGL reaccelerated upward, reclaiming control of the ascending channel. The move toward $270 marks a decisive momentum comeback with potential to stretch toward $285–$290 if buyers sustain pressure.
* Bias: Bullish continuation
* Support: $207 → $254
* Resistance: $270 → $285
* MACD: Clean bullish expansion — momentum firmly in buyer hands.
* Stochastic RSI: Hovering near overbought, but trending, not topping — indicative of sustained buying momentum.
💡 Weekly Thought:
As long as GOOGL stays above $254, the broader uptrend remains intact. Macro structure suggests strength continuation into November unless a deep profit-taking correction forms below $250.
2. Daily (1D) – Reclaiming Momentum Zone
Daily chart confirms multiple BOS and CHoCH rotations forming a staircase pattern of higher lows and higher highs. The breakout above $260 confirms a new impulse leg inside the mid-channel zone. Buyers reclaimed $256–$259, an area that previously acted as supply — now flipped into a solid demand base.
* Bias: Bullish trend continuation
* Support: $256 → $240
* Resistance: $270 → $280
* Indicators:
* MACD rebounded into positive territory — bullish crossover confirmed.
* Stochastic RSI climbing from midrange — confirming short-term buying pressure.
💭 Daily Suggestion:
Buyers can look for dip entries near $262–$264 early week. A sustained close above $270 may trigger acceleration toward $280–$285 as gamma and volume momentum expand.
3. 1-Hour (1H) – Intraday Precision Map
GOOGL’s 1-hour chart shows near-perfect alignment with higher timeframes. A clean BOS structure sequence forms above $259 and $265, with the price consolidating near $270 — a key resistance-turned-potential breakout pivot. The current slope of the ascending trendline supports a healthy, controlled climb.
* Scalp Bias: Bullish above $262
* Resistance: $272 → $280
* Support: $259 → $249
* Setup Idea:
* Call scalp: Above $270 breakout; target $275–$280.
* Put scalp: Only if price falls below $259 with volume, target $250.
📈 1H Thought:
Intraday traders should monitor price behavior at $270 — this zone is both a psychological and gamma-based resistance. A breakout with strong volume could ignite an extended move to $280 quickly.
4. GEX & Options Sentiment – Institutional Positioning
Gamma Exposure (GEX) reveals a strong call-dominant structure, with layered resistance near $270–$280 — key short-term gamma magnets.
* Highest positive GEX / resistance: $270 → $275 → $280
* Support (put walls): $250 → $242 → $235
* Call bias: +35.8% (bullish skew)
* IVR: 46.6 (moderately elevated)
* IVx avg: 49.8 (slightly declining → supportive of upside expansion)
Institutions appear positioned to defend $255–$260, while higher strikes near $275 are drawing increasing call exposure. Gamma compression could trigger a grind higher if $270 holds.
5. Suggested Option Plays
* Bullish Setup (Preferred):
* Buy-to-open 270C–275C (1DTE/2DTE) on confirmed hold above $270.
* Target: $280
* Stop: Below $259
* Reason: Strong structural breakout confluence with call gamma reinforcement.
* Bearish Hedge (Cautious):
* Buy 250P (1DTE/2DTE) only if breakdown below $259 with volume confirmation.
* Target: $242
* Stop: Above $265
GOOGL is showing a consistent bullish structure across all timeframes — higher lows, continued BOS patterns, and strong gamma buildup supporting continuation. Price action above $270 can trigger a swift advance toward $280 before potential consolidation.
🎯 Primary Bias: Bullish toward $280–$285
⚠️ Watch For: Failure to hold $259 = momentum loss or short-term correction signal.
This analysis is for educational purposes only and does not constitute financial advice. Always do your own research and manage your risk before trading.
AUB AU ( AUB Group Limited) LongAUB Group Limited is a major Australian insurance brokerage and underwriting group, a component of the ASX200 index
Principal activities:
-Insurance Brokerage: AUB Group acts as an intermediary between clients (primarily small and medium-sized businesses) and insurance companies
-Underwriting agencies: The company develops, distributes and manages insurance products on behalf of licensed insurance companies
-International operations: Following the acquisition of the UK company Tysers in 2022, AUB Group significantly strengthened its presence in the UK market, engaged in wholesale and retail brokerage
-Partner network support: AUB Group holds stakes in partner brokerage businesses
Quotes are beating the market. We expect an approach to historical highs, as the company shows:
- strong financial results:
1. In FY25 reached 200.2 million Australian dollars, which is significantly higher than the FY24 figure of 171 million dollars.
2. The declared dividend increased by 15.2% to 91 cents per share
The acquisition of Tysers not only expanded the geographical presence, but also diversified the income. The international segment (mainly UK) now accounts for about 30% of the group's profit.
3. Under the leadership of CEO Michael Emmett, the company has been consistently fulfilling its stated strategic goals. The recent statements by the management about the focus on further optimization and growth in FY26 were also positively received by the market
We also expect a consistent increase in dividends in the coming years
The company's balance sheet is consistently growing, which is also positively received by the market
We are waiting for a local resistance breakout

Gold downtrend, accumulation below 4000⭐️GOLDEN INFORMATION:
Gold (XAU/USD) picks up modestly in Tuesday’s Asian session, rebounding from a two-week low near $3,972. A softer US Dollar, pressured by expectations of two more Fed rate cuts this year, supports the non-yielding metal. Ongoing geopolitical tensions from the Russia-Ukraine conflict also add to its safe-haven appeal.
⭐️Personal comments NOVA:
There is still selling pressure, gold is definitely correcting below 4000, the market is waiting for interest rate results
⭐️SET UP GOLD PRICE:
🔥SELL GOLD zone: 4090 - 4092 SL 4097
TP1: $4080
TP2: $4070
TP3: $4050
🔥BUY GOLD zone: 3941 - 3943 SL 3936
TP1: $3960
TP2: $3980
TP3: $4000
⭐️Technical analysis:
Based on technical indicators EMA 34, EMA89 and support resistance areas to set up a reasonable SELL order.
⭐️NOTE:
Note: Nova wishes traders to manage their capital well
- take the number of lots that match your capital
- Takeprofit equal to 4-6% of capital account
- Stoplose equal to 2-3% of capital account

EURUSD: two possible scenarios for buy setupEURUSD: two possible scenarios for buy setup. EURUSD will have a bullish move, either with correction, or with continuation move.
Cheers

NQ UpdateI totally forgot about the Fed meeting this week.
NQ melting up like I suspected that it would even with two open gaps below. My guess here is that either Powell says something to tank the market or Trump does Friday, lol. Usually what happens when it climbs too high too fast. Or maybe it's buy the rumors, sell the news event.
The market will probably pump right up to the meeting. No point in buying puts until then. I might just stay out of it since the whipsaw is gonna be HUGE. There will be China trade news on Friday too.
RSI and MFI overbought, typical of a melt up, but something always ends a melt up.

"Duct Tape" RallySo says Brian Brenberg of Fox Business's The Big Money Show.
Hopeful news over the weekend about a possible easing of U.S.- China trade tensions gave us today's rally. It's just another duct tape patch. Communism is based on a lie. No matter how cleverly designed and alluring, a lie is still a lie.
"Rob, Replicate and Replace" is a term commonly used when referring to Communist China's Trade policy. Thankfully, for now, we have an administration that knows this and knows how to handle this. Of course, China will continue to lie, obfuscate and delay, delay and delay some more, waiting for a new administration that won't be wise.
Despite this ongoing tension that gives us "duct tape" rallies and volatility, we do have an historical bull market built upon the bedrock of The Fourth Industrial Revolution, strong earnings, an administration that is peace minded and has cut taxes and red tape resulting in powerful economic growth and we have several trade plans that give stellar profits in such an environment. This bull market should last for quite some time.
If you have been following prior posts you would have had your Breakout Trades stacked to the ceiling, ready and waiting for the gap up we had on the 10.26 open. You would have made a pretty good day's pay.
Here is another trade plan I use frequently. I call it a Joker. As with all prior posted trade plans, there's no brilliance here - just common sense. It's a combination of a pivot trade and a Buy the Dip trade. At or near the low of a Buy the Dip area I buy 1 or more MNQ contracts with a profit taker of 101 points. The extra point gives a solid $200.00 profit. I usually get several every week. As usual, I don't use a stop loss. Make sure you manage your margin with this and every prior posted trade plan.
"Behold, I send you forth as sheep in the midst of wolves: be ye therefore wise as serpents, and harmless as doves." Mt. 10:16

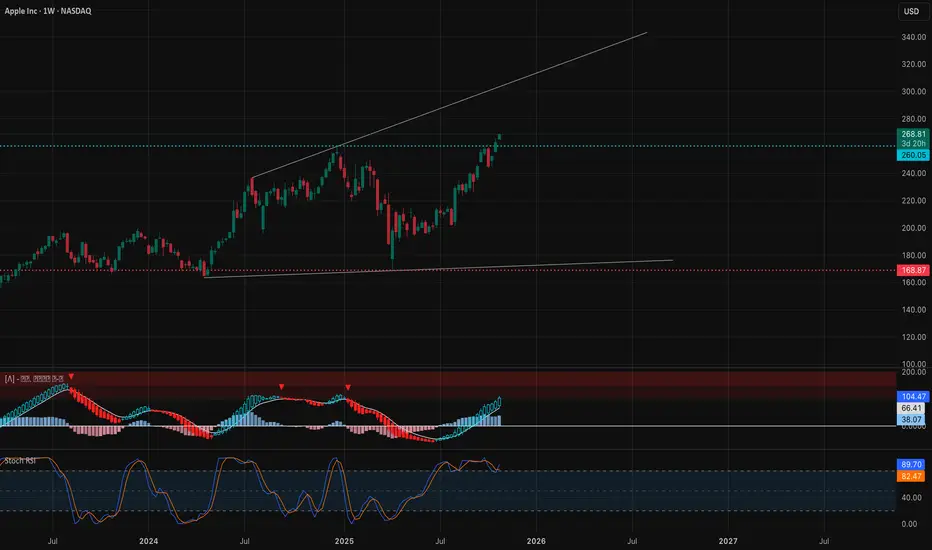
AAPL Weekly Outlook (Oct 28–31)AAPL Weekly Outlook (Oct 28–31): “Apple’s Momentum Reboot — Eyes on $275 Breakout Zone!” 📱
1. Weekly (1W) Structure – Macro Breakout Confirmation
Apple has officially shifted from recovery to expansion phase. The weekly chart shows a confirmed Change of Character (CHoCH) into Break of Structure (BOS) above $260, reclaiming a bullish trajectory. Price is pushing toward the upper channel trendline near $275–$280, showing clean continuation momentum with no immediate resistance until that level.
* Bias: Bullish continuation
* Support: $224 → $260
* Resistance: $275 → $280
* MACD: Strong bullish expansion; histogram widening upward.
* Stochastic RSI: Overbought but still trending — strength, not exhaustion yet.
💡 Weekly Thought:
Momentum is accelerating across the board, confirming institutional participation. Unless $260 breaks down, Apple remains a buy-on-dip candidate heading into November earnings.
2. Daily (1D) – Trend Acceleration
Daily structure is showing clean BOS sequences along an ascending parallel channel. After retesting the midline near $244–$250, Apple bounced strongly and reclaimed the $260 handle. This confirms buyers defending the demand base, now pushing price to challenge $268–$270 short-term resistance.
* Bias: Bullish continuation
* Support: $244 → $259
* Resistance: $270 → $275
* Indicators:
* MACD turning positive again after pullback reset.
* Stochastic RSI curled upward from midzone — signals renewed strength.
💭 Daily Suggestion:
Look for intraday retests around $262–$264 as a potential long entry. A clean daily close above $270 opens path to $275 and eventually $280 if macro remains supportive.
3. 1-Hour (1H) – Intraday Playbook
Intraday structure aligns perfectly with higher timeframes — multiple BOS and short consolidation ranges above $260 confirm sustained bullish control. Momentum is strong, but short-term traders should be cautious of profit-taking near $270–$272 zone before the next leg higher.
* Scalp Bias: Bullish above $262
* Support: $260 → $255
* Resistance: $270 → $275
* Setup Idea:
* Call scalp: Above $266 with target $272–$275.
* Put scalp: Only below $260 breakdown, targeting $255.
📈 1H Thought:
If AAPL consolidates tightly between $266–$269 early in the week, it may coil for a breakout toward $275 later this week.
4. GEX & Options Sentiment – Institutional Positioning
Gamma Exposure (GEX) data shows heavy call concentration aligning perfectly with price structure, reinforcing bullish continuation bias.
* Highest positive GEX / resistance: $269 → $275 → $280
* Support (put-dominated zones): $257 → $252
* Call ratio: 9.1% (moderate bullish exposure)
* IVR: 19.9 (low IV environment)
* IVx avg: 32.6 (slightly cooling)
Institutions are pinning price near $265–$270 with positive gamma bias. The $275–$280 zone acts as the next magnet if upward momentum persists.
5. Suggested Option Plays
* Bullish Setup (Preferred):
* Buy-to-open 270C–275C (1DTE/2DTE) if price reclaims $268 with strength.
* Target: $275–$280
* Stop: Below $260
* Reason: Gamma buildup supports continuation, clean technical breakout setup.
* Bearish Hedge (Cautious):
* Buy 255P (1DTE/2DTE) only if price breaks $260 with confirmed volume.
* Target: $252
* Stop: Above $266
Apple’s structure is aligned bullishly across all timeframes — a clear continuation from the mid-October breakout with strong call-side gamma buildup. The next move hinges on whether $270 flips to support; if so, the stock is primed for a potential $275–$280 test.
🎯 Primary Bias: Bullish toward $275–$280
⚠️ Watch For: Breakdown under $260 = short-term exhaustion signal.
This analysis is for educational purposes only and does not constitute financial advice. Always do your own research and manage your risk before trading.
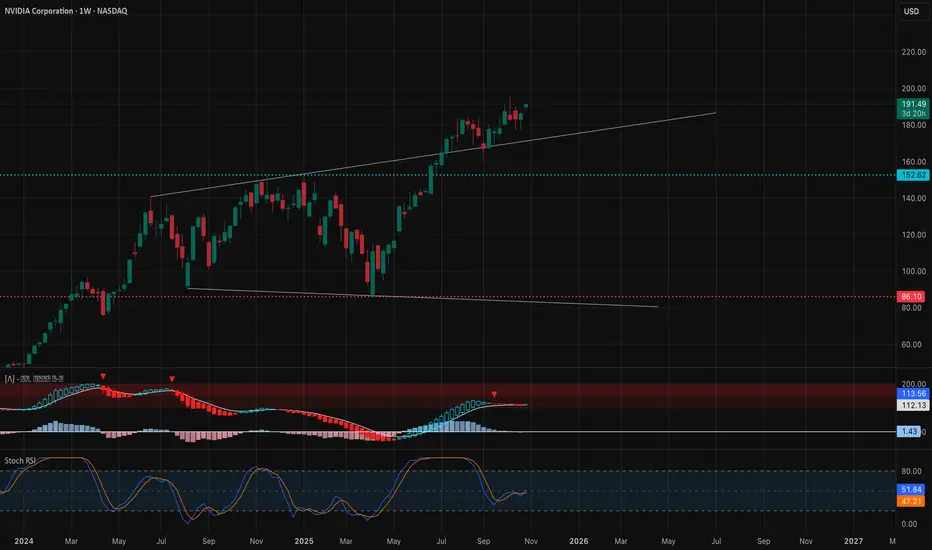
NVDA Weekly Outlook (Oct 28–31)NVDA Weekly Outlook (Oct 28–31): “AI Giant Reawakens — Eyes on $200 Breakout!” ⚙️
1. Weekly (1W) Structure – Macro Strength
NVIDIA is maintaining a strong bullish structure on the weekly chart, with multiple Breaks of Structure (BOS) confirming sustained institutional demand. After a temporary Change of Character (CHoCH) in September, price reclaimed momentum above $185 and is now pressing toward the $197–$200 resistance zone.
* Bias: Bullish continuation with trend support at $160–$165
* Support: $152 → $160
* Resistance: $197 → $205
* MACD: Steadily positive, histogram expanding — momentum accelerating.
* Stochastic: Trending upward from mid-range — room to push higher.
💡 Weekly Thought:
The structure suggests NVDA is forming a strong continuation leg, potentially aiming for a retest of $200–$205 if the AI and semiconductor sector continues its leadership rally.
2. Daily (1D) – Mid-Term Momentum
On the daily chart, NVDA broke out from a corrective CHoCH near $164 and reclaimed the ascending trendline. This move confirms bullish re-entry after testing demand around $170–$175. Price is now nearing the upper boundary of the short-term channel, with potential for a breakout continuation toward $197–$200.
* Bias: Bullish, with trend acceleration visible.
* Support: $184 → $176 (key demand zone)
* Resistance: $197 → $200
* Indicators:
* MACD turning back up after reset — confirming bullish continuation.
* Stochastic RSI crossing up from oversold — aligning with buyer momentum.
💭 Daily Suggestion:
Wait for a light pullback to $187–$188 for call entries. If NVDA sustains above $191, expect a grind higher to $197–$200 before month-end.
3. 1-Hour (1H) – Intraday Structure
Intraday structure remains firm. NVDA has printed consecutive BOS patterns with minimal retracements — a hallmark of institutional stepping. The latest CHoCH near $186 acted as a liquidity sweep before pushing higher.
* Scalp Bias: Bullish above $188
* Resistance: $192 → $195 → $197
* Support: $186 → $183
* Setup Idea:
* Call scalp: Above $191 with momentum confirmation; target $195–$197.
* Put scalp: Only valid below $185, targeting $182.
📈 1H Thought:
Short-term traders can trail profits on breakouts above $191. Any dip toward $186–$187 may offer strong long opportunities if momentum remains intact.
4. GEX & Options Sentiment – Institutional Positioning
Gamma Exposure (GEX) shows clear bullish call accumulation with the strongest walls around the $190–$200 range.
* Highest positive GEX / resistance: $191.5 → $197 → $200
* Support (put-dominated zones): $187 → $182 → $176
* Call flow: +27.3% net GEX (call-biased)
* IVR: 25 (low-to-neutral)
* IVx avg: 53.8 (slightly elevated volatility window)
Institutional positioning implies a controlled bullish grind — with gamma pinning around $190–$195 that could later expand to $200 if momentum persists.
5. Suggested Option Plays
* Bullish Setup (Preferred):
* Buy-to-open 190C–195C (1DTE/2DTE) on breakout above $191.
* Target: $197–$200
* Stop: Below $186
* Reason: Call concentration above 190 supports continuation move.
* Bearish Hedge:
* Buy 180P (1DTE/2DTE) only if NVDA breaks $185 with volume.
* Target: $177
* Stop: Above $190
NVIDIA’s structure is aligned bullishly across all timeframes — higher lows, consistent BOS patterns, and call-heavy gamma flow all suggest momentum continuation toward $197–$200 before potential consolidation.
Short-term traders can look to scalp the $191–$195 zone with calls, while swing traders can hold positions into the breakout channel’s upper range.
🎯 Primary Bias: Bullish toward $200
⚠️ Watch For: Failing to hold $185 = short-term weakness or sideways phase.
This analysis is for educational purposes only and does not constitute financial advice. Always do your own research and manage your risk before trading.
Gold: So what now?🟡 Before the speech (pre-FOMC)
Context:
The market has already priced in the 25-bp rate cut and is now in “confirmation-waiting” mode.
With limited institutional liquidity due to the ongoing government shutdown and FX option expiries coming up tomorrow, prices tend to move mainly from position adjustments rather than new information.
Expected reaction:
• Mild intraday rebounds toward 4,050–4,100 USD, driven by hedging flows.
• But with low buying conviction — traders will wait for Powell’s words before committing to new positions.
• Contained volatility within the 3,950–4,100 USD range.
📊 Summary: Technical consolidation with wicks in both directions. Likely a small pre-event rally — classic “buy the rumor, sell the fact” setup.
⸻
🟡 2️⃣ During Powell’s speech (FOMC event)
🗣️ If Powell adopts a “moderately dovish but cautious” tone — the most likely scenario
Message characteristics:
• Confirms the 25-bp rate cut.
• Reaffirms that policy remains data-dependent.
• Acknowledges labor-market cooling and downside risks to growth.
• Avoids committing to an automatic rate-cut sequence.
Typical reaction:
🕐 First hour (high-volatility knee-jerk move):
• Gold initially jumps 30–50 USD (immediate reaction to the confirmed cut).
• The dollar temporarily weakens; Treasury yields drop.
• Price tests the 4,080–4,150 USD zone.
🕐 Second hour (institutional reassessment):
• Once markets digest that Powell isn’t promising further cuts, institutional traders interpret:
“This is prudent, not expansionary.”
• Profit-taking emerges in gold, causing a minor pullback (–20/30 USD).
• Price may stabilize again within 4,000–4,050 USD.
Net outcome (next 24 hours):
Moderate technical rebound, no structural bullish breakout.
Wide oscillation between 3,950 and 4,150, likely closing around 4,050.
⸻
🟡 3️⃣ Following days (Thursday–Friday)
If the government shutdown continues and no labor data are released:
• Lack of data = no brake for hedging adjustments.
• Traders will seek relative safety in gold as long as the dollar lacks catalysts.
• That could keep gold supported above 3,950–4,000 USD, with a short-term bullish bias toward 4,150–4,200 USD.
If the Fed signals further vigilance (without ruling out more cuts):
• Gold could build a stronger base and project a second leg higher toward 4,220–4,250 USD.
Hit the like button if you like these type of technical and fundamental analysis!

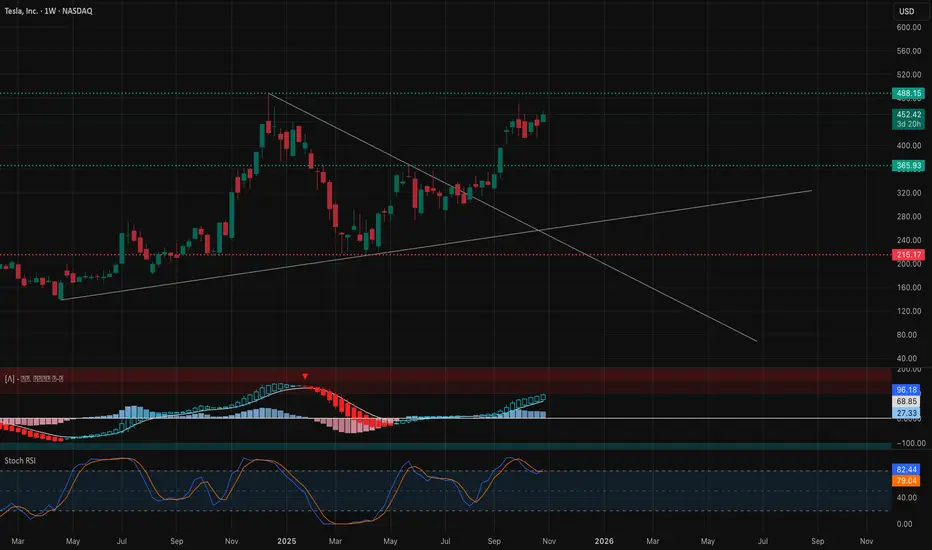
TSLA Weekly Outlook (Oct 28–31)TSLA Weekly Outlook (Oct 28–31): “Charging Toward 470 or Cooling at the Top?” ⚡
1. Weekly (1W) Structure – Big Picture
Tesla is in a strong bullish continuation phase, showing a clear Break of Structure (BOS) above $367 and holding momentum above $450. The downtrend line from the 2023 high was broken, confirming a long-term structural reversal. Price is now consolidating near $452–$460, forming a possible higher-low setup before a push to $488–$500 zone.
* Bias: Bullish continuation unless price closes below $411.
* Support: $367 → $411 zone
* Resistance: $470 → $488 zone
* MACD: Expanding bullish histogram, showing momentum strength.
* Stochastic: Near overbought but still trending upward.
💡 Weekly Thought:
Tesla’s higher timeframe looks ready for another leg up, but a mild pullback to $430–$440 wouldn’t hurt the structure—it would actually create a healthy base for November.
2. Daily (1D) – Momentum Check
The daily chart confirms a strong BOS and ascending channel. After testing the channel’s lower boundary ($411–$420), Tesla rebounded cleanly toward $452. Price is attempting to reclaim the midline of the ascending channel, signaling renewed bullish control.
* Bias: Bullish bias, but short-term profit-taking likely near $460–$470.
* Support: $411 → $420 (demand zone)
* Resistance: $460 → $470 (channel top)
* Indicators:
* MACD turning positive after extended red bars.
* Stochastic curling up from mid-levels — bullish swing signal.
💭 Daily Suggestion:
Buyers should stay patient for pullbacks near $440–$445 to re-enter. Short-term traders can target $468–$470 if price holds above $452 with volume.
3. 1-Hour (1H) – Short-Term Game Plan
Tesla is holding above the intraday uptrend line, with clear Breaks of Structure (BOS) around $451–$455. The immediate zone to watch is the $449–$451 range, acting as dynamic support. As long as Tesla holds this area, intraday bulls maintain control.
* Scalp Bias: Bullish as long as price stays > $449
* Immediate Resistance: $455 → $465
* Support: $439 → $445
* Setup Idea:
* Call scalp: Above $455 for target $462–$468
* Put scalp: Only if breaks below $445 with volume
📈 1H Thought:
If Tesla consolidates sideways around $450–$455 early week, it sets up a launch toward $470 later in the week.
4. GEX & Options Sentiment – Institutional Flow Insight
The Gamma Exposure (GEX) map shows clear call dominance:
* Highest positive GEX wall / resistance: $455–$460
* 2nd & 3rd Call Walls: $465 → $470 → $480
* Put walls / downside support: $430 → $415 → $400
Key Metrics:
* GEX Bias: +57.2% Calls
* IVR: 15.5 (low volatility environment)
* IVx avg: 60.2% (vol compression likely → bullish)
Institutions are positioned bullishly with heavy call exposure at $460–$470, acting as a near-term magnet. The $430–$415 range remains protected by put walls—making it a tough zone to break down through unless macro turns negative.
5. Suggested Option Plays
* Bullish Setup (Preferred):
* Buy-to-open 460C (1DTE/2DTE) if price reclaims $455–$457 with volume.
* Target: $470
* Stop: Below $445
* Reason: Strong call gamma wall at $460 + breakout potential.
* Bearish Hedge (Cautious traders):
* Buy 440P (1DTE/2DTE) only if TSLA breaks $445 on volume.
* Target: $430
* Stop: Above $455
6. My Take for Oct 28–31
Tesla is showing clean bullish structure across all timeframes.
* Weekly confirms a higher low and BOS continuation.
* Daily is aligned within an ascending channel.
* 1H shows intraday bullish trendline support.
* GEX confirms call-dominant sentiment toward $470.
If macro markets remain stable, TSLA likely tests $468–$470 this week, possibly stalling there for profit-taking. A rejection near that level would bring $440–$445 back into play for reload.
🎯 Primary Bias: Bullish toward $470
⚠️ Watch For: Failing to hold $445 = possible short-term correction.
Disclaimer:
This analysis is for educational purposes only and not financial advice. Always manage your risk and perform your own due diligence before trading options or equities.
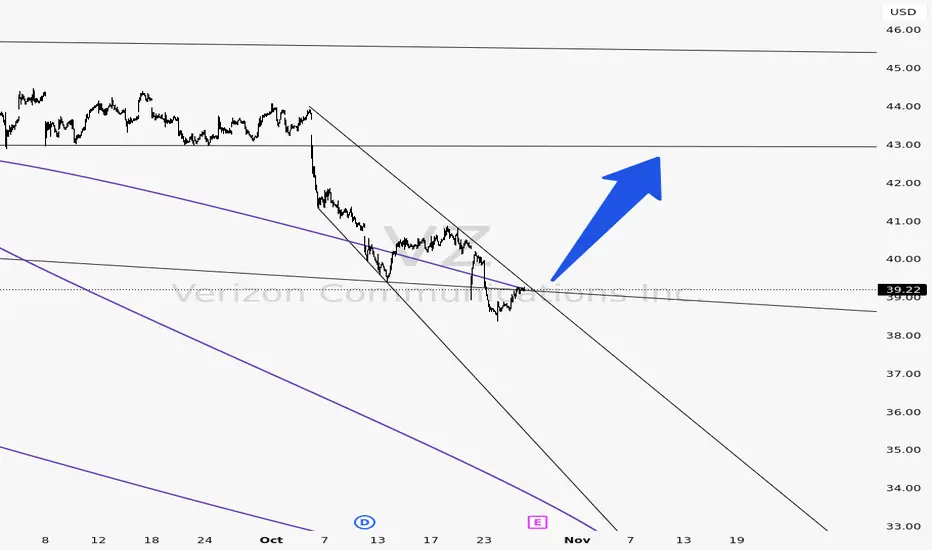
Verizon (VZ) — Bullish Reversal Setup! Smart Money Loading UpNYSE:VZ is showing early signs of a **trend reversal** after a long downtrend. The price is now testing the **upper boundary of its descending channel**, signaling potential breakout momentum.
Technicals suggest that **smart money might be accumulating** before a larger move toward the $45 range.
💎 The structure looks strong — a clean breakout and retest could confirm a new bullish leg.
Watch for volume confirmation and hold above resistance for a possible **momentum breakout**.
“They laughed when NYSE:VZ dipped. They won’t laugh when it rips.” - twitter (WallStMessiah)
👇 Drop your thoughts below — breakout or fakeout?
RECAP TODAY. USING THE SIGNALS AND TOOLS Fellow traders - followers,
I have some today to recap on the day.
Now I will say this. Today went the way they said it would go UP! All the overnight new, the morning media and the tech headlines all made today a profitable day for the bulls! I will also say this: it is a scary situation, because we have no resistance levels up here, so where does all this up trend movement stop? What do we know or where to put our stop losses?
In building these indicators, I'm learning a few things. I'm learning more about myself and about what to look for exactly. There will be days where I will lose. Just like Friday: -$280! The price action was just not as consistent and friendly like it was today.
Let me break down today:
1. I attached the 5min chart to show you what the " Golden Pocket " of my indicator resembles.
A confirmation of price action and direction.
It reacted perfectly. 10:15am Bear candle - 10:20am Bull Doji inside pocket - 10:30am Engulfing Bull candle with a long signal! You couldn't ask for a better set up to the upside to make your money!
2. The 15min time frame was a little more of a bulky solid read. Bull candles with wicks.
The 10:15am candle carried the long signal with it. The wick within that candle was our 5min candles playing out.
Weather you waited for the 15min plays or you entered in the 5mins. You won.
3. So, with all this, there is another indicator I play. That is my 0dte Context bundle. How this works in our favor is that in this specific situation you want to make sure your trends are moving where they need to go. The EMA, SMA and VWAP lines all had same up direction. The Green EMA/SMA Cloud all indicated up is where it's going.
You have the tools to assist in decisions. If you need more help with reading these indicators. Let me know. I'm always down to help out.
Patient is still key. Confirmations are still key. Remember that when trading. Do not get antsy and enter in trades that are not strong or that will not check all your entry boxes.
Thank you again for the follows and the support. I hope these are helpful.
God Bless,
Trades with B!

AMP Futures - How to create alerts for News Flow filtersIn this idea we will demonstrate how to enable alerts for your News Flow Filters using Tradingview.

Methodology: Smart Money Concept (SMC) 📊 Technical Breakdown of the Analysis
1. Market Context
• The chart is XAU/USD on the 5M timeframe.
• A BOS (Break of Structure) to the upside was followed by a ChoCH (Change of Character) to the downside.
• This shows a possible liquidity trap where buyers were induced before price shifts bearish.
2. Liquidity Zone
• Below the marked lows there is Sell-Side Liquidity, where retail buy-side stop losses are resting.
• A Fake Out already occurred, sweeping liquidity.
3. Point of Interest (POI)
• A 5M Order Block (OB-5M) is marked inside the Resistance Zone.
• This is the key institutional area for a potential rejection.
• Planned Sell entry: 3,997.
4. Trade Management
• Stop Loss (SL): 4,013, above the resistance zone.
• Take Profit (TP): 3,951, aligned with liquidity targets.
• Risk/Reward (R/R): 1:2.88, solid for intraday setups.
5. Price Narrative
• Price is expected to retest the OB-5M rejection zone at 3,997.
• After that, the projection is a bearish move with a distribution phase.
• Final target: liquidity sweep around 3,951.
🚀 Motivational Note
“Patience is your edge: wait for price to reach your zone, trust the plan, and let risk management protect you. Consistency comes from discipline, not prediction.” ✨📉💪
GOOD LUCK TRADERS ;)

Examples of Chart Interpretation Methods
Hello, fellow traders!
Follow us to get the latest information quickly.
Have a great day!
-------------------------------------
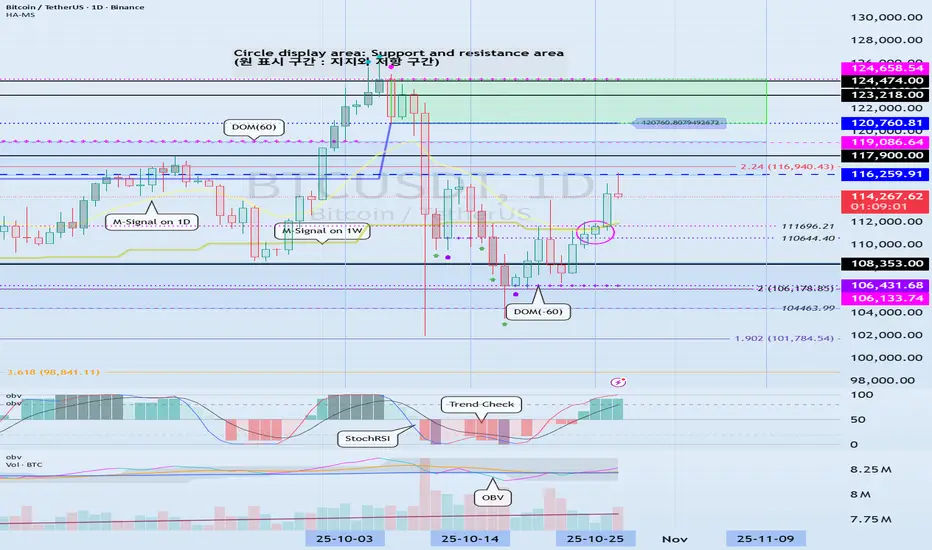
#BTCUSDT
To break above a key point or range and continue the uptrend,
1. The StochRSI indicator must be trending upward. Ideally, it should not enter the overbought zone. 2. The On-By-Signal (OBV) indicator must show an upward trend. If possible, it should remain above the High Line.
3. The TC (Trend Check) indicator must show an upward trend. If possible, it should remain above the 0 level.
Currently, only the TC indicator satisfies the above conditions.
Therefore, if the price remains above the 110644.40-111696.21 range and the above conditions are met, we should see if the price rises above 116259.91 and remains there.
If the On-By-Signal (OBV) indicator remains above EMA 1 and EMA 2 and rises above the High Line, further upside is likely.
However, if the K indicator of the StochRSI indicator enters the overbought zone and the slope changes, the upside may be limited.
When the TC (Trend Check) indicator touches its highest point, there's a high probability of forming a new high, so you should consider a response plan.
Summary of the above:
Support Zone: 110644.40-111696.21
Resistance Zone: 116259.91-119086.64 (up to 124658.54)
------------------------------------
#ETHUSDT
As mentioned in the BTC chart description, ETH is also showing similar movements.
However, the OBV indicator is just about to break above EMA 1 and EMA 2, so if it finds support near 4109.80, there's a possibility of further upside.
-------------------------------------
#ZECUSDT
Based on the BTC chart description, ZEC is likely to continue its upward trend.
The chart is broken due to the sudden surge, making it difficult to determine the duration of volatility.
--------------------------------------------
#XRPUSDT
The key is whether the price can find support at key support and resistance levels and rise above 2.9092.
------------------------------------------
Ultimately, trading will be based on the support and resistance levels drawn on the 1M, 1W, and 1D charts.
However, it is recommended to use auxiliary indicators to confirm whether to initiate a trade.
The basic trading strategy is to buy in the DOM(-60) ~ HA-Low range and sell in the HA-High ~ DOM(60) range.
However, if the price rises in the HA-High ~ DOM(60) range, a step-up trend is likely, while if the price falls in the DOM(-60) ~ HA-Low range, a step-down trend is likely.
Therefore, a fractional trading strategy is recommended.
In this context, the coin (token) currently closest to buying is XRP.
-
Thank you for reading to the end.
I wish you successful trading.
--------------------------------------------------
AUDNZD - the squeeze will soon end.We have witnessed how this pair has been in a squeeze to the downside for over 2 weeks. The highs have been consistently lower while the bottom (yellow) zone around 1.130 has been firmly holding price above it. This will change soon as price breaks below this zone.
We can trade the break out (below) or wait for a retest; depends on our own trading style and preference. Either way, hopefully this will be a good trade with positive risk/reward.
This is not a trade recommendation; it’s merely my own analysis. Trading carries a high level of risk so carefully managing your capital and risk is important. If you like my idea, please give a “boost” and follow me to get even more.

ElDoradoFx PREMIUM – GOLD ANALYSIS (28/10/2025, ASIA SESSION)Gold closed the US session around 3,982 after extending its sell-off from 4,048, confirming strong bearish continuation from the 4,38x top. The current structure remains heavy, with the H1 100/200 EMA acting as dynamic resistance and repeated rejections near 3,997–4,002.
Momentum indicators across intraday timeframes still favor sellers, but Asia may open with a brief corrective retracement before the next bearish leg toward 3,958–3,945 liquidity zones.
⸻
2️⃣ Technical Breakdown
🔹 Daily (D1)
• Third consecutive bearish daily candle confirming continuation of the mid-term correction.
• Price now trades around 3,982, testing the mid-range zone between 3,880–4,020.
• RSI slipping near 50, signaling room for more downside before oversold conditions.
• MACD histogram remains negative but moderating — corrective phase within broader uptrend.
🧭 Bias: Bearish continuation inside medium-term correction; key support 3,880.
⸻
🔸 1H Chart (H1)
• Structure: Clear lower highs from 4,12x → 4,072 → 4,048 → 3,997.
• Strong break of structure below 3,985 → 3,971 confirms downtrend intact.
• Price remains below all EMAs and the descending trendline.
• RSI ~37 (slightly oversold); MACD momentum still negative.
📉 Intraday Bias: Bearish below 4,021; corrective only if price reclaims that level.
⸻
🔹 15M Chart (M15)
• Descending channel clearly defined; price rejected twice near 3,997–4,002.
• Pullbacks shallow, suggesting weak buyer interest.
• MACD histogram fading after short correction — selling pressure resuming.
⚠️ Short-term Bias: Sell rallies until clean BOS above 4,021.
⸻
🔹 5M Chart (M5)
• Micro downtrend confirmed with CHoCH back to the downside at 3,996.
• Price consolidating near 3,982, forming minor liquidity base pre-Asia open.
• RSI ~36; momentum weak but potential short-term rebound toward 4,000 before next drop.
🔎 Micro Bias: Intraday pullback expected; structure favors new lower high formation near 4,009–4,021.
⸻
3️⃣ Fibonacci Analysis – Golden Zone
Last H1 swing: High 4,048 → Low 3,971
• 38.2% → 3,998
• 50% → 4,009
• 61.8% → 4,021 ✅
✨ Golden Zone = 4,009 – 4,021
This zone aligns with the descending trendline, the H1 EMA cluster, and prior supply rejection — making it the highest-probability short area for continuation.
⸻
4️⃣ High-Probability Trade Scenarios
🟢 Bearish Continuation Setup (Preferred Scenario)
✅ Sell Zone: 4,009 – 4,021 (Golden Zone)
🎯 Targets: 3,985 → 3,971 → 3,958 → 3,945
🛑 Stop-Loss: Above 4,028–4,032
📈 Reasoning: Structural alignment with EMAs, Fib confluence, and trendline resistance.
⸻
⚡ Momentum Breakdown Setup (Continuation Trade)
✅ Sell Trigger: Break & retest below 3,971
🎯 Targets: 3,958 → 3,945 → 3,930 → 3,920
🛑 Stop-Loss: Back above 3,985
📈 Reasoning: Structural breakdown confirmation and liquidity grab continuation.
⸻
⚪ Countertrend Buy Setup (Low Probability)
✅ Buy Trigger: Clean 15M BOS + retest above 4,021
🎯 Targets: 4,034 → 4,048 → 4,072
🛑 Stop-Loss: Below 4,009
📈 Reasoning: Short-term recovery if DXY weakens or liquidity imbalance above 4,02x forms.
⸻
5️⃣ Fundamental Watch
• Asia session quiet: no tier-1 data expected.
• Focus remains on USD index drift and post-US yield sentiment.
• If DXY holds firm above 106, gold downside pressure persists.
• Watch early Shanghai open flows — potential liquidity sweep near 3,971 before NY continuation.
⸻
6️⃣ Key Technical Levels
Type Levels
Resistance 3,997 / 4,009 / 4,021 / 4,034 / 4,048
Support 3,985 / 3,971 / 3,958 / 3,945 / 3,930
Golden Zone 4,009 – 4,021
Break Sell Trigger < 3,971
Break Buy Trigger > 4,021
⸻
7️⃣ Analyst Summary
The market remains structurally bearish across all intraday frames, with strong EMA alignment and trendline rejection confirming continuation bias. Asia session likely sees a corrective bounce into the 4,009–4,021 Golden Zone, where the best-quality short setups align.
Only if buyers reclaim and hold above 4,021 will momentum shift for a potential relief rally toward 4,048/4,072. Otherwise, expect renewed pressure targeting 3,971 → 3,958 → 3,945.
⸻
8️⃣ Final Bias Summary
📉 Primary Bias: Bearish → Sell rallies into 4,009–4,021
📈 Secondary Bias: Bullish only above 4,021 (retested hold)
🎯 Targets: 3,985 → 3,971 → 3,958
✨ Golden Zone: 4,009 – 4,021
🛑 Invalidation: H1 close above 4,032
⸻
🥇 ElDoradoFx PREMIUM 2.0 – PERFORMANCE 27/10/2025 🥇
📅 Smart setups. Steady profits.
━━━━━━━━━━━━━━━
🔻 SELL +220 PIPS
🟢 BUY +145 PIPS
❌ BUY -60 PIPS (SL)
🔻 SELL +210 PIPS
━━━━━━━━━━━━━━━
💰 GOLD TOTAL PIPS WON: +515 PIPS
📊 4 Trades → 3 Wins | 1 SL
🎯 Accuracy: 75%
━━━━━━━━━━━━━━━
🔥 Solid and precise session — trend moves respected technical zones perfectly.
👏 Congratulations if you profited! ✅✅✅🚀🚀🚀

BTCUSD 4H Analysis: Eyes on a Bearish Setup!📉 BITSTAMP:BTCUSD 4H Analysis: Tapping the Bearish FVG — Liquidity Sweep Incoming!
The recent strong move up appears to have run its course, hitting a critical institutional point of interest.
The Setup: Rejection at the FVG
Price has aggressively tagged the 4-hour Bearish Fair Value Gap (FVG) and shown an immediate, sharp rejection. This zone, just under the $115,000 level, acts as our primary ceiling and a high-probability reversal area according to Smart Money Concepts (SMC)/ICT.
Key Observation: The candle wick into the FVG confirms that the institutional selling pressure is holding this range.
Bias & Targets
My bias is distinctly Bearish as long as the high of the FVG remains intact. We are now targeting liquidity below:
Intermediate Target (Initial Sweep): The first magnet is the Sell-Side Liquidity (SSL) marked around $113,106.96. This is a high-probability target to clear out the recent lows.
Confirmation Target (Range Low): A break below the SSL will confirm the continuation of the short-term downtrend, opening the path to the External Range Liquidity (ERL) at the range low, near $112,976.49.
Action Plan
Watch for a small retracement into the Bisi (Buy-Side Imbalance/Sell-Side Inefficiency) near $114,147.60 before the market commits to the next significant drop. The path of least resistance is now to the downside to sweep those stops!
Invalidation: A sustained break and close above the 4H FVG high.
What are your thoughts on this structure? Drop a comment below!
Greetings,
MrYounity

gold analysis 30/9/2025 ( The Gold Map )Based on gold analysis using My own strategy that I use digital analysis combined with mathematics and physics :
Selling Zones :
3869 - 3881
3901 - 3922
3936 - 3951
3976 - 3994
4008 - 4020
4033 - 4056
4101 - 4118
4137 - 4157
4187 - 4202
4264 - 4285
4346 - 4362
buying zones
3778 - 3764
3751 - 3761
3717 - 3738
3693 - 3710
3670 - 3688
3654 - 3668
3636 - 3648
3612 - 3628
3596 - 3607
3561 - 3579
3503 - 3523

Nvidia Downside. No clue. Upside levels to hit Break out here Above $191.83 ^ 193.03 ^195.67 Downside. I don't have a clue. You wonder, can it stay bullish forever? Seasonality might play a role also. The fair value GAP Thanks to ICT. That the price Range that occupies right now. that is in. Needs to. break above that. And the fib top. For play, but that's for sure sign. I guarantee IT To run out the highs. No reason for me to think otherwise. NASDAQ, S&P Keep walking up the steps. Mark IT DOWN smoky. This is risky, I know, but ICT might even play it to the downside. At this point, if it cannot break out191.64 This technique was all designed for playing futures NQ & ES And forex But he taught me it can be used on everything Algorithmics 101manipulation 101 also.#NVDA2THEMOON

Expecting the worst. Hoping for the best.We have an engulfing candle on the monthly. Definitely a bearish candle on the weekly in the past weeklies. It only had known the first of the year. To put everything in the gold. I would be 2x richer. Than I was. Than I am. Brace for the pullback. Short GDX late if you want to. It always lags. Zoom out. Check out the 15 Minute check it all. It's not looking good.
