A bull flag as I used to learn itWill it make up for yesterday's damage in 1 day? This perfect bull flag says yes
Beyond Technical Analysis

FACT CHECK: The "$8k MicroStrategy Liquidation" is a Lie.Stop panic-selling your Bitcoin because of a rumor.
Everywhere on the timeline, I see the same copy-paste FUD: "If Bitcoin hits $8,000, Saylor gets liquidated and BTC goes to zero."
I just finished a forensic audit of Strategy Inc.'s Q4 2025 filings.
Here is the Institutional Reality vs. The Retail Myth.
__________________________________________________________________________________
1. THE MYTH: "Saylor has a Liquidation Price at $8k." 🧟♂️
THE TRUTH: This number is Rhetorical, not Contractual .
* Origin: This figure came from a "Stress Test" comment by the CEO, illustrating where Assets would equal Liabilities. It is NOT a loan trigger.
* The Structure: MSTR retired their secured loans (Silvergate) years ago. Their current debt is Unsecured Convertible Notes (due 2027-2032).
* The Key Difference: Unsecured notes have NO Liquidation Trigger . They cannot be margin called based on price price.
2. THE SAFETY NET ($2.25 Billion Firewall) 🛡️
Even if Bitcoin goes to $20k, MSTR does not have to sell a single Satoshi.
* Cash Reserve: They hold $2.25 Billion USD in cash.
* Runway: This covers all interest payments through mid-2028 .
* Conclusion: They can survive a multi-year Crypto Winter without forced selling.
__________________________________________________________________________________
3. THE REAL "PAIN POINT" (It's not $8k) ⚠️
The real risk is not Liquidation; it is Stagnation .
* MSTR Avg Cost: $76,052
* Current Price: ~$70,000
* Status: UNDERWATER.
The risk isn't that they *sell*; it's that they can't *buy* anymore. The "Infinite Money Glitch" (issuing stock to buy BTC) breaks when the stock trades below NAV. This removes the biggest buyer from the market.
4. THE ODDS OF $8K? (<1%) 📉
We analyzed the Dec 2026 Derivatives Market .
* Smart Money Positioning: Massive "Put Wall" (Hedging) at $50,000 .
* The Void: There is near-zero open interest below $30k.
* Implied Probability: The market prices a drop to $10k at <1% .
__________________________________________________________________________________
🎯 THE VERDICT
The "$8k Liquidation" is a ghost story from 2022.
* Risk of Liquidation: 0% (Structure is Unsecured).
* Risk of Stagnation: High (Until we reclaim $76k).
* Major Support: The 200-Month Moving Average is at $58,000 . That is the real floor.
Don't trade the FUD. Trade the Structure.
Which side are you on?
A) Believing the FUD (Target $8k) 🐻
B) Buying the Value (Target $58k) 🐂

Bitcoin’s V-Bounce Raises Red Flags! Short Squeeze or Real BottoBTC Today: Short Squeeze or Real Bottom? Why This Move Might Be a Trap
Today’s Bitcoin move has sparked optimism across the market. After dipping into the ~60k region, BTC aggressively squeezed higher, reclaiming key levels around 68k–71k in a short amount of time. Many are already calling this “the bottom.”
But if you zoom out and study Bitcoin’s historical behavior, this move looks far more like a short squeeze than a confirmed cycle low.
Why Today’s Move Looks Like a Short Squeeze
The rally came after:
A sharp sell-off into a well-known high-liquidity demand zone (~58k–60k)
Extremely bearish sentiment
Heavy short positioning after multiple breakdowns
This is the perfect environment for a squeeze:
Shorts pile in late
Price hits a major level
Market snaps higher as shorts cover and late longs FOMO
Short squeezes are fast, emotional, and convincing — exactly like what we saw today.
The Historical Problem: BTC Rarely Bottoms With a V-Shaped Recovery
Here’s the key issue:
Bitcoin almost never forms a macro bottom with a clean V-shaped recovery.
Across prior cycles:
Bottoms are formed through chop, retests, and boredom
Price usually revisits the lows at least once
Structure builds slowly, not explosively
The only major exception was the COVID crash, which was driven by:
Emergency global stimulus
Forced liquidations across all markets
Extreme external intervention
Outside of that event, V-shaped BTC bottoms are not the norm.
Why This Move May Be Creating False Hope
Markets often rally just enough to:
Convince traders the worst is over
Pull sidelined money back in
Force shorts to exit
This creates hope, which is a powerful tool.
But hope-driven rallies inside broader corrective structures often lead to:
Lower highs
Failed breakouts
A return to sweep remaining liquidity
And right now, there is still significant liquidity resting below 60k.
Why the “Real Move” Often Happens on the Weekend
Another pattern worth noting:
Bitcoin frequently makes decisive moves during low-liquidity periods
Weekends are notorious for:
Stop hunts
Fake breakouts
Sharp reversals when participation is low
If the market truly wants to reset positioning, a weekend move that:
Reverses lower
Sweeps liquidity below 60k
Forces maximum pain
…would be completely in line with historical behavior.
Key Levels to Watch
Resistance: 71k–72k (squeeze extension zone)
Support: 68k, then 66.8k
Liquidity magnet: sub-60k
As long as BTC remains below major weekly resistance, today’s move should be treated with caution.
Final Thoughts
This rally does not need to fail immediately to still be a trap.
Short squeezes can extend, consolidate, and then reverse.
Until Bitcoin:
Holds higher lows on higher timeframes
Reclaims and sustains key weekly levels
Stops reacting violently to liquidity
…it’s premature to declare the bottom is in.
Hope rallies feel good. Real bottoms feel boring.
Stay patient. The market may still have unfinished business below.

BTC actually Bullish IMOI get everyone is bearish on BTC and for all the right reasons. It lost support after support. But if you check supply profit/loss we are in a stage where honestly I really DONT SEE how whales and institutions will not fill their bags at this low prices similar to december 2018. Its common sense IMO. For me, this looks very bullish.

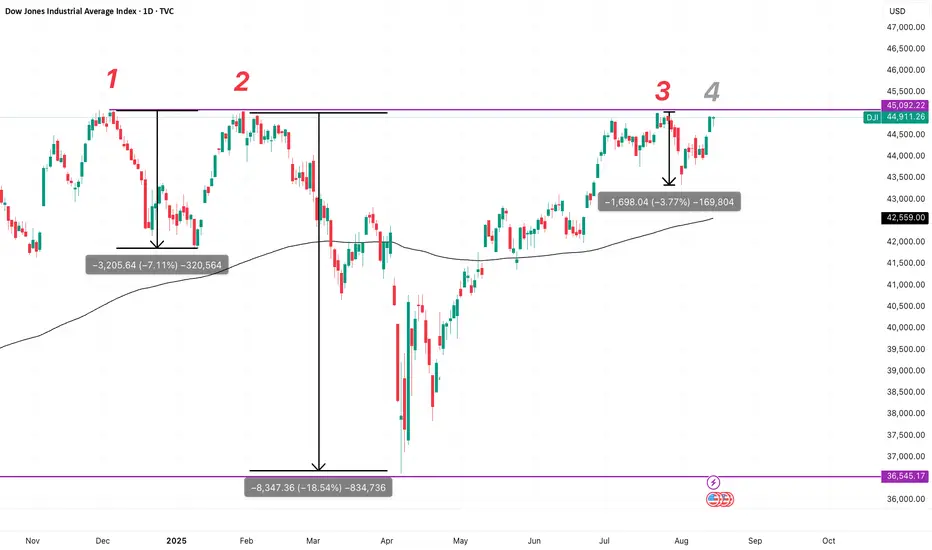
Dow: Fourth Attempt at the CeilingThree times since late 2024, the Dow has run head-first into the same resistance zone around 45,092 — each time pulling back, but each time finding higher lows and quicker recoveries.
Now we’re at attempt #4. The prior pullbacks have been smaller, and breadth is improving — only 5 out of 30 Dow components are negative since December 24, 2024.
Yes, there are plenty of unknowns — macro headwinds, earnings gaps, global geopolitical and tariff risks — but the chart says one thing loud and clear: the bulls are still in control.
A clean breakout here could open the door to new highs. Until proven otherwise, momentum belongs to the buyers.
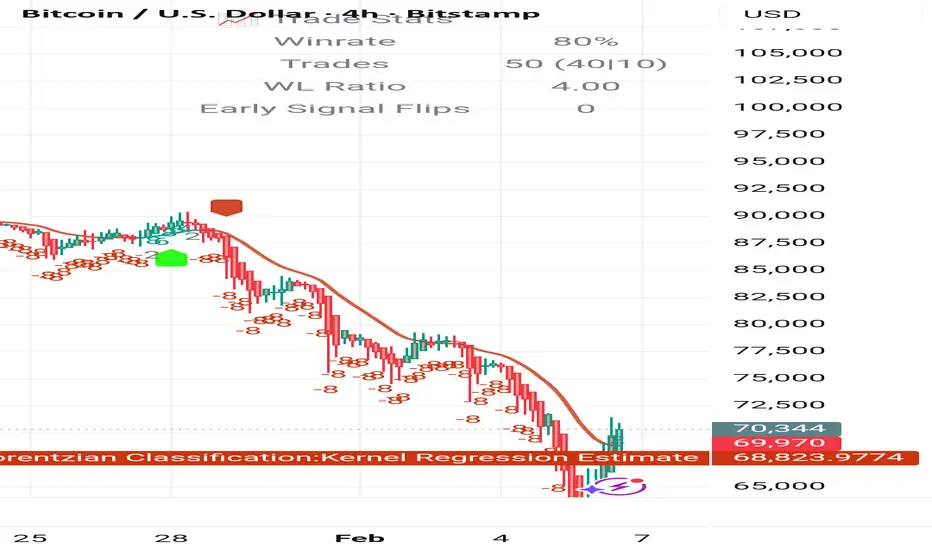
New Buy SignalBASED off our AI trading signals we have a very early BUY signal.
The number generated was a very low number between 0 to 2. We will exit when it gets into the 8 area.
All the crypto are up today.
AUD/JPY Swing Trade ShortI am looking for a reason to swing trade this pair short, perhaps a change such as this weeks snap election in Japan will cause at least a short term reversal here at a key level.

BUY $FIGStarted buying today.
Happy to buy any levels below 30 for a long-term hold.
I like the CEO and like the future prospects here.
GL!

BTC — Global Outlook | MTF 1M → 1W → 1DBTC — Top Pick | Higher-Timeframe Short Context
Counter-trend correction within a bearish MTF structure
🔎 Overview
BTC is trading within a higher-timeframe bearish structure .
Liquidity sweeps, imbalance inversions, and divergences on 1M and 1W suggest the market is transitioning from expansion into a corrective phase , with priority toward discount pricing .
The current upside move on 1D is treated as a counter-trend correction , not a trend reversal.
📌 Higher-Timeframe Context (1M → 1W)
Monthly (1M):
Monthly liquidity swept
Bearish divergence confirmed
Bullish Monthly Imbalance inverted → Bearish Monthly Imbalance formed
Overlap creates a BPR resistance zone , from which price is currently reacting
Monthly downside focus:
OF: 48,900 – 73,900
OB (refined): 52,500 – 66,500
Weekly (1W):
Weekly liquidity swept to the upside
First bullish weekly imbalance inverted
Bearish weekly imbalance confirmed (body close below liquidity)
Price currently reacting from Weekly OF
This supports a corrective market structure aligned with the monthly bias.
📈 Execution Context (1D)
Daily liquidity swept at ATH
Price retraced into Daily Order Flow and is reacting
Local bullish structure supported by spot buying volume
Despite the short-term bullish structure, the move is considered corrective within the higher-timeframe bearish framework.
Expected correction completion zone:
OF 1D: 98,900 – 107,500
4H refinement: 100,700 – 104,000
Within this area, the focus shifts to short-continuation setups targeting higher-timeframe objectives.
❗ Invalidation
Acceptance above 101,500 invalidates:
Weekly and Monthly bearish imbalances
The higher-timeframe short thesis
🧭 Thesis Summary
Higher timeframes remain bearish
Current upside move is a counter-trend correction
Priority is short continuation after correction completion
Bias remains valid below 101,500
💬 Your Thoughts?
If this perspective resonates with you, feel free to share your thoughts in the comments .
Like the idea if you find the analysis useful — it helps the idea reach more traders and supports future updates.
Not financial advice. Educational market structure analysis.

XAGUSD Bullish Price actionLookig for bullish rally...Price manipulated and on Frday we had a sweep of week lows and close back into tha range

My Mapping Process: 𝙼𝚘𝚗𝚝𝚑𝟼 𝚘𝚏 𝚖𝚢 TradingJourney
My Mapping Process
S🎯X Method
📊 𝗦tructure
📌Beyond basic MSS or BOS, I incorporate delta volume and volume profile to understand where price is most likely to expand or distribute.
📌Volume helps filter chart noise and engineered price action, providing context on participation and acceptance rather than prediction.
📌I also validate whether there is resting liquidity in those areas, as meaningful expansion typically requires available liquidity.
🎯𝗘𝗫ecution
📌I focus on valid order blocks and support/resistance aligned with HTF delivery.
📌Not all blocks or HTF levels produce strong reactions, so I confirm these areas using Volume Profile to assess historical response.
📌Liquidity is always evaluated first. Gold often performs different liquidity sweeps before delivering the intended move, so context matters.
📝My confirmation model helps with timing, avoiding entries that are too early or too late, keeping execution precise and controlled.
💸𝗘𝗫it
Take profits are placed at logical price objectives, not fixed R:R targets.
These areas are pre-mapped using Volume Profile and expected mitigation or pullback zones.
This market structure context is based on observed data from volume and price behavior, not on feelings or prediction.
This is the style that fits me best since my entries aren’t designed as tap-and-exit trades.
What matters more to me is seeing my pre-mapped structure play out, my entries being respected, and allowing price to deliver fully into the projected targets.

Silver Quick Update For February PANIC CYCLEFollow me here on TW for my regular critical updates on crypto (BTC, ETH, SOL, MSTR) and metals (GLD, SL, PL) based on Martin Armstrong's Socrates.
Look in my TW Ideas for posts of each market individually.
Something interesting regarding the February PANIC CYCLE in Silver ... yesterday Silver crossed below January's LOW of $71 so, technically it has already fulfilled the PANIC DOWN move... so, is it really going to fulfill the PANIC UP move and cross up $121 in February? that'd be nuts.
The next 3 weeks are VERY STRONG, especially this coming week and February 23rd so... I guess the energy will be there to make it happen.
We'll find out soon enough 😮
Good luck and stay safe! 🙏🏻

AUDUSD BuysAUDUSD is bullish. I'm anticipating a pullback into the marked area, which has multiple confluences (key level, EMA, Fib level).

Nvidia - This stock remains quite weak!🔮Nvidia ( NASDAQ:NVDA ) could still drop about -20%:
🔎Analysis summary:
While the entire stock market is heading for new all time highs, Nvidia is still consolidating. Considering the recent retest of the major resistance trendline, Nvidia remains quite weak. Maybe we will even see a short term -20% drop in the near future.
📝Levels to watch:
$150
SwingTraderPhil
SwingTrading.Simplified. | Investing.Simplified. | #LONGTERMVISION

BTC Major level to hold.BTC Major level to hold. Huge level we are testing. Needs to hold or going lower.

I Trade Asia I trade Asia only for intra day trading and there are a few reasons for this.
1. No news or data releases to interfere with the setup or trade.
2. Being in North America, the Asian session starts after dinner which means the vibe is a lot calmer because the busy business day is over. Less fear in the air.
3. The capital flow from the second half of the USA session almost always offers at least 1 small leg, so i just look for a countertrend sweep and a double candle entry back with the capital flow i mentioned earlier. Risk 1 to win 2.
4. I use the 5 min chart to identify HH HL or LL LH

SPY Flow-Derived Directional Forecast | Feb 6 → Mar 20, 2026SPY Flow-Derived Directional Forecast | Feb 6 → Mar 20, 2026
Overview
SPY closed at $686.13 after printing a $680.85 low — testing the 0.786 Fib ($680.32) before bouncing. Price is now trapped between the 0.447 Fib ($687.53) and the 0.618 ($683.88). The daily candle shows a long lower wick, suggesting short-term demand absorption — but the structure remains distributive.
This analysis combines Fibonacci extension mapping with conviction-weighted institutional options flow to build a one-directional time series forecast.
Methodology
I analyzed 14,060 options trades ($1.78B total premium) from today's session. For each SPY put bought aggressively at ask (directional bearish), I extracted the strike price, premium size, expiry date, and conviction score (0-1). The forecast path is the conviction-weighted average strike target at each expiry window:
Weighted Target = Σ(Strike × Premium × Score) / Σ(Premium × Score)
This gives us where institutional money expects price to be, and when.
Flow-Derived Price Path
Feb 6 (NOW): $685-686 — Testing 0.5 Fib ($686.41). Today's bounce from $680.85 aligns with 0.786 support.
Feb 9: $682 — Near-term put target from $2.6M premium weighted at 0.72 confidence. The 0.702 Fib ($682.15) is the equilibrium level.
Feb 11-13: $677-679 — Anchored by the highest conviction trade in the entire dataset: $677P March 20, $2.84M swept ABOVE ASK, Score 0.89. This aligns with the 0.886 Fib ($678.20). Jobs report rescheduled to Feb 11 — potential catalyst.
Feb 20: $670 — Feb 20 expiry conviction-weighted target. $1.4M premium. Aligns with 1.236 Fib ($670.79).
March 6: $665 — Deceleration zone. 1.5 Fib ($665.21) confluence.
March 20 (OPEX): $662.56 — Terminal target. This is where the heaviest institutional positioning sits: $12.8M in March 20 puts with a C/P ratio of 0.26 (extremely put-heavy). Aligns with 1.618 Fib ($662.71).
Key Flow Data
SPY P/C Ratio: 1.74
Index P/C (SPY+QQQ+SPX combined): 1.37
March 20 SPY C/P: 0.26 — the real institutional battleground
Highest Conviction Trades (Score ≥ 0.7):
• $677P Mar 20 — $2.84M above ask (Score 0.89)
• $650P Mar 20 — $2.71M above ask (Score 0.79)
• $650P Mar 20 — $1.41M above ask (Score 0.77)
• $590P Mar 20 — $642K above ask (Score 0.73) — crash insurance
Institutional Put Strike Clusters (bought at ask):
$650P: $7.3M total
$677P: $3.7M total
$675P: $3.6M total
$685P: $5.5M total
$660P: $1.2M total
Put Profit-Taking (sold at bid):
$690P: $6.1M — closing positions from higher
$700P: $1.6M — taking gains
$683-684P: heavy selling
This tells us institutions are ROLLING — banking profits on puts entered at higher strikes, redeploying capital into $650-677 for March. Controlled, methodical, still bearish.
The Nuance: Net Directional Flow
Here's what most flow accounts won't tell you: when you decompose by execution side (puts bought at ask + calls sold at bid = bearish; calls bought at ask + puts sold at bid = bullish), the NET directional flow on SPY is actually +$4.9M bullish. The raw P/C of 1.74 is inflated by put profit-taking.
But March 20 is unambiguous. $20.1M puts vs $5.2M calls. That's where the real money is aimed.
Bullish Counter-Signals to Monitor:
• TQQQ: $38M in $48C Jan '28 LEAPS bought at ask — someone calling this a 2-year buying opportunity
• NVDA: $108M calls (C/P 4.16) — dip buying ahead of Feb 25 earnings
• SLV/GLD: $72M combined calls — metals bounce play
Technical Confluence
Fib Extension Targets (chart attached):
0.702 ($682.15) — equilibrium, tested today
0.886 ($678.20) — aligns with $677P flow target
1.0 ($675.79) — round number psychological
1.236 ($670.79) — Feb 20 flow target
1.382 ($667.70) — intermediate
1.618 ($662.71) — March OPEX flow target
2.0 ($654.62) — $650P cluster ($7.3M)
Every major Fib extension maps to a flow target. That's not coincidence — it's where algorithms and institutional desks anchor their positioning.
Macro Context
AMZN guided $200B capex for 2026 vs Street's $146.6B — stock down 8%
GOOGL guided $175-185B capex — AI spending panic accelerating
BTC crashed to ~$63K — down nearly 50% from October highs
Silver -20% on Thursday — margin call cascade
iShares Software ETF (IGV) -20% YTD — AI disruption repricing
January jobs report DELAYED due to government shutdown — removes near-term data floor
Scenario Analysis
Bear Case (Primary — 65% probability):
Fail to reclaim $687.53 (0.447 Fib) → grind to $677-679 by Feb 13 → acceleration through $675 → $662-665 by March OPEX. Institutional target zone: $655-668.
Bull Case (Invalidation — 35%):
Reclaim and hold above $690 on daily close. Would indicate the $680.85 low was the washout. Watch for put unwind at $690+ strikes as confirmation. Invalidation of bearish thesis: daily close above $697.
Key Levels
Resistance:
$687.53 — 0.447 Fib (bull/bear line)
$690-693 — call cluster + put profit-taking zone
$697 — thesis invalidation
Support:
$683.88 — 0.618 Fib
$682.15 — 0.702 Fib (equilibrium)
$678.20 — 0.886 Fib ($677P flow target)
$675.79 — 1.0 Fib
$662.71 — 1.618 Fib (March OPEX target)
Risk Management
Oversold conditions are developing — RSI compression visible. Dead cat bounces are probable. Any relief rally into $688-693 = reload opportunity for bearish positioning. Dated structures (Feb 20+) preferred over 0DTE. The market can stay irrational, but the flow doesn't lie about where the money is aimed.
Bias: Bearish below $687.53
Invalidation: Daily close above $697
Primary Target: $662.56 (March 20 OPEX)
Secondary Target: $654.62 (2.0 Fib / $650P cluster)
Not financial advice. Manage risk accordingly.
#SPY #TechnicalAnalysis #OptionsFlow #FibonacciExtension #SmartMoney #InstitutionalFlow #VolanX #WaverVanir

Eth Enters Buy ZoneAs mentioned in my first post (which you can find attached), it is my belief that this is the crypto bear market year.
The featured chart includes my own logarithmic regression bands fitted to the price, with an overlay of the ETH/BTC chart. I believe this model provides useful price ranges for buy zones, currently around $1,910.6. Because ETH is still a relatively new asset, this regression band offers a reasonable fit for its growth, and therefore helps identify areas of opportunity.
However, it is also important to consider the performance of BTC when manoeuvring the cryptocurrency asset class. The blue ETH/BTC graph clearly shows an outperformance of BTC since the 2022 bear market, and as we enter the 2026 bear market I believe this trend will continue. BTC.D should keep respecting the support line, as monetary policy is not yet favouring altcoins and could head higher as BTC outperforms on both sides of the market.
As a result, my portfolio will mainly be aimed at accumulating BTC over the bear market (50% BTC), with a smaller allocation to ETH (35%).
The purple box represents an area of support for ETH/BTC, where ETH could finally reverse in the later part of the year as monetary policy improves.
To conclude:
-Crypto remains in a bear market, and the four-year cycle still appears to be intact.
-BTC.D should keep rising as people mainly buy Bitcoin dips and sell alts.
-ETH enters a buy zone.
-BTC enters a zone of interest (below $65k) and should head lower into a buy zone (200W SMA) after a possible counter-trend rally.
Additional notes:
I will be working on more free scripts, which will be discussed in the future.

BTC - Future Predictive Modeling This is a highly speculative post and just a hypothesis of what BTC may do based on time and price. Just an idea… for now :)
BTC has recently put in a decisive bottom around $60,800. Already, price has seen an 18% increase in less than 24 hours.
Market makers have seemingly front-run the most important structural level for BTC. Therefore, it is still possible that this level gets reached, which is why I wanted to create this predictive modeling idea.
This important structural level for BTC is either around $58k or slightly below. Arguably, BTC’s most important moving average is the weekly 200 MA, which currently sits around $58,000. The other key level is the 0.618 golden ratio of the entire macro cycle (from $15.4k to $126.2k). That Fibonacci level sits just slightly below $58k, giving us a very strong double confluence—an area where algos and market makers would be eager to scoop up BTC.
If this is the case, here is how price action might develop to make that scenario a reality:
1st, BTC sees a continuation of this move and rallies toward $74,500. From there, we would expect a pivot high to form somewhere between $74,500–$80,800, with the sweet spot being around $78,500. If price creates a pivot high in this range, it would be viewed as macro old support flipping into new resistance.
2nd, sellers would take control at the pivot high and begin the next leg to the downside, bringing price back down to $58k or slightly lower, creating another lower low.
3rd, while price makes a lower low, we would expect the weekly RSI to either make an equal low (double bottom) or a higher low. This would create a weekly bullish divergence, validating strong buyer demand at the predicted price level.
Finally, price would rally off this level and fake out the market by reclaiming the old resistance zone ($74,500–$80,800) as new support, then continue higher to the next lower high between $83,400–$89,500. Another honorable mention is price simply double-topping at the new resistance level (around the price that established the first test of resistance). Either scenario would kick off the next leg of the bear market, with the series of lower lows and lower highs continuing.

Ethereum: Three Year Outlook~1 year of consolidation/accumulation during the BUILD phase of major tokenization projects. (eg. Blackrock, Fidelity, Robinhood, JPMorgan)
Followed by a breakout coinciding with tokenized market products releases (2027/28)
Shortly After BTC/ETH open interest will wane then crash during a macro ETH bull run in 2028/29 with majorshort liquidations. Ripples will be felt across the bitcoin community with psychology entering the "flippening" territory.

Great Trade! Lost $300How can a trade be great with a $300 loss? When you follow your plan and wait for your setup. Yes, I could've done things differently, and I might next time this setup happens, but this trade checked all my boxes.
Remember, tight stops and generous targets is how you'll pass your eval and/or get funded and/or stay funded.

QQQ Weekly Outlook – Week 5 of 2026 (Feb 02–06)QQQ Weekly Outlook – Week 5 of 2026 (Feb 02–06)
Weekly Recap
Last week, the market followed our bullish framework perfectly. QQQ fully respected the bullish scenario, delivering a clean and profitable week. The market opened with a gap up and reached all bullish targets, allowing positions to be closed in profit.
After hitting those targets, price moved back into a range and started to show some retracement following the Mid Week update. I’m also sharing last week’s QQQ Weekly Outlook on the side for reference.
At this stage, I see increasing indecision in the market. Below, I’m outlining my strategy to navigate this uncertainty.
Scenarios – Prediction
Scenario: The Range
At the moment, I do not see a clear directional bias. Price is trading between well defined key levels, and I expect range behavior unless those levels are decisively broken.
My base case is a range bound market, where price reacts from the Range High and Range Low zones and rotates back into the range.
Deviations into these areas followed by a close back inside the range would keep price compressed within its internal structure. A strong break and acceptance beyond the range boundaries would signal the market’s true directional bias.
Key Levels to Watch / Trade
Range High: 636.5
Range Low: 607 – 599.5
Mid Range / Internal Liquidity: 630 – 618
Game Plan
If price sweeps liquidity at one of these key levels and then closes back inside the range, I will look to trade in the opposite direction of the liquidity grab.
The core idea is to fade moves where traders get trapped thinking the level has broken, only for price to reverse back into the range.
Example:
If the 618 level gets tapped and price closes back above it with either two 1H candles or one 4H candle, I will treat that as a deviation and look for call side setups.
If, instead, price breaks a key level with strong acceptance and closes firmly above or below it, that would suggest continuation in that direction.
Example:
A strong close below 618 would shift my focus toward the Range Low at 607, where I would look to trade the downside using puts.
Position Management Notes
Positions should only be taken after confirmation, either through a clean break or a clear deviation at key levels. If price closes back against the direction of the expected move, the setup is invalidated and the position should be stopped.
For example, if 618 breaks strongly and I enter short, but price then reclaims 618 with two consecutive 1H closes above it, that would invalidate the short setup and signal the need to exit.
I share deeper US Market breakdowns and weekly scenario updates on Substack. Link is in my profile.
This analysis is for educational purposes only and reflects my personal opinion. It is not financial advice.

BITCOIN (BTCUSDT) – Weekly Trading Plan | through Feb 8🔥 BITCOIN (BTCUSDT) – Weekly Trading Plan | through Feb 8
The week opened in discount prices:
– below the key level,
– with the key level located below the Value Area,
indicating short-side dominance.
The primary weekly bias remains bearish.
Main short scenario:
– target: lower boundary of the weekly zone 72,780 – 69,160
At this stage, price has already delivered a strong downside move,
and we are seeing seller capitulation:
Because of this, a corrective long move is possible
toward the key weekly level located in the upper weekly zone,
which acts as a decision-making area.
If sellers regain control in that zone,
the short continuation remains the primary scenario.
If buyers maintain dominance and price accepts above 84,000,
a bullish continuation becomes likely,
with targets at 88,600 – 92,310.
This is not financial advice. Risk management is required.
