AIRBUS - Beyond the Backlog: What the Consensus Is Missing𝗖𝘂𝗿𝗿𝗲𝗻𝘁 𝗣𝗿𝗶𝗰𝗲: €189 | 𝗖𝗼𝗻𝘀𝗲𝗻𝘀𝘂𝘀 𝗧𝗮𝗿𝗴𝗲𝘁: €230 | 𝗠𝗼𝗿𝗻𝗶𝗻𝗴𝘀𝘁𝗮𝗿 𝗙𝗩: €165
𝗞𝗲𝘆 𝗗𝗮𝘁𝗲: February 19, 2026 — FY 2025 Earnings Release
𝗧𝗛𝗘𝗦𝗜𝗦: 𝗧𝗛𝗘 "𝗥𝗘𝗖𝗢𝗥𝗗 𝗕𝗔𝗖𝗞𝗟𝗢𝗚 + 𝗕𝗢𝗘𝗜𝗡𝗚 𝗪𝗘𝗔𝗞𝗡𝗘𝗦𝗦 = 𝗕𝗨𝗬" 𝗡𝗔𝗥𝗥𝗔𝗧𝗜𝗩𝗘 𝗜𝗦 𝗦𝗧𝗥𝗨𝗖𝗧𝗨𝗥𝗔𝗟𝗟𝗬 𝗕𝗥𝗢𝗞𝗘𝗡.
Six months ago, Airbus CEO Faury told the US Chamber of Commerce the supply chain had "changed dramatically for the better." On February 3, speaking at the World Governments Summit in Dubai, he told a different story: engines remain the hardest components to source through both 2025 and 2026. His leaked internal memo to staff, seen by Reuters in late January, warned of "unprecedented crises," "unsettling geopolitical developments," and "significant collateral damage, logistically and financially" from US protectionism and US-China trade tensions. He named Pratt & Whitney and CFM engines as Airbus's "most serious difficulties."
This is not analyst speculation. This is the CEO, on the record and off, confirming the problem persists with no resolution timeline. The stock has dropped €31 from its January 13 all-time high above €220 to €189 today. I believe the repricing has further to go. Here's why.
1. 𝗧𝗛𝗘 𝗕𝗔𝗖𝗞𝗟𝗢𝗚 𝗜𝗦 𝗔 𝗠𝗔𝗥𝗚𝗜𝗡 𝗧𝗥𝗔𝗣
The 8,700+ aircraft backlog looks like a fortress. It isn't. These orders were priced in the 2015–2021 low-inflation era with escalation clauses designed for 1–2% annual cost growth. Actual input costs surged 20%+ cumulatively since 2021.
The result: in 2024, Airbus delivered 31 MORE aircraft than 2023 but EBIT fell 8% and EPS declined 6%. More planes shipped, less money made. BofA's own analysis admits better-priced contracts won't dominate until 2028+. That's two more years of structurally compressed margins.
Meanwhile, with a 10-year delivery queue, customers have zero urgency. Delta's CEO publicly stated Delta "will not be paying tariffs" on Airbus deliveries, effectively telling a "supply-constrained monopolist" to absorb costs or lose the order. That's not duopoly pricing power. That's a buyer's market disguised as a seller's market.
2. 𝗕𝗢𝗧𝗛 𝗘𝗡𝗚𝗜𝗡𝗘 𝗢𝗣𝗧𝗜𝗢𝗡𝗦 𝗔𝗥𝗘 𝗙𝗔𝗜𝗟𝗜𝗡𝗚, 𝗔𝗡𝗗 𝗔𝗜𝗥𝗕𝗨𝗦'𝗦 𝗢𝗪𝗡 𝗟𝗘𝗔𝗗𝗘𝗥𝗦𝗛𝗜𝗣 𝗦𝗔𝗬𝗦 𝗦𝗢
This is the most underappreciated risk, and Airbus's own management is now confirming it publicly.
On January 12, departing commercial aircraft CEO Christian Scherer told reporters that A320-family engines continued to arrive "very, very late" throughout 2025. His exact words: "We see that this trend continues in 2026, and in particular with Pratt & Whitney, with whom we are still in discussions." He then revealed that Airbus and P&W have not even agreed on engine supply volumes "for the foreseeable future." That's not a supply chain hiccup. That's a fundamental breakdown in planning between a manufacturer and one of its two sole-source engine suppliers.
Three weeks later, Faury confirmed it again in Dubai: engines are the most difficult components to procure in both 2025 and 2026. In his internal memo, he went further, naming both P&W and CFM as the company's "most serious difficulties."
Now look at the specifics.
On the Pratt & Whitney side: 835 aircraft grounded globally, 38% of the PW-powered A320neo fleet out of service, 300-day shop visits, recovery timeline extending to 2030 per P&W's own admission. Air Astana's CEO called it "a significant overall design problem," not a temporary recall.
On the CFM side, the supposed "safe choice" now on 75% of A320neo orders: HPT blades wearing prematurely in hot/dusty environments. Fuel nozzle coking issues. The durability fix was only certified December 2024. Q1 2025 LEAP deliveries fell 13% YoY. British Airways' CTO revealed that NONE of their engine deliveries arrived on schedule in 2025.
Airbus had 60 fully assembled "gliders" sitting in storage waiting for engines at the middle of last year. Scherer said the number is now "low" and "manageable," but only because Airbus cut its delivery target from 820 to 790 in the first place.
The 75/month A320 production target for 2027 requires roughly 150 engines/month from two suppliers who can't meet current demand and haven't committed to future volumes. The A220 needs 14/month to break even, already delayed to end-2026, currently at around 12.
3. 𝗦𝗜𝗫-𝗬𝗘𝗔𝗥-𝗢𝗟𝗗 𝗣𝗟𝗔𝗡𝗘𝗦 𝗕𝗘𝗜𝗡𝗚 𝗦𝗖𝗥𝗔𝗣𝗣𝗘𝗗 𝗙𝗢𝗥 𝗣𝗔𝗥𝗧𝗦
This is the chart that should terrify Airbus investors: two GTF engines leased separately at $250K/month each = $500K. Leasing the entire aircraft with engines = $460K. The engines are worth more than the plane.
Six-year-old A321neos are being dismantled in Castellon, Spain. EgyptAir sold its entire 12-aircraft A220 fleet for around $300M when the list price was over $1 billion. SWISS grounded its entire A220-100 sub-fleet to cannibalize engines for its A220-300s. Air Austral is retiring its A220s by summer 2026, with aircraft averaging 4.5 years old.
When your product is worth more dead than alive at age six, your business model has a problem.
4. 𝗦𝗔𝗙𝗘𝗧𝗬 𝗖𝗥𝗘𝗗𝗜𝗕𝗜𝗟𝗜𝗧𝗬 𝗜𝗦 𝗘𝗥𝗢𝗗𝗜𝗡𝗚
In November 2025 alone:
• 𝗘𝗟𝗔𝗖 𝗿𝗲𝗰𝗮𝗹𝗹: roughly 6,000 A320-family aircraft (60% of global fleet) grounded after an uncommanded pitch-down on a JetBlue flight injured 15. Airbus blamed "solar radiation." Engineers note the fix was literally rolling back to previous software; the new version introduced the vulnerability. Largest single-model recall since 737 MAX.
• 𝗔350 𝗳𝗹𝗶𝗴𝗵𝘁 𝗰𝗼𝗻𝘁𝗿𝗼𝗹 𝗔𝗗: FAA mandated software updates after hydraulic fluid contamination could cause uncommanded rudder/elevator movements, bypassing pilot overrides.
• 𝗔320 𝗳𝘂𝘀𝗲𝗹𝗮𝗴𝗲 𝗽𝗮𝗻𝗲𝗹 𝗱𝗲𝗳𝗲𝗰𝘁: Flawed panels from a Spanish supplier forced delivery target cut from 820 to roughly 790. Scherer said the panel issue, not engines, was what ultimately caused the missed target.
• 𝗚𝗧𝗙 𝗰𝗼𝗹𝗱-𝘄𝗲𝗮𝘁𝗵𝗲𝗿 𝗿𝗲𝘀𝘁𝗿𝗶𝗰𝘁𝗶𝗼𝗻𝘀: New takeoff limitations under freezing fog for PW-powered aircraft.
All in the same month. The A350 also has ongoing weather radar reliability issues (Honeywell fix not available until mid-2026), the unresolved Qatar Airways paint/skin degradation dispute, and A350 deliveries that stagnated in 2025 due to fuselage section problems inherited from Spirit Aerosystems.
5. 𝗖𝗢𝗠𝗣𝗘𝗧𝗜𝗧𝗜𝗩𝗘 𝗟𝗔𝗡𝗗𝗦𝗖𝗔𝗣𝗘 𝗦𝗛𝗜𝗙𝗧𝗜𝗡𝗚
Faury publicly acknowledged COMAC as a "serious long-term competitor" in both his February 2026 Dubai appearance and the January memo. At Dubai he conceded there is "probably room for other players" given the level of demand. That's a striking concession from a duopoly incumbent. China is the world's second-largest aviation market and historically Airbus's largest single-country customer. COMAC has 1,000+ C919 orders, almost entirely Chinese airlines. Meanwhile, Faury has reportedly conceded defeat on net new orders after a wave of Boeing deals tied to US foreign policy tours.
Boeing remains wounded but the 737 MAX uses only LEAP-1B. It completely avoids the GTF contamination crisis. If Boeing stabilises production, it competes with a cleaner engine story.
𝗕𝗢𝗧𝗧𝗢𝗠 𝗟𝗜𝗡𝗘
At €189, Airbus trades at roughly 37x trailing earnings for a company whose own CEO privately warns of "unprecedented crises" and publicly confirms engine shortages will persist through 2026, whose departing commercial chief admitted engines arrive "very, very late" with no supply agreement in place for the foreseeable future, whose margins are compressing despite growing deliveries, whose aircraft are being scrapped at age six for parts, and whose safety record just suffered its worst month since the A320 entered service.
The consensus €230 target assumes none of these structural issues matter. Morningstar at €165 assumes they do. The February 19 earnings will determine which narrative wins.
I'm watching the €185 zone. If that breaks, the market is pricing structural, not cyclical, risk.
Beyond Technical Analysis


BCHUSDT Daily Chart Confluence | Compression at Value Signaling On the daily timeframe, BCHUSDT is presenting one of the cleanest and most compelling multi-factor confluence zones I have seen in some time. While broader market narratives continue to shift, this setup stands largely on its own technical merits.
From an Auction Market Theory perspective, price is currently rotating directly at fair value, with multiple independent frameworks aligning in the same area.
Key Daily Confluences:
- Golden Fibonacci retracement acting as structural support
- Point of Control (POC) from the larger volume profile, confirming acceptance and balance
- Wedge compression, with price coiling near the center of distribution
- Highest concentration of historical daily price interaction
- Volume-weighted delta moving average holding as equilibrium
- CBD alignment, reinforcing value acceptance rather than rejection
- VWAP overhead, creating a clear inflection reference
It is rare to see this many orthogonal technical inputs converge simultaneously on a daily chart. Historically, BCH does not remain at a major POC for extended periods, especially within a compression structure. The longer price accepts here, the more energy is stored for expansion.
*Market Structure and Regime Context*
From a regime and trend-confirmation standpoint, this structure resembles a late-stage balance rather than a breakdown. Compression within a wedge, while anchored at value, typically resolves via directional expansion, not continued chop.
While BCH often correlates with Bitcoin, it is also one of the few large-cap assets that periodically decouples, which makes it particularly interesting at structural inflection points. If Bitcoin completes its broader right-shoulder formation, BCH is positioned to either front-run or amplify the resulting move.
*Levels That Matter*
Bullish acceptance above ~666
Acceptance above this level opens the door for range expansion higher, with momentum likely accelerating quickly due to the prolonged squeeze.
Failure below ~588
Acceptance below this level would invalidate the bullish thesis and signal a potential value migration lower, shifting the auction into a bearish regime.
*Outlook*
This is not a prediction of direction, but a recognition of probability compression. When price is simultaneously pinned by value, structure, volume, and volatility contraction, resolution becomes inevitable.
Given current conditions, upside expansion remains the higher-probability outcome, but price will ultimately confirm through acceptance or rejection at the levels outlined above.
Until then, BCH remains in balance.
Balance precedes expansion.
As always, let price confirm.

Daily open and close don't work... quote XDHi, I’m Maicol, an Italian trader.
I study Gold since 2019.
I need your support.
Leave a like and follow me.
It’s a small thing for you, but important for my work.
Please read the description to understand the trading plan.
Don’t focus only on the chart. Thanks.
Live today at 14:00 CET (Rome time).
🌞 GOOD MORNING EVERYONE 🌞
Gold continued the bearish sequence on the daily, H4, and H1 timeframes.
Even with slightly positive data, the New York session was almost flat.
Price stayed sideways, then formed a bull trap at 17:00.
Exactly on the marked area for a potential sell.
The target was the lower daily level.
Candle open, just below the gap.
Area 4700–4660.
Now the situation is more complex.
That level was reached in a deep way.
We also had a bullish Asian session.
Statistically, Friday tends to be more long than short on gold.
We need to be careful.
No NFP today.
We’ll evaluate together during the US session how to act.
For now, I keep these zones.
See you later live at 14:00.
🔍 Reminder 🔍
I avoid trading during the Asian and London sessions.
I focus on the 14:30 news and the New York open at 15:30.
🔔 Turn on notifications so you don’t miss anything.
📬 If you have any questions, message me. I’ll reply.
🔍 NEXT APPOINTMENTS 🔍
As usual, we’ll be live at 14:00 to follow the market in real time.
In the meantime, have a good day.
-GOOD TRADING
-MANAGE RISK
-BE PATIENT

Others rise is around the corner Others have been in downtrend since last 4 years.
Reversal is close now.
It should start we can already see reversal in LTF.

Friday 6 February: Tech stumbles, how long for? A couple of weeks ago I commented how earnings season was once again slipping under the radar. That came to a crashing halt last week as Microsoft's AI spending came under scrutiny, the narrative has continued this week with Amazon and Alphabet. The market is questioning if companies are spending so much, it's going to the a lot longer than initially thought for returns to hit the baseline. Stocks are under pressure, with the NASDAQ in particular falling hard. We've had the classic stocks down, yields down =risk off.
With continued mixed messages from Japan (rate hikes along with fiscal stimulus) the USD has been the beneficiary of the negative environment.
The question now is, how sustainable is the negativity? Is a 'risk off' trade viable? Perhaps GBP USD short following the slightly dovish BOE.
Or will the mood stabilise? Leading to a 'risk on' trade, possibly AUD JPY long or arguably another USD JPY long.
For now, I don't quite have confidence in either possibility and I'm content to wait for a bit of fresh impetus in either direction.

Gold May Continue Short-Term Correction Amid High Volatility📊 Market Overview:
Earlier today, spot gold (XAU/USD) experienced a sharp sell-off toward the 4,655 USD/oz area before rebounding. This move highlights elevated market volatility, driven by a firm US dollar and cautious investor sentiment following the previous strong rally. Dip-buying emerged near lower levels, but short-term selling pressure remains evident.
📉 Technical Analysis:
Key Resistances:
• 4,900 – 4,950 USD
• 5,020 – 5,080 USD
Immediate Supports:
• 4,700 – 4,750 USD
• 4,600 – 4,650 USD
EMA:
• Price is hovering around the EMA 09, indicating an unclear short-term trend and a consolidating market.
Candlestick / Volume / Momentum:
• Large-range candles with long wicks show strong buying and selling pressure. Volume remains elevated, confirming active market participation, but bullish momentum is not yet strong enough to confirm a sustainable uptrend.
📌 Outlook:
Gold may continue to correct in the short term if price fails to hold above the 4,700 USD/oz support, while rallies may continue to face profit-taking pressure.
💡 Suggested Trading Strategy:
🔻 SELL XAU/USD: 4,947 – 4,950
🎯 TP: 40 / 80 / 200 / 300 pips
❌ SL: 4,957
🔺 BUY XAU/USD: 4,703 – 4,700
🎯 TP: 40 / 80 / 200 / 300 pips
❌ SL: 4,693

BITCOIN CYCLE: Reset of the cycle is coming to an end. COINBASE:BTCUSD NASDAQ:IBIT
Bitcoin currently trading at $63,899. The bear market is in full effect, negative news creating fear and bearish sentiment in the market. 200 day and 63 day EMAs crossed, therefore confirmed the bear market. BTC formed a bear flag climbing into a resistance zone, paired with EMAs, this level was respected, we now have continued to dump hard. At this very moment we now are entering a key support level between $49,196 - $59,132. To add context clues, Daily and Weekly RSI are heavily oversold. Monthly RSI is in the discount zone, which will support this idea.

Silver at 74 USD spot - real, physical price 88,9 EuroGood day, we see Silver spot price lower and expect a bottom around the 50 level.
Even tho the spot price of silver went down, we can not find real physical silver for anything near that price. In fact, in Germany, the cheapest offer i can find right now is 88,9 Euro for one Ounce of fine Silver...
If you can help to locate better options for real, physical silver, please let me know. I would also be interested in coins, which sold out a lot... Thank you!

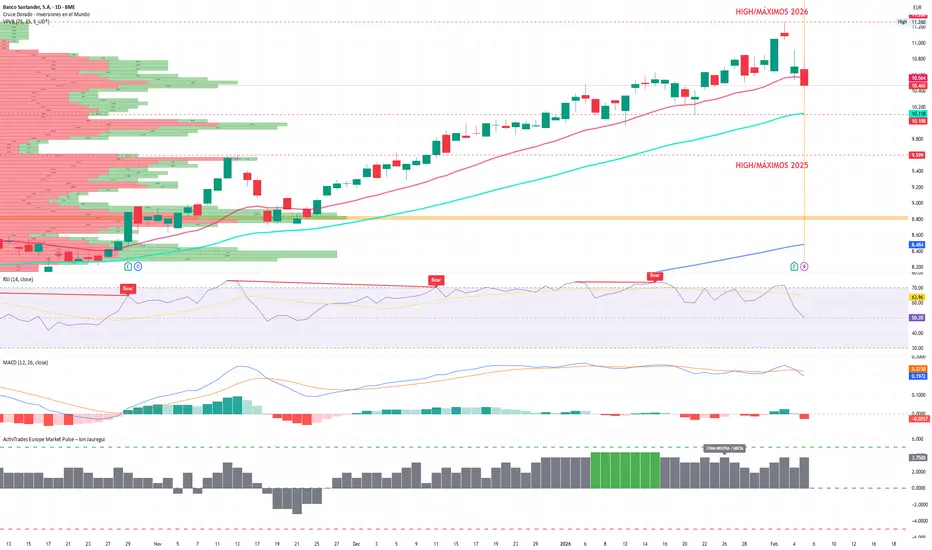
Santander distances itself from European acquiring WebsterSantander distances itself from European banking with the acquisition of Webster in the U.S.
By Ion Jauregui – Analyst at ActivTrades
Banco Santander has taken a decisive step in its international growth strategy with the acquisition of Webster Bank for €10.3 billion, one of the largest cross-border banking transactions of the last decade. According to LSEG data, the transaction ranks as the third largest since 2016, surpassed only by BMO’s acquisition of Bank of the West and HSBC’s purchase of Hang Seng Bank, highlighting the scale and ambition of the move.
The transaction becomes even more relevant when viewed within the sectoral context. In recent years, several European banks have chosen to scale back from the U.S. market due to intense competition and capital requirements. BNP Paribas, BBVA, and HSBC itself reduced or sold their U.S. retail businesses, prioritizing balance sheet optimization and short-term profitability. Santander, however, adopts a countercyclical strategy, betting on scale, geographic diversification, and structural profitability in the world’s largest economy.
From an operational standpoint, Webster fits strategically into the group’s model, allowing a rebalancing of the credit portfolio: a lower weight in consumer lending and greater exposure to corporate banking and the mortgage segment, traditionally more stable and with a better risk–return profile. This acquisition is part of a broader roadmap designed by Ana Botín—together with the acquisition of TSB and the sale of the Polish subsidiary—aimed at achieving a RoTE of 20% by 2028.
From a market perspective, the initial reaction is usually contained. The rebound in cross-border banking M&A in the first weeks of the year, already exceeding $13 billion, contrasts with a particularly active 2024, which explains a more selective investor reading of large-scale transactions.
Technical analysis of Banco Santander (Ticker: SAN)
From a technical perspective, the stock maintains a long-term bullish structure, although in the short term it has entered a corrective phase toward the 50-day moving average, after marking historical highs this month supported by strong corporate results. The price is currently respecting the key support area around €10.12, the origin of the last bullish impulse.
The most likely short-term scenario is a sideways movement, allowing the market to digest both the earnings results and the Webster acquisition before resuming the primary trend. The volume profile shows a relevant point of control around €8.80, while the next reference areas are located at €9.60–€9.90 (2025 highs) and €10.48, a high-volume area close to the current price.
Regarding indicators, the RSI has corrected the recent strong overbought condition and now sits at neutral levels, while the MACD reflects a loss of bullish momentum, consistent with a consolidation process. A sustained break above historical highs would confirm the continuation of the long-term move, while a clear loss of key supports would open the door to corrections toward the previously mentioned price areas. The ActivTrades Europe Market Pulse indicator signals an increase in risk, although still within a mixed zone, partially linking the stock’s evolution to the broader European equity market tone.
A countercyclical bet in a transforming sector
While a large part of European banking opts for caution and international retrenchment, Santander chooses to grow where others withdraw. In an environment of economic slowdown in Europe, regulatory pressure, and tighter margins, the bet on the United States reflects a long-term structural growth vision, supported by scale, diversification, and operational efficiency.
In the short term, the market will continue to assess integration risks and capital consumption. However, in the medium and long term, the transaction strengthens Santander’s strategic profile in an increasingly concentrated global banking sector, where only institutions with size, international presence, and adaptability will be able to sustain high levels of profitability.
*******************************************************************************************
The information provided does not constitute investment research. The material has not been prepared in accordance with the legal requirements designed to promote the independence of investment research and such should be considered a marketing communication.
All information has been prepared by ActivTrades ("AT"). The information does not contain a record of AT's prices, or an offer of or solicitation for a transaction in any financial instrument. No representation or warranty is given as to the accuracy or completeness of this information.
Any material provided does not have regard to the specific investment objective and financial situation of any person who may receive it. Past performance and forecasting are not a synonym of a reliable indicator of future performance. AT provides an execution-only service. Consequently, any person acting on the information provided does so at their own risk. Political risk is unpredictable. Central bank actions can vary. Platform tools do not guarantee success.
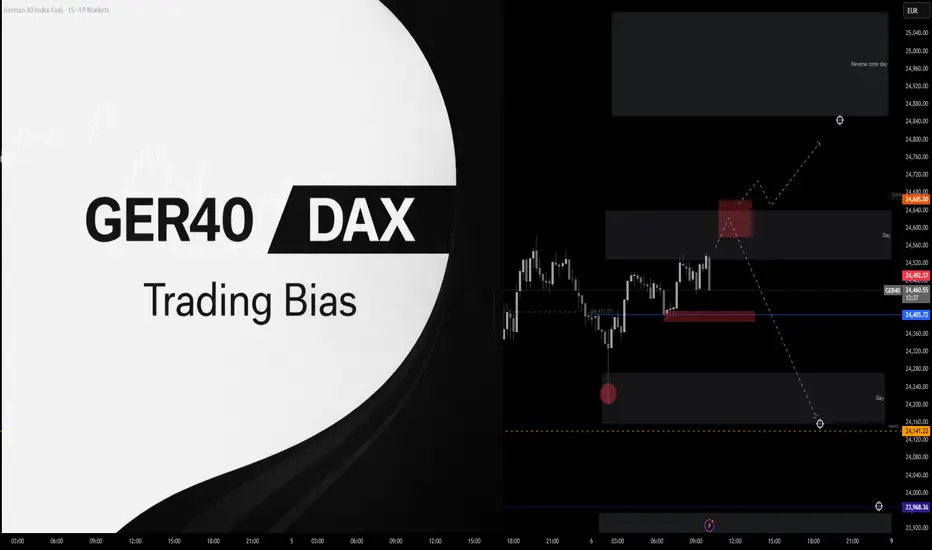
GER40 (DAX) – Trading Plan for Today | February 06🔥GER40 (DAX) – Trading Plan for Today | February 06
The session started with a short-biased open,
followed by an impulsive rejection and lack of acceptance within the daily zone,
which effectively acted as the day’s target.
This price behavior confirms continued selling pressure,
despite a short-term buyer response.
Additional cluster context:
Intraday plan
Primary scenario:
– looking for a short reaction from the daily long zone.
Downside target:
– lower boundary of the daily short zone,
– this area also aligns with a key monthly level.
Alternative scenario:
– only after acceptance and holding above the daily long zone,
a long continuation toward the reversal zone will be considered.
Key condition:
– a weekly close below 24,403
will confirm a bearish bias for the next trading week.
Until then, shorts remain the priority.
This is not financial advice. Risk management is required.
WTI CRUDE OILPrice respected the daily fvg(grey shaded). Also bounced off the weekly breaker(support level). Price is anticipated to reach $70 as long the geopolitical remains as they are and the market conditions allow the strategy/approach to play out.

Bearish selverBearish silver .. seems we are closed under 71 area so i ak bearish to attack lower liquidity zones and thean taking leap and going straight to ATH

GBPAUD (Buy)I think price is ready to start breaking structure to the upside this trade will take a few days if I am correct about the analysis, I think we are about to build a range on the daily time frame.

USDCHF (Past) Selling America Amidst Risk-off Narrative: Still mildly dovish (cuts expected later in 2026, data-dependent)
Sentiment: Risk-off; US claims Beat, weakness in US techs, weak commodities
Pattern: TC(RTF)
Time: 1st hour of NY opening

AUDUSD (Buy)AU just took out that temporary demand I am expecting a push back up to take out sellers again targeting supply looking to sell at a higher price whether the supply gets taken out first or not will still look for sells later after sells get liquidated.

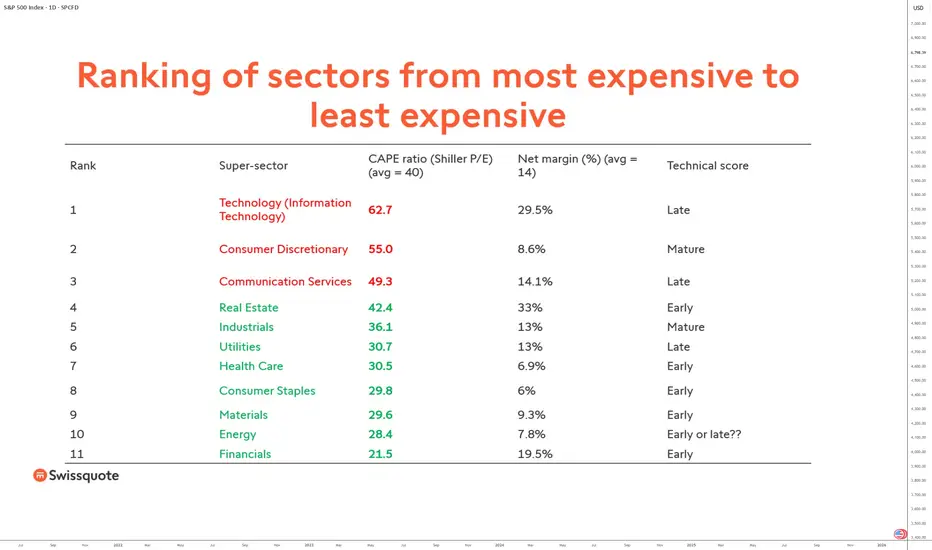
Sectors that could outperform the S&P 500 (methodology)While the S&P 500 is still trading at all-time highs and appears very expensive in valuation terms, is it possible to optimize and diversify by identifying sectors that could outperform the S&P 500 over the coming months? Vincent Ganne presents his methodological answer. The research is conducted within the 11 “super sectors” of the S&P 500 index.
Analysis methodology applied to the 11 super sectors that make up the S&P 500 index: CAPE ratio + net margin + average medium/long-term technical score
1) Shiller P/E (CAPE ratio)
The CAPE ratio (Cyclically Adjusted Price-to-Earnings) measures the valuation level of a market by comparing its price to the average real earnings (inflation-adjusted) over 10 years.
It helps smooth economic and accounting cycles and is mainly used to assess the relative expensiveness of a market over the long term. Historically, a high CAPE is associated with lower future returns over several years.
2) Net margin
The net margin of a sector measures the average final profitability of companies within the sector, i.e. the share of revenue that remains as net profit after all costs. At the sector level, this is a weighted average of the net margins of the companies in the sector (often weighted by market capitalization).
3) Average medium/long-term technical score
A technical score that qualifies the maturity of the trend according to the ratings “early”, “mature”, and “late”. From a technical analysis perspective, potential outperformance is more likely to be found in the “early” and “mature” categories. The rating is based on technical analysis of monthly and weekly charts.
By combining these three criteria, the objective is to identify sectors that offer a reasonable valuation, sufficient structural profitability, and a technical momentum that remains exploitable. This approach aims to avoid sectors that are highly performant in terms of earnings growth but already significantly overvalued and technically in a late-cycle phase.
Sales and earnings growth data show a strong concentration of recent performance in technology and, to a lesser extent, industrials. However, these sectors are also among the most expensive in terms of the CAPE ratio, which limits their potential for relative outperformance over the medium term, despite high margins and solid earnings growth.
The table below presents the results of the research. The best opportunities are found among sectors that are inexpensive (see CAPE ratio), with a net margin above average and a technical score that is not classified as “late”.
Conversely, several sectors display a more balanced profile. Financials stand out with a CAPE ratio significantly below average, robust net margins, and a still favorable technical positioning. Defensive sectors such as consumer staples and healthcare also show more moderate valuations, with technical scores classified as “early”, suggesting potential sector rotation in their favor in the event of an economic slowdown or increased volatility.
Real estate and utilities also deserve particular attention. Although their earnings growth is more modest, their high margins and valuations that have become more attractive again after several quarters of underperformance could make them credible candidates for relative outperformance if monetary conditions ease.
DISCLAIMER:
This content is intended for individuals who are familiar with financial markets and instruments and is for information purposes only. The presented idea (including market commentary, market data and observations) is not a work product of any research department of Swissquote or its affiliates. This material is intended to highlight market action and does not constitute investment, legal or tax advice. If you are a retail investor or lack experience in trading complex financial products, it is advisable to seek professional advice from licensed advisor before making any financial decisions.
This content is not intended to manipulate the market or encourage any specific financial behavior.
Swissquote makes no representation or warranty as to the quality, completeness, accuracy, comprehensiveness or non-infringement of such content. The views expressed are those of the consultant and are provided for educational purposes only. Any information provided relating to a product or market should not be construed as recommending an investment strategy or transaction. Past performance is not a guarantee of future results.
Swissquote and its employees and representatives shall in no event be held liable for any damages or losses arising directly or indirectly from decisions made on the basis of this content.
The use of any third-party brands or trademarks is for information only and does not imply endorsement by Swissquote, or that the trademark owner has authorised Swissquote to promote its products or services.
Swissquote is the marketing brand for the activities of Swissquote Bank Ltd (Switzerland) regulated by FINMA, Swissquote Capital Markets Limited regulated by CySEC (Cyprus), Swissquote Bank Europe SA (Luxembourg) regulated by the CSSF, Swissquote Ltd (UK) regulated by the FCA, Swissquote Financial Services (Malta) Ltd regulated by the Malta Financial Services Authority, Swissquote MEA Ltd. (UAE) regulated by the Dubai Financial Services Authority, Swissquote Pte Ltd (Singapore) regulated by the Monetary Authority of Singapore, Swissquote Asia Limited (Hong Kong) licensed by the Hong Kong Securities and Futures Commission (SFC) and Swissquote South Africa (Pty) Ltd supervised by the FSCA.
Products and services of Swissquote are only intended for those permitted to receive them under local law.
All investments carry a degree of risk. The risk of loss in trading or holding financial instruments can be substantial. The value of financial instruments, including but not limited to stocks, bonds, cryptocurrencies, and other assets, can fluctuate both upwards and downwards. There is a significant risk of financial loss when buying, selling, holding, staking, or investing in these instruments. SQBE makes no recommendations regarding any specific investment, transaction, or the use of any particular investment strategy.
CFDs are complex instruments and come with a high risk of losing money rapidly due to leverage. The vast majority of retail client accounts suffer capital losses when trading in CFDs. You should consider whether you understand how CFDs work and whether you can afford to take the high risk of losing your money.
Digital Assets are unregulated in most countries and consumer protection rules may not apply. As highly volatile speculative investments, Digital Assets are not suitable for investors without a high-risk tolerance. Make sure you understand each Digital Asset before you trade.
Cryptocurrencies are not considered legal tender in some jurisdictions and are subject to regulatory uncertainties.
The use of Internet-based systems can involve high risks, including, but not limited to, fraud, cyber-attacks, network and communication failures, as well as identity theft and phishing attacks related to crypto-assets.
Will this $btc bitcoin fractal repeat? Is History Repeating?BITCOIN (BTCUSDT) — Weekly Fractal Warning: History May Be Rhyming
Bitcoin is currently printing a **macro weekly fractal** that closely resembles the 2021/2022 cycle top structure. This is not a prediction, but a structural comparison based on price geometry, channel behavior, and MoneyWave momentum.
Bitcoin Current price: $88,500
Repeating Fractal Structure
Fractal 1 (2021–2022):
* Price advanced inside a rising channel
* Series of higher highs & higher lows
* Momentum (MoneyWave) began to diverge
* Breakdown followed → 69k → 16k (-75% drawdown)
Fractal 2 (Current Cycle):
* Price advancing inside a similar rising channel
* Again printing higher highs
* MoneyWave divergence is present
* Momentum is now turning negative at the same relative point
The geometry and momentum behavior are statistically similar. We are now seeing negative MoneyWave prints, exactly where the first fractal started to roll over. This typically reflects distribution not accumulation.
Fractal Projection (Conditional) assuming If this second fractal completes similarly:
* Potential cycle top: 125k
* Historical drawdown reference: -75%
* Fractal-based downside zone: $30,000
Invalidation Conditions
This bearish fractal fails if:
1. Bitcoin Price Action breaks and holds above 100k
2. And MoneyWave makes a clear positive high
Until then, the fractal remains active.
### Final Thought
Cycle tops do not announce themselves loudly.
They form through divergence, structure, and fading momentum — exactly what we are observing now. As usual... Time will Tell!
#Bitcoin #BTC #Crypto #MarketCycles #TechnicalAnalysis #TradingView #SmartMoney #Fractals #RiskManagement**

BTCUSDT Review February 06 2026Long-term price movement opinions
At the moment, price has entered its strongest support zone. This is the manipulation of the previous all-time high, followed by consolidation inside this area before a potential move toward a new high. In fact, the current zone will define the next major direction.
I see two possible scenarios.
The first, and less likely, scenario is an aggressive rebound above the 74,000 level within this month, followed by a strong acceptance and consolidation above it. This would create the conditions for the continuation of the uptrend.
The second, and more likely, scenario is price stalling and entering a prolonged consolidation phase, potentially lasting for months, as we have seen before. This would involve a break of the monthly structure, the formation of new areas of interest to the downside, their subsequent testing or manipulation within them, and a continuation of the broader bearish move.
If you are currently trying to guess whether we are in a bull market or a downtrend, this is not the moment to make rushed decisions. It is better to allow price to develop, at least within the scope of this month, and then evaluate which of the two scenarios has played out.
Personally, I have been on the bearish side for quite some time, and this type of price action only reinforces my narrative. If the second scenario unfolds, I will completely dismiss the possibility of further upside.

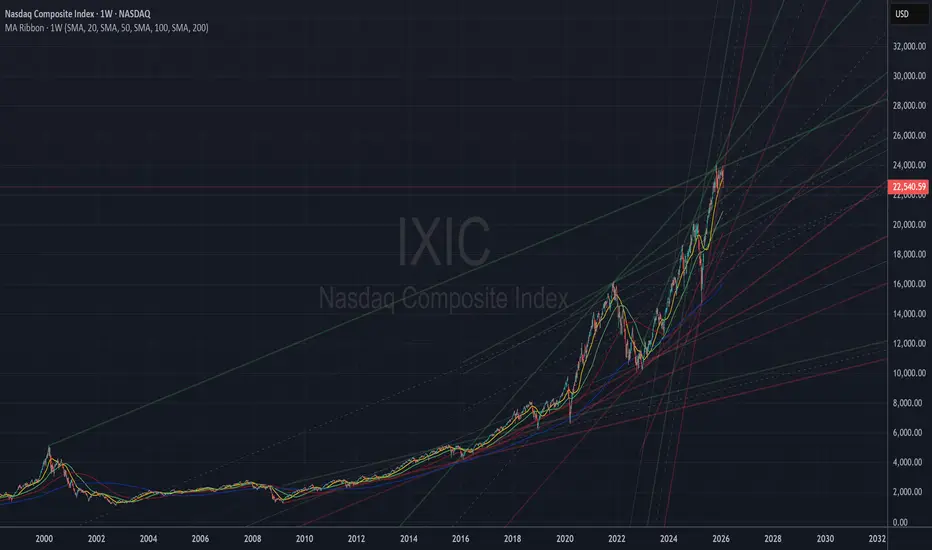
ParallelagramsNasdaq Composite stuck in parallel wedge
Correction to downside likely 10-20% into 2026 summer
Will there be any safe haven against the onslaught of de-dollarization?
Look for 2026 US midterm election pump or don't
Palladium: Long SetupOn today's chart, a shadow has formed, while the previous local minimum was not broken—around 1500. I believe that the current setup forming on the chart is quite positive, so I am placing a long position, with targets in the range of 1825 to 1850. The stop-loss I plan to set at 1600.
In general, metals are holding up well—considering the big drop that happened in cryptocurrencies, and even SnP500 started to tumble—so, logical profit-taking.
Metals are doing well; platinum and palladium especially, while silver is quite volatile.

BTCUSD Daily CLS Model 1 - Short term BuyHi friends, new range created. As always we are looking for the manipulation in to the key level around the range. Don't forget confirmation switch from manipulation phase to the distribution phase to make the setup valid. Stay patient and enter only after change in order flow. If price reaches 50% of the range take partial or full close.
👊 Trade Visual
We are reacting at 67011 level which was predicted months ago, it can bounce here but overall its still bearish and I expect touch bellow 50K. But later. Keep risk in control.
I promised myself I’d become the person I once needed the most as a beginner. Below are links to a powerful lessons I shared on Tradingview. Hope it can help you avoid years of trial and error I went thru.
📊 Sharpen your trading Strategy
⚙️ 100% Mechanical System - Complete Strategy
🔁 Daily Bias – Continuation
🔄 Daily Bias – Reversal
🧱 Key Level – Order Block
📉 How to Buy Lows and Sell Highs
🎯 Dealing Range – Enter on pullbacks
💧 Liquidity – Basics to understand
🕒 Timeframe Alignments
🚫 Market Narratives – Avoid traps
🐢 Turtle Soup Master – High reward method
🧘 How to stop overcomplicating trading
🕰️ Day Trading Cheat Code – Sessions
🇬🇧 London Session Trading
🔍 SMT Divergence – Secret Smart Money signal
📐 Standard Deviations – Predict future targets
🎣 Stop Hunt Trading
💧 Liquidity Sweep Mastery
🔪 Asia Session Setups
📀 Gold Strategy
🧠 Level Up & Mindset
🛕 Monk Mode – Transition from 9–5 to full-time trading
⚠️ Trading Enemies – Habits that destroy success
🔄 Trader’s Routine – Build discipline daily
💪 Get Funded - $20 000 Monthly Plan
🧪 Winning Trading Plan
⭕ Backtesting vs Reality
🛡️ Risk Management
🏦 Risk Management for Prop Trading
📏 Risk in % or Fixed Position Size
🔐 Risk Per Trade – Keep consistency
🧪 Risk Reward vs Win Ratio
💎 Catch High Risk Reward Setups
☯️ Smart Money - Who control Markets
Adapt useful, Reject useless and add what is specifically yours.
David Perk

BTCUSD — 0.5 Fibonacci Rejection + 4H FVG | Smart Money Retracem
Bitcoin is currently reacting inside a key premium zone where 0.5 Fibonacci retracement aligns with a 4H Fair Value Gap — a classic area where continuation sellers step back into the market. The recent bounce shows corrective structure, not a confirmed trend reversal.
🧠 Market Structure:
• Strong bearish displacement still intact
• Pullbacks forming weak higher highs
• Price approaching confluence zone (0.5 Fib + 4H FVG)
• Liquidity resting below current range inside demand area
📉 Bearish Plan:
If price taps the premium zone and shows rejection, the probability favors continuation toward the lower demand zone. This move would target resting liquidity and rebalance inefficiencies left by the previous impulse.
⚠️ Invalidation:
Clean acceptance above the FVG zone shifts bias neutral-to-bullish. No confirmation — no trade.
This idea is built on structure, liquidity, and patience — not prediction.
If you’re tracking the same zone, share your view below and let’s compare perspectives.
