bitcoin In the video, i talk about bitcoin being in the accumulation phase and how my daily bias is still bullish.
Remember we have Expansion-Accumulation-Manipulation-Distribution phase in a market structure and it is crucial that we understand what phase the market is currently on.
Our priority at the moment is to be able to spot the next phase which is manipulation. This usually occur with low volume as price continue to descend out from the accumulation cluster.
So have a look at the chart and trade responsibly.
Bias

$SOL DIRECIONAL BIAS- BYBIT:SOLUSDT.P
→ If the current Monthly Candle Closes ABOVE prev. Month high - (146.85), I'd expect price at around 155.34 (First DOL),
and then 188.89 (Final DOL).
→ Conversely, If the Monthly Candle Closes BELOW prev. Month high, I'd expect price to SELL to around -116.78.
⚠️Remember this is NOT a Financial Advice, DYOR.

EURAUD - Shorts Played, Now Watching the Other SidePreviously, this one was pretty straightforward.☀️
📉As EURAUD approached the upper bound of the falling channel, the bias was clear, we were looking for shorts, and price reacted perfectly from that area.
Fast forward to now, and context has changed.
Price has pushed all the way down into a strong confluence:
• The lower bound of the falling channel
• The previous weekly low (also demand zone)
At the moment, we’re seeing rejection from the lower channel, suggesting selling pressure may be slowing down.
⚔️As long as this area continues to hold, my focus shifts from selling rallies to looking for longs, targeting a rotation back toward higher levels inside the range.
This doesn’t mean blind buying... it means waiting for confirmation on lower timeframes and letting the market prove that bulls are stepping in.
⚠️ Disclaimer: This is not financial advice. Always do your own research and manage risk properly.
📚 Stick to your trading plan regarding entries, risk, and management.
Good luck! 🍀
All Strategies Are Good; If Managed Properly!
~Richard Nasr

The Attachment to a Bias: When Analysis Turns BlindThe Attachment to a Bias: When Analysis Turns Blind
“The market didn’t change.
Your attachment did.”
Every trader begins with a view.
Bullish or bearish.
That’s normal.
The problem starts when a view becomes an identity.
You stop observing.
You start defending.
How Bias Is Formed
Bias is rarely created by logic alone.
It forms from:
• A strong winning trade
• A painful loss you want to recover
• A convincing analysis or opinion
• News, narratives, or predictions
Slowly, analysis turns into belief.
Belief turns into attachment.
Why Bias Feels Like Confidence
Bias feels powerful because it removes uncertainty.
It gives comfort.
You stop questioning.
You stop waiting.
You start seeing only what supports your view.
But comfort is not clarity.
And certainty is not accuracy.
What Bias Does to Your Trading
• You ignore early warning signs
• You skip confirmation
• You hold losing trades longer
• You miss clean reversals
• You fight structure instead of reading it
The market keeps giving information.
Bias stops you from receiving it.
Flexibility vs Conviction
Professional traders are not directionless.
They are flexible.
They have a plan — but no attachment.
They follow structure, not opinions.
They let price speak first.
Conviction says, “I know.”
Flexibility says, “Show me.”
How to Detach From Bias
• Treat every trade as independent
• Update bias only after structure confirms
• Journal when you feel “sure” — that’s a warning
• Ask: “What would invalidate my view?”
• Let price lead, not belief
The market doesn’t reward conviction.
It rewards awareness.
📘 Shared by @ChartIsMirror
Have you ever held onto a bias even when price was clearly changing?
Awareness begins the moment you let go.

EURUSD — One Turnpoint, Two OutcomesThis Daily chart reduces the entire narrative to one decisive level .
We had a completed bearish ABC sequence , with price reaching its C target and establishing a fresh bearish WCL . As price entered that terminal zone, a new bullish ABC sequence began forming — a classic SK transition from momentum to location.
What matters now is not the past sequences, but the bullish WCL .
That bullish WCL is the turnpoint .
From an SK perspective, this level is binary:
If the bullish WCL is respected , price should rotate higher and retest the bullish ABC objective
If the bullish WCL fails , the bullish sequence is invalidated, and price should rotate lower to retest the bearish ABC objective
There is no prediction here and no bias without confirmation.
The market has compressed into a decision point where one level defines two paths .
Breaker structure still frames the area, but the WCL is doing the heavy lifting.
Everything else is context.
This is not about direction — it’s about who controls the turnpoint .
— SmellyTaz
Decoding chaos .
Disclaimer : This is not financial advice.

Building Bias and Narrative in Trading (HTF-LTF)Bias is built top-down. The visuals make this clear. Higher timeframes define the environment. Lower timeframes refine execution. Mixing the two leads to impatience and overtrading.
Start with the high timeframe. Weekly and daily charts carry the highest impact on decision-making. They move slowly, but they define direction, value, and market regime. This is where patience matters most. If the higher timeframe is trending, your bias follows that direction. If it is ranging or transitioning, expectations on lower timeframes must be adjusted accordingly.
The first chart illustrates this trade-off clearly. As timeframes get lower, the impact of patience decreases while the risk of overtrading increases. This is why bias must be anchored higher. Lower timeframes react faster, but they lack authority without higher-timeframe alignment.
Once the environment is defined, map key levels on the higher timeframe. Major highs and lows, clear support and resistance, and obvious liquidity zones form the backbone of your narrative. These levels explain where market participants are positioned and where reactions are most likely to occur. Without them, lower-timeframe signals lose meaning.
Next, use momentum and structure to validate the story. Strong impulsive moves on higher timeframes confirm control. Weak follow-through or overlapping candles signal uncertainty. Momentum should support the directional bias defined earlier. If it does not, the narrative weakens.
Only then does the lower timeframe come into play. The second visual shows how the same market prints very different candles depending on timeframe. Weekly and daily charts compress noise into structure. Fifteen-minute and five-minute charts expand that structure into execution detail. Entries belong here, but only in the direction already defined.
The final table ties this together by trader type.
Long-term traders define trend on weekly charts and execute on daily.
Swing traders frame direction on daily and refine entries on four-hour.
Short-term traders align with four-hour structure and execute on hourly.
Scalpers still require hourly context before acting on fifteen-minute charts.
Bias is not prediction. It is alignment. The narrative flows from high timeframe context to low timeframe execution. When you respect this sequence, trades become selective, risk becomes clearer, and execution becomes calmer. The chart stops feeling random because you are reading it as a story, not reacting to each line.

AUDCAD – When Price Refuses to Come BackThis chart isn’t interesting because of what price did.
It’s interesting because of what price refused to do .
After a clear structural shift, AUDCAD printed a bullish breaker and then launched vertically. No hesitation. No overlap. No courtesy pullback. Just expansion.
That tells a very specific story.
This was not a market inviting participation.
This was a market escaping a price range .
The bullish breaker exists, but it was never mitigated . Price didn’t return to rebalance, didn’t test commitment, didn’t allow confirmation. That’s not accumulation — that’s urgency.
So even though the bias flipped bullish , the location never became tradable.
What followed was consolidation above the move — not inside it. That’s acceptance at higher prices, not demand being built below.
In other words:
Direction is clear
Intent is visible
Participation is missing
This is why I don’t confuse market intent with market opportunity .
Sometimes the market tells you:
“ I’m bullish — but you’re late. ”
And the correct response is not FOMO, not prediction, not forcing an entry —
it’s patience.
This chart stays on watch until price comes back to unfinished business , or until a new narrative forms.
This post is about location, behavior, and restraint — not a trade call.
— SmellyTaz
Decoding chaos
⚠️ This is not financial advice.

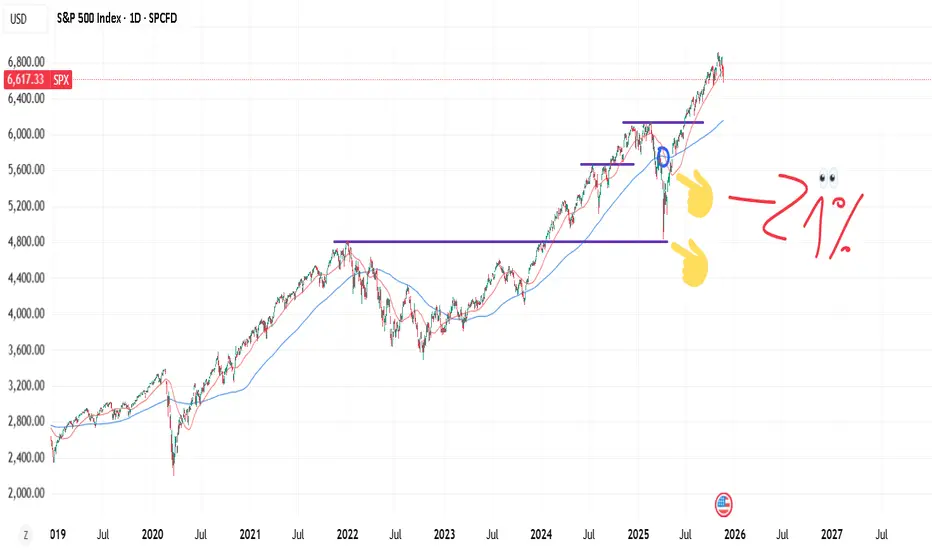
The Wall of Worry That Climbed 70% This chart should be framed and hung in every investor’s office.
From 2021 → late 2025 the S&P 500 went from ~4,000 → 6,886 (+70%+), while the entire way up we were bombarded with:
“SELL” – Michael Burry
“Worst crash since 1929” – John Hussman
“86% drop coming” – Harry Dent
“Biggest crash in history has started” – Robert Kiyosaki
“Third most expensive market ever, recession imminent” – David Rosenberg
…and literally dozens more “100% certain” doomsday calls
Every single red bubble on this chart = a famous expert screaming that the sky was falling.
And every time the market just… kept climbing.
Here's what's important to understand: "experts" produce lots of noise.
Waiting on the sidelines for the “all-clear” from the gurus is the riskiest move of all.
The opportunity cost is brutal.
Missing the best days (which usually come right after the scariest headlines) destroys returns more than any crash ever could.
Stay invested is much better than trying to time the experts.
Time in the market still beats timing the market.
You better save this chart the next time someone sends you another “crash is coming” article!

USDCAD - Bearish BiasAnalyzing the previous candle on the D1 timeframe (Tuesday's candle), we can see we had a clear sweep of other previous D1 candle's high (Monday's candle).
Now after the sweep of Monday's high, we closed back inside Monday's candle range. So with that in mind, I'm anticipating, and confident enough that the next liquidity price is gonna draw to is Tuesday candle Low, and possibly if there's high volume, we wanna see previous Fridays Low also being takes.
And that alarms the bias for today (Wednesday).
That does not mean going on to your chart 📉 and putting your SELL order, but with careful analysis, we first anticipate price to pull back into a PDA, 1h Internal Range Liquidity (a FVG, a sweep into an old highs or testing and OB), only then we can be confident hunting for sells in alignment with the overall BIAS for today.
I'm Zak, and I'm starting a new journey in giving back the knowledge I've acquired in my 4 years trading experience.
So if you found this useful, please show me your support and I'll continue to do this everyday.
Much love trader 😊

My BTC BiasBitcoin is still in a heavy downtrend.
The small uptrend was just do it can reach premium of the created range.
Take profit is annotated in video and is likely to occur based on what I have observed.
Not financial advice. Just an opinion.

Market structure XRP Charte de 4h / Bullish ou Bearish AJD ?Introductory video on market structure using a 4H chart on XRP to identify the direction of financial markets with over 80% accuracy.

Cognitive Bias VS PrejudgmentCognitive Bias is how you or your brain process or interpret information. What you strongly believe in. (Influenced by beliefs, expectations, emotions, and shortcuts).
Prejudgment could be things that are "most of time true, but not always". Learned truths that can be false. (Prejudgment is treating a general rule as always true).
... markets move based on Supply-Demand dynamic, structural positioning and "least resistance". Markets follow the economy. And there are merits to using quant statistics.
Prejudgment: (Based on DOW theory or Tudor Jones upsloping 200dma) - there is less risk buying strong bull markets. When DOW is broken, price bellow 200dma - it means bear market. In practice this was a statistical scarce spot where big money is made.
-20% is usually a good indicator as well as bottom for the top1% stocks? as well in bitcoin, that wouldn't fall that much.
Prejudgment: Stocks follow the economy (true), tariffs pose risks to economy ie cause recession, hence a bear market.
Statistically, based on like previous 6 years, every sharp drop gets re-filled instantly. ie the V shape recoveries. mirroring 2020. There was a positional imbalance.
Cognitive Bias: trending near the bottom ---> affirms your fears of crash. or bubble talks. Prices follow S-D dynamic, not charts.
Another one is believing that most people are in fear. Which equates a crash.
cognitive biases in short -- you favor or over emphasize the importance of near term events over longterm proven statistics. Markets repeat over and over again, in same psychological patterns.
GBPJPY ShortTaking a short position as a counter bias trade here.
Price has taken old liquidity and reacted with a 1H IFVG.
I except GBPJPY to be overall bullish this week, therefore it is i trade with a target to where i expect weekly low to be created.
I take low risk on this trade as it is not my main trading strategy and the setup could have been better.
Risk: 0,4% of capital.
Good night.

Weekly evaluation & forecast - Week 46/47Week 46: Succesfull week with a result on +1,17%
1 loss on EURNZD
2 wins on GBPUSD
Weak 47: This week i´m gonna be focusing on USD pairs along with EURGBP and GBPJPY.
I´ll expect a volatile week, especially on USD paris due to the coming long waited NFP on thursday.
This week i´m gonna be extra selective due to NFP. I will prefer to exit any trade that i´m in related to USD before NFP announcement.
Weekly news calender:
www.forexfactory.com
On DXY i´ll continue having a bearish bias, while keeping in mind that we are in a FVG.
Before taking any trade on USD pair, i would like price to play out a very clear weekly cycle up into one of the bearish FVG´s. There will be a small chance of a good trade opportunity as i want to exit before NFP, so i will prioritise trades on non-USD pairs.
EURCHF hit BIAS last week, and i have som uncertainty to if the biased will change. I need to see price play out a weekly AMD cycle down into some kind of liquidity before considering trading this pair. Only liquidity i can see so far is in the 4H FVG. Maybe something better will get created during the week.
I´m still in a trade on GBPJPY, but would really like to add to it. Without a doubt one of the pairs which looks most interessting to me. I have a clear bullish bias for this pair in the comming week. Would like to see price form a weekly low around london open on wednessday as to CPI news on GBP.
I expect price to go down to FVG under the equal lows in the beginning of the week. If a good entry oppurtunity comes i´m gonna consider taking a counter bias trade down to the FVG.
The momentum of EURGBP is starting to slow down, but i´m keeping my bias bullish until i reached my bias, unless something uexpected is gonna happen. There is a slight chance for a weekly smaller retracement, but for now if we´re gonna trade down in the start of the week, i will look for longs.
Very similar pair as GBPJPY.
I will keep you updated during the week, with what trades i´m gonna take.

Bullish continuation for NASDAQ?
📊 CME_MINI:NQZ2025 Analysis – Oct 18, 2025
🧠 Market Context:
Price recovered back into Premium of range (the upper part of the current weekly range) after the drop to 24,158. Creating an inside week that managed to provide a Bullish close.
Inside Week consolidated in an 1H frame.
Price currently upper band (Premium) of 1H consolidation.
Trapped Sellers at discount of 1H range which happens to be previous week Opening
Gap High area.
Lack of US scheduled Red Folder news until Friday morning.
8:30am
📕 Core CPI m/m
📕 Weekly wick 50% at 25196
📕 CPI y/y
9:45am
📕 Flash Manufacturing PMI
📕 Flash Services PMI
Price referencing areas between 25,050–25,210. Premium of a weekly range.
🔼 There are several thing to note here:
🎯 Daily wick 50% at 25121.75
🎯 Weekly wick 50% at 25196
🎯 A Daily REQ Close and Open ( Origin of Weekly Short) at 25354.00
🎯 And REQ (Relative Equal) Highs and ATHs (All Time Highs) at 25394.00
Price can continue to explore Premium of weekly range using these as targets but keep in mind the potential for weakness and reversal formations along these levels.
High timeframe bias as well as structure still Bullish, keeping in mind that Price is currently within a Bearish Range (Friday October 10, 2025) Mondays PA and range might clarify wether Bias will remain Bullish, or if there will be any more signs of weakness and reversal formations.
🔻 There are several thing to note on the short side here:
🙁 Trapped Sellers ( Passive Liquidity) at discount of 1H Range and accumulation or Lower Band.
📉 Week Opening Gap (Reference partially) at discount of bigger range
📉 Weekly Low at 24410.00
📉 Previous Weekly Low at 24158.50
🧩 Context: Still questioning whether Fridays drop could be labeled as Price displacement and considered signal, or Rebalance. The difference will be noticed Mon-Tues.
Still uncertain on 💲 Dollar TVC:DXY Pending Bullish continuation confirmation or reversal back into chop.

Trading Psychology Bias Lesson: BTCUSD 1D ATR Position SizeSummary
Bias shifts judgment under stress and often decides outcomes before the order ticket. This idea converts trading psychology into rules you can apply on BTCUSD now. It uses fixed ATR stops, pre defined entries and exits, a written disconfirming note before any order, and decision grades based on rule adherence. The goal is tighter drawdowns and consistent execution across regimes.
Live context
Price 123,102
SMA 50 114,314
EMA 200 106,289
ATR 14 daily 2,882.52 which is 2.34% of price
Distance to SMA 50 is 8,788 which is 7.14%
Distance to EMA 200 is 16,813 which is 13.66%
2 x ATR equals 5,765.04 which is 4.68%
Why psychology decides the trade before entry
Real trading includes noise, limited attention, and emotion. The result is bias, a stable tendency that pulls choices away from the written rule. Bias creeps into 4 moments: setup definition, entry trigger, position size, exit and review. The fix is structure. Use 5 blocks: a 1 sentence setup, entry and stop and trail defined with ATR, a written disconfirming note, a higher timeframe check, and a post trade grade by rule adherence rather than outcome.
Theory. Core biases you must neutralize
Loss aversion . Loss pain exceeds gain pleasure and leads to widening stops or cutting winners early. Fix . Initial stop equals 2 x ATR. Trail equals 1 x ATR or a close through a moving reference. Never widen stops.
Confirmation bias . You search for evidence that agrees with your idea. Fix . Write 1 disconfirming fact before any order. Check the next higher timeframe. If it disagrees, cut size by 50% or skip.
Anchoring . You fixate on entry or a round level. Fix . Define exits on structure with ATR or a moving average close. Name the anchor in notes to reduce its pull.
Recency and availability . You overweight the last 1 to 3 candles. Fix . Use a 20 bar context rule and a weekly system review.
Overconfidence . After a win trade count and size increase without any change in edge. Fix . Cool down 2 minutes after every exit and halve next size after a large winner.
Herd and gambler’s fallacy . Late entries on wide candles and belief that streaks must continue or must reverse. Fix . Only take trades with projected reward to risk at least 2 to 1 at the planned stop and avoid high impact events.
Hindsight and outcome bias . You judge by result and rewrite rules after 1 loss. Fix . Save entry and exit screenshots and grade by rule adherence.
Status quo and endowment . You sit in positions you already own while better setups exist. Fix . Monthly retest of every holding against current rules.
Three guardrail rules for BTCUSD
Stop discipline. Initial stop equals 2 x ATR. Trail winners by 1 x ATR or by a daily close through SMA 50. Do not widen stops.
Decision hygiene. Before every order write 1 disconfirming fact and check the next higher timeframe. If the higher timeframe disagrees, cut size by 50% or skip.
Quality floor. Projected reward to risk is at least 2 to 1 at the initial stop distance.
BTCUSD 1D continuation plan with exact math
This plan assumes a breakout continuation and uses your live ATR 14. All digits are based on ATR 2,882.52 and a price above SMA 50 and EMA 200.
Setup in 1 sentence . Trend continuation long on a daily close above the recent swing with SMA 50 rising and 20 bar context bullish.
Entry trigger . Close above 124,200 confirms continuation.
Initial risk . 2 x ATR equals 5,765.04. Stop equals entry minus 5,765.04. For 124,200 the stop is 118,434.96.
Targets . 1R target equals entry plus 5,765.04 which is 129,965.04. 2R target equals entry plus 11,530.08 which is 135,730.08.
Sizing example . Equity 20,000. Risk per trade 1% equals 200. Position size equals risk divided by stop distance which is 200 ÷ 5,765.04 equals 0.0347 BTC. Notional at 124,200 is about 4,308.
Management . Trail by 1 x ATR which is 2,882.52. Move the stop only with the trail. Ignore the first single red candle to reduce recency effects.
Exit logic . Exit on a daily close below the 1 x ATR trail or use a time stop after 12 bars if 2R is not reached.
Journal cue . Before entry write 1 disconfirming fact. After exit save 2 screenshots and grade by rule adherence.
Why each step neutralizes bias in real time
Loss aversion is capped because the stop distance is fixed by ATR and never widened. The trail is mechanical.
Confirmation is checked by the written disconfirming fact and the higher timeframe review that can force a skip or a 50% position cut.
Anchoring is reduced because exits reference ATR and structure instead of entry or round numbers.
Recency is filtered by the 20 bar rule and by a weekly system review that ignores single outcomes.
Overconfidence is constrained by a 2 minute cool down and 50% next size after a large winner.
Mean reversion companion inside an uptrend
Use this only while SMA 50 and EMA 200 slope up and price trades above both averages.
Context . Pullback forms inside the 20 bar range toward short term support while SMA 50 rises above EMA 200.
Entry . Bullish rejection from a prior swing zone or a daily close back above the intraday pivot after a 2 to 3 day pause.
Risk . Initial stop equals 1.5 x ATR which is 4,323.78.
Sizing . Risk per trade 1%. Position size equals risk divided by 4,323.78. With equity 20,000 and risk 200 the size equals 0.0463 BTC.
Exit . First scale at 1.5 R. Stop to break even only after a daily close above SMA 50. Final exit at 2 R or on a daily close back into the pullback range.
Bias note . Write 1 anchor you feel and 1 disconfirming fact that would cancel the setup.
Decision checklist to paste into chart notes
Setup in 1 sentence written before entry
Entry level, initial stop, trail method defined
1 disconfirming fact written and verified
Higher timeframe checked and size adjusted if needed
Projected reward to risk is at least 2 to 1
Screenshots saved at entry and exit
Decision grade recorded by rule adherence
Position size rule you can audit weekly
Account equity E. Risk per trade equals 1% of E by default.
Stop distance equals the ATR multiple from the plan.
Position size equals risk divided by stop distance. If required size is not tradable, skip the trade.
Bias symptoms you will see on the BTCUSD chart and the fix
Loss aversion . Stops drift lower while price falls. Winners are cut early. Fix . 2 x ATR hard stop and 1 x ATR trail.
Confirmation . Indicators are added until they agree with your view. Fix . 1 written disconfirming note and a higher timeframe check.
Anchoring . Waiting to exit when price returns to entry or to a round level. Fix . Structure based exits and naming the anchor in notes.
Recency . Judgment based on the last 2 candles. Fix . 20 bar context rule and a weekly system review.
Overconfidence . Trade count jumps after a win. Fix . 2 minute cool down and 50% next size after a large winner.
Herd and gambler’s fallacy . Late entries on wide candles and streak thinking. Fix . 2 to 1 minimum reward to risk and a news ban during known high impact windows.
Hindsight and outcome bias . Rewriting rules after 1 result. Fix . Grade by rule adherence and keep entry plus exit screenshots.
Status quo and endowment . Sitting in flat positions you already own. Fix . Monthly retest of every holding against current rules.
Worked example with our numbers
Assuming a daily close above 124,200 triggers the continuation. Initial stop equals 2 x ATR which is 5,765.04. Stop equals 118,434.96. 1R target equals 129,965.04. 2R target equals 135,730.08. Equity equals 20,000. Risk equals 200. Position size equals 0.0347 BTC. As price advances you trail by 1 x ATR which is 2,882.52 and you move the stop only when the trail shifts. If the trail is hit you exit. If 12 bars pass without the 2R target you exit on time and log the decision. You do not widen the stop. You do not add size after a win. You grade the decision by rule adherence.
If momentum stalls
If a daily close rotates down toward 121,000 to 121,500 and momentum weakens, shift to neutral. Wait for a fresh setup that passes the 2 to 1 test at the planned stop.
Do not react to a single candle. The plan lives on the daily chart.
Comparator and scorecard
Use simple Buy and Hold on BTCUSD as the baseline. Score the plan by Return divided by Drawdown, Max Drawdown, and percent of trades executed exactly as written. A smaller drawdown with steady execution beats a higher raw return with poor adherence. Your best forward indicator is the discipline metric you log each week.
Education and analytics only. Not investment advice. Test any rule with historical data before risking capital.

USDJPY - Support Holding Strong!📈USDJPY has been overall bullish trading within the rising channel marked in blue.
This week, USDJPY has been bearish trading within the falling red wedge and it is currently rejecting the lower bound of it!
Moreover, the orange zone is a strong support.
🏹 Thus, the highlighted blue circle is a strong area to look for buy setups as it is the intersection of the lower red trendline and orange support.
📚 As per my trading style:
As #USDJPY is around the blue circle zone, I will be looking for trend-following bullish reversal setups (like a double bottom pattern, trendline break , and so on...)
📚 Always follow your trading plan regarding entry, risk management, and trade management.
Good luck!
All Strategies Are Good; If Managed Properly!
~Richard Nasr

EURAUD – Channeling the Bears!EURAUD has been overall bearish 📉, trading inside a clear descending channel.
Price recently bounced and is now retesting the 1.7800 structure zone, which aligns with the upper bound of the channel. This area is acting as a strong confluence 🔑, making it a potential spot to look for short opportunities.
As long as price remains below this structure, sellers 🐻 are likely to stay in control, with downside continuation toward the channel’s lower bound.
Patience ⏳ is key here — waiting for bearish confirmation can provide a cleaner entry and reduce risk.
⚠️ Disclaimer: This is not financial advice. Always do your own research and manage risk properly.
📚 Stick to your trading plan regarding entry, risk, and trade management.
Good luck!
All Strategies Are Good; If Managed Properly!
~Richard Nasr

EURUSD - Already Overbought!Hello TradingView Family / Fellow Traders. This is Richard, also known as theSignalyst.
📈EURUSD has been overall bullish trading within the rising channel marked in blue.
However, it is currently retesting the upper bound of its channel.
Moreover, the green zone is a strong resistance.
🏹 Thus, the highlighted red circle is a strong area to look for sell setups as it is the intersection of the upper blue trendline and green resistance.
📚 As per my trading style:
As #EURUSD approaches the red circle zone, I will be looking for bearish reversal setups (like a double top pattern, trendline break , and so on...)
📚 Always follow your trading plan regarding entry, risk management, and trade management.
Good luck!
All Strategies Are Good; If Managed Properly!
~Richard Nasr

EURUSD - Bears Are on the MoveHello TradingView Family / Fellow Traders. This is Richard, also known as theSignalyst.
📈EURUSD has been overall bearish trading within the falling wedge pattern marked in red. And it is currently retesting the upper bound of the wedge.
Moreover, the blue zone is a strong structure.
🏹 Thus, the highlighted red circle is a strong area to look for sell setups as it is the intersection of the upper red trendline and structure.
📚 As per my trading style:
As #EURUSD approaches the red circle zone, I will be looking for bearish reversal setups (like a double top pattern, trendline break , and so on...)
📚 Always follow your trading plan regarding entry, risk management, and trade management.
Good luck!
All Strategies Are Good; If Managed Properly!
~Rich
Disclosure: I am part of Trade Nation's Influencer program and receive a monthly fee for using their TradingView charts in my analysis.

Nasdaq Deep Bearish RetraceI Think we're going to retrace (potentially deeply) on FED release or just before it to then reverse aggressively higher.
I am considering the current "range" on m15 as re-distribution and expecting lower prices on Fed release or just prior before continuation higher that may be delayed till tomorrow next FED.

MNQU2025 SELL IDEAMy bias for MNQ this morning with this trade of 2 contracts running. Would like to see price trade lower to 9:30am lows.
What do you guys think will happen? Will post results of the trade below.
Thanks for watching! Give a like if you enjoyed the explanation and a comment on what you'd like me to share with you guys about my trading journey.

Nasdaq Bearish 4hNasdaq Bearish after the failure in continuation through Previous Weekly High and the rejection afterwards.
Setting the Target to 21,471.00 Swing Low and using 21,716.00 as Low Easy Hanging Fruit (LEHF) objective that We may even reach today despite the small range day expectation (pre-CPI)
