BIG PUMP - POWER🐂 LONG – POWER
Price is accelerating strongly on the 15m timeframe, supported by a clear expansion in trading volume—confirming aggressive buyer participation. This combination of momentum + volume often precedes an impulsive continuation move. The structure suggests accumulation has completed and POWER is entering a markup phase, with a high probability of a sharp upside expansion.
🎯 TP: 0.41229
🛡️ SL: 0.21291
📊 RR: 1 : 5.3
A momentum-driven long setup: rising price + volume confirmation → strong upside potential with attractive risk–reward.
Bigmove

Nifty Metal Index NIFTY METAL INDEX Updated Chart for members Reference.
On Big Breakout (BO). On Confirmation Big rally on card 🧐
Support, Resistance /BO level, Tgt, Updated Tgt Marked in Chart.
Stocks to be noted
TATA STEEL
HINDALCO
JINDAL STEEL
SAIL
NMDC & NMDC STEEL
GALLANT ISPAT
WELSPUN
GPIL

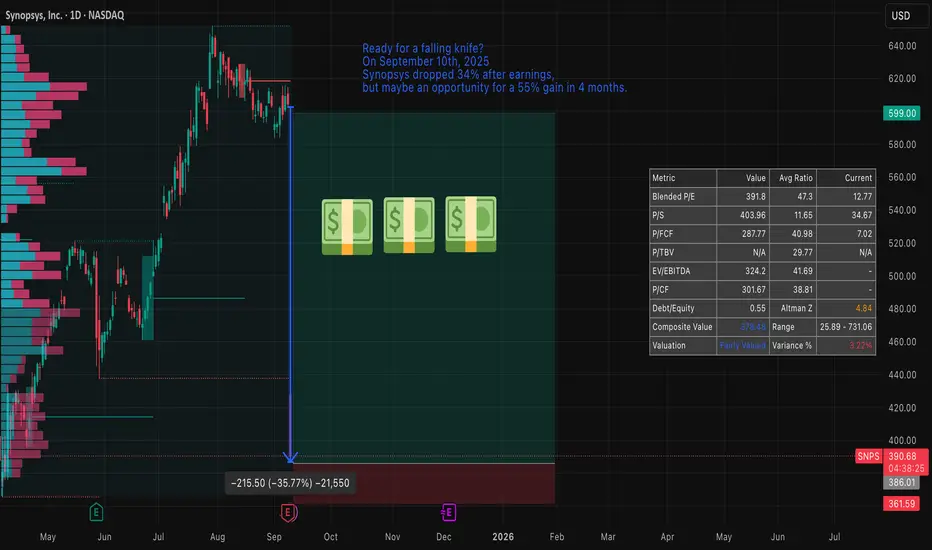
Synopsys — a sharp sell-off, risky entry and clear opportunitySynopsys plunged roughly 30–34% on 10 September 2025, wiping out a large chunk of market value after quarterly results missed expectations and guidance was cut. That kind of move often feels like a “falling knife”: attractive on paper, dangerous in practice.
Price action and technical context
The stock has gapped lower and left a sizeable down-gap to fill. From a technical viewpoint the setup resembles a fast, impulsive sell-off inside a broader downtrend established since the spring; price is now testing levels that were former support in April 2025. Short-term momentum indicators show oversold readings, but volatility is elevated and trend-following measures still favour the downside until a reliable base is formed.
Key technical reference points to watch:
Gap zone/topside resistance: around the pre-drop range near the mid-$600s.
Immediate support / stop placement: just below the April 2025 lows (your stated stop).
Possible gap-fill target: if the market rotates back, reclaiming the gap by January 2026 implies roughly a ~55% upside from current depressed levels (as you noted).
Fundamentals and why this remains an opportunity
Despite the headline shock, Synopsys’s underlying business remains high-quality:
Market-leading positions in EDA tools and IP libraries.
Strong, recurring revenue mix (software subscriptions and maintenance).
Long secular tailwinds from AI, advanced node design and chiplet modularity.
Valuation has re-rated materially after the drop — the company is no longer priced at the frothy multiples of earlier in the cycle. Analysts have revised estimates downward but many still target stock levels clustered around $600, reflecting belief in recovery by late 2025 / early 2026.
Options flow and timing
There is notable open interest concentration in both calls and puts around the $600 strike with expiries in December 2025 and January 2026. That concentration suggests the market expects meaningful activity/interest around that level into the winter and gives a window where a gap-fill or relief rally could materialize before January expiries.
Risk management and trade plan
Trade type: speculative rebound / gap-fill play, not a buy-and-forget investment.
Target: gap-fill / recovery toward pre-drop levels by January 2026 — roughly +55% potential from current depressed price (per your scenario).
Stop: just below April 2025 lows (limits downside if the downtrend resumes).
Position sizing: small relative to portfolio — treat as a high-volatility, event-driven trade.
Alternatives: consider defined-risk option structures (e.g., debit spreads) to cap downside while retaining upside exposure to a gap fill.
Catalysts to monitor
Any updates to guidance or profitability from Synopsys management.
China demand/FX developments and IP licensing commentary.
Options positioning into December 2025 / January 2026 expiries.
Broader semiconductor capital spending and AI-related design win announcements.
Technical indicators to watch
200DMA and April lows (support/resistance anchors).
RSI(14) and MACD for bullish divergence and momentum confirmation.
Volume on any recovery day — strong volume on up days increases odds of a sustained bounce.
Bottom line
This is a high-risk, high-reward setup: a classic “ falling knife ” that can be dangerous if you’re early, but presents a credible opportunity because Synopsys’s fundamentals remain solid, valuation is more attractive, and market positioning (options interest near $600) favors a potential recovery window through January 2026. Use tight risk controls (stop under April lows) and consider defined-risk option plays if you prefer limited downside.
BNC - Where Cycles Meet Opportunity!In our last updates, we tracked how BNC NASDAQ:BNC shifted momentum and entered a bullish structure. Now, price is consolidating at a key support zone, a normal phase in bigger cycles, while the fundamentals continue to strengthen behind the scenes.
📊 Technical Analysis
- Cyclic rhythm: Price continues to respect cyclical lows (highlighted in green), suggesting we’re in a repeating accumulation/rebound structure.
- Support in play: The $20 - $21 level is being tested again, with the stronger $15 support zone still intact as a line in the sand for bulls.
- RSI confluence: Momentum indicators (RSI) are once again dipping into oversold territory, just as they did at the last local low, hinting at potential buyer re-entry.
- 200 MA: Price is sitting near the 200-period MA, adding another layer of dynamic support to watch.
If bulls hold the $20 area, we could see another cyclical rebound play out, targeting higher highs in the weeks ahead.
💡 Bigger Picture
What makes BNC stand out isn’t just its bold BNB strategy — it’s the timing . The crypto market is maturing, yet most U.S. investors are still locked out of direct BNB exposure. ETFs and sovereign funds are circling, but haven’t moved yet.
That means BNC is positioning itself ahead of the institutions - offering retail investors the rare chance to front-run Wall Street. It’s the kind of countercultural setup that often leads to the biggest asymmetrical gains: buy before the herd, hold before the headlines.
📌 Previous BNC analysis is attached for context.
➡ ️ Talk to your financial advisor and start your due diligence on CEA Industries (NASDAQ: BNC) before the institutions move in.
📚 Always follow your trading plan => including entry, risk management, and trade execution.
Good luck!
All Strategies Are Good, If Managed Properly.
~ Richard Nasr

COOK IS COOKING PREMIUM!!Did you missed AIOT (10X)?
Did you missed BROCCOLIF3B (10X)?
NO PROBLEM!
Our brand new algorithm is able to identify this big moves!
Next big move is coming from COOK!!
With take profit at 0.04 and leverage maximum at 3X the profits will be insane!!
Are you the one which will follow us??
We will keep you updated if anything will change ..

ULTIMA SHOWS SAME PATTERN AS BTC BEFORE EXPLOAD TO THE 100K🔥 Ultima has formed a bullish descending flag pattern on the daily chart. The same pattern led BTC to an explosive rise to $100,000 at the end of the previous year.
This pattern is historically a correction in a bullish trend and breaks to the upside, continuing the rise.
Ultima has been one of the strongest technologically backed tokens this cycle . The token has risen in value by over 1000% from its low in the summer and now, having set a new atx, is consolidating under it, gaining strength for the next momentum.
Last weekend was a strong shakeout for leveraged traders and the price corrected to key support at $15,000. And on top of that, a FVG (Fair Value Gap) formed above, which 99% of the time closes sooner or later.
⚙️ Metrics and indicators:
RSI - hit 16.9, which historically signifies an oversold zone and leads to at least a short-term bounce. The last time the RSI reached these levels, Ultima's price rose 469% in 2 months.
MACD - after a prolonged decline, is now approaching to converge and give a bullish cross section, historically signifying a return to an uptrend.
EMA - price has reached the 200 EMA level on the daily chart and is trying to consolidate above, as we all know, the first test of the 200 EMA in a bull market usually leads to explosive buy impulses.
Volume - the entire correction took place over the weekend on lower volumes, dropping gamblers with shoulders. Major buying followed as early as the weekdays with many times the volume.
🌐 Fundamental:
Ultima is a strong project with a good background in the form of a strong dev and marketing team. The token made it to the top 200 CMC in no time. Holds events all over the world and participates itself, presenting really good products like cryptocard.
And the freshly launched in April, trading bot has increased the trading volume of the token many times, which is perfectly visible on the chart. I think many traders were actively shorting at this time, because despite the huge volumes of buyers, there were no strong upward impulses, so now there is a lot of liquidity at the top. And as we know, the price of an asset moves from liquidity to liquidity, it is its fuel.
📌 Conclusion:
The token is now clearly undervalued by the market by all metrics and technical analysis. So it is expected at least a technical bounce, which it has already started by the way, to close the GAP in the range of $15,357 - $20,240.
I have gained a spot position in the support zone of $13,100 - $14,814, with an average entry price of $13,560 and expect at least a return to the listing peak level, at about $18,959, a consolidation above which would probably mean a new ATH.

Long now! No doubt that APE will grow and hit 7$ in 2025Hello guys, I am sharing an idea to open long position on current price of APE and hold it to over 7$, which is the last target shown on the chart///
it has done so much consolidation and then it can grow heavily and pump to the moon, I think the price will be over 4$ by next 2 months, I also have an idea for you, for those who doesn't have enough margin or cash to enter, 1$ which is the strong support at the moment, so if you open a long position with a little money like 50$ and use 5x leverage, at current price (1.12$) your liquidation price will be around 0.89$ - 0.90$ which is below the support level of 1$, then hold it to 4$, it will give over 600$ profit... but don't forget to use the liquidation price as stop loss haha! because a small money like 50$ is already to go, but 600$ opportunity isn't to go...
hope you like the idea, happy trading <3

DRUG (Bright Minds Biosciences Inc.): Massive 2,000% Surge!DRUG (Bright Minds Biosciences Inc.) Super Move Captured with Risological Swing Trader
We entered a long position on 14th October at 1.23 using the daily time frame, catching this explosive upward movement with the precision of the Risological Swing Trader. The indicator identified the perfect entry point, allowing us to ride this massive surge effortlessly. As of now, the price has reached $26.90, delivering an exceptional return.
Target Points Achieved:
TP 1: 1.40
TP 2: 1.68
TP 3: 1.95
TP 4: 2.12
This trade exemplifies the strength of the Risological Swing Trader in identifying major opportunities and turning them into extraordinary gains.

my BEARISH expactation for PEPE/USDTwe see on the weekly a big head and schoulders formed. the neckline broke en retested 2 times! i believe it time to go heavy short because a big cvrash is coming ( believe it or not) it wil first pull up a bit to.... 0.5 / .618 fib ? not sure, i prefer ro short t the 0.5, not to big leverage ( max 20) and protect as soon as possible and enjoy the free ride, ------ its a +-83% drop if it goes that low -----.
enjoy. en lets hope for the best.

DJI - Key Resistance Zone 4 HourDJI has entered a key resistance zone of the 4 HOUR time frame.
There are 3 likely scenarios. A,B,C on the chart.
We are waiting for a definitive move on the charts, we are looking for a BREAKOUT, either BIG VOLUME breaking the resistance level, or a REJECTION of the resistance level, followed by great volume.
The third move that could be made is ACCUMULATION / RANGING. Where there is little to no volume with no definitive move, we will NOT ENTER if this is the case.

BTCUSDT | UP UP UP!Are we finally going up? It’s quite possible!
Market Context
Bitcoin is showing strong signs of a potential upward movement. Despite a poor weekly candle close, this might be a clever fakeout designed to shake out the shorts. Let’s dive in!
Bullish Signals
• Weekly Liquidity: There’s a ton of liquidity above $72K, and Bitcoin loves to chase liquidity.
• Bullish Divergence: On the daily chart, we see a bullish divergence forming. This is often a precursor to significant upward moves.
• Weekly Uptrend: We’re still trading within an uptrend on the weekly chart.
• Engulfing Candle: A huge bullish engulfing candle post-divergence indicates that the bulls are back in action.
Strategy
I’m betting on a substantial upward move for BTCUSDT. Targeting SWB:69K as TP1, and who knows? $100K could be on the horizon. It’s not just a dream—it’s a real possibility given the current setup.
Action Plan
Going long on BTCUSDT. Let’s ride this wave and aim high!
Good luck, everyone! 🚀🌕

AKROUSDT | Bearish Vibes Ahead?Market Context
The market’s got a bearish vibe, and with the weekend approaching, we might see some significant downward movements. Time to capitalize on the bearish trend!
Chart Analysis
• Weekend Strategy: Weekends often bring volatility, and with the current bearish sentiment, AKROUSDT looks primed for a move down.
• Bearish Signals: Technical indicators are flashing red, suggesting a potential drop is imminent.
Strategy
I’m shorting AKROUSDT, riding the wave of bearish momentum. The setup is perfect for a weekend trade, with all signs pointing to further declines.
Action Plan
Entering a short position on AKROUSDT to take advantage of the anticipated bearish action. Let’s see if we can turn this market sentiment into profit!
Let’s nail this bearish trade! 📉🔥

ALTUSDT | Preparing for Another Leg Down?Market Context
Bitcoin’s downward trend suggests we might see more bearish action in the coming weeks. As BTC drops, the ripple effect is likely to hit the entire market, making ALTUSDT a prime candidate for further declines.
Chart Analysis
• BTC Influence: Bitcoin is leading the market downwards, and ALTUSDT is poised to follow.
• Bearish Indicators: Technical indicators and market sentiment are aligning to signal more downside for ALTUSDT.
Strategy
I’m going short on ALTUSDT, betting on another leg down. The current market conditions provide a solid setup for this move.
Action Plan
Entering a short position on ALTUSDT to capitalize on the expected bearish trend. Let’s see if this theory holds true and delivers some solid gains on the downside.
Let’s catch this wave down together! 📉🔥

LEVERUSDT | Another Shot at the Moon?Market Context
Yesterday’s trade on LEVERUSDT was almost a win, but we got stopped out just before the price shot up. Let’s not miss out this time!
Chart Analysis
• Bullish Momentum: LEVERUSDT showed strong potential for an upward move, and despite yesterday’s stop out, the bullish signals remain intact.
• Demand Zone: The demand zone we identified is still a prime spot for entering a long position.
Strategy
I’m going long from the demand zone once again, confident that today’s move will play out in our favor. The setup is too promising to pass up!
Action Plan
Re-entering at the demand zone, ready to capitalize on the bullish momentum. Let’s hit that profit target this time and ride the wave to the top!
Let’s go, traders! 🚀📈

Keys to the Kingdom: How to Become a Badass TraderReady to unlock the secrets of badass trading? In this video, I'm sharing the ultimate guide to becoming a successful and confident trader. Whether you're a beginner or a seasoned pro, these tips and strategies will elevate your trading game to new heights.
We'll cover:
Mastering technical analysis and reading market trends
Developing a solid trading plan and sticking to it
Managing risk like a pro to protect your capital
Recognizing key opportunities for maximum gains
Building the right mindset for trading success
Join me as I reveal the keys to the kingdom and transform you into a badass trader. Don't forget to like, comment, and subscribe for more powerful trading insights and strategies. Let's dominate the markets together! 🚀💹

Btc new athHi everyone, wish u all a great weekend
New ath for btc/usdt will be happening till 5th jun
Then we will go for a big dump
Hope u get noticed
Wish u the bests

BUY NEAR NOW!!! THIS IS THE LOWEST IT WILL GET!FINALLY! After waiting for so long, It has finally reached the area of interest for higher prices! I full ported this in, holding for the long term!!! This is the one! It can possibly go lower, but the perfection in between the lines is absolutely insane! Looking for higher highs from here on!! Get ready for the Halving!

SOLANA BUY ALERT!! 30% - 35% Gain! (Dont miss out!)Looking for Solana to trigger the sell stop order, this mean, people who have orders below or @ that level will think "support is broken, we're bearish" when in reality, we just want take their money. I am aiming for $155 - $155.20 to buy. Best case is to enter a bit early such as $156 - $157 just to make sure you are actually in. This is to reach new highs on the recent time frame and ATH over time.

What you think about it 🤔😂 What you think about it 🤔😂 ! But wait ✋ think about this analysis seriously or regret later 📉📈🔥....may be it can be take support at $3500 also 💀 or take off on right now price ( between $17k or $20k ) 🚀 as compared to 2020.
also btc big f*cking rally coming soon (In 2024 📈🔱) so best of luck 😉👍to all.

Gold at a crossroad, 200 USD+ move, massive symmetrical triangleThis is a Daily chart for Gold. On it we can notice that the price has formed a massive symmetrical triangle. As per the deffinition of the pattern, after the price produces a breakout up or down, the potential movement can be equivalent to the distance between the highest and the lowest points in the pattern. This is about 215 USD movement
If the price breaks to the up side, according to the pattern, it can reach levels of about 2250 - 2270. If it breaks down then it can drop close to the 1800 level
Additional confluence:
- On the daily chart, the price has been showing a lot of respect towards the 50 EMA. On the latest drop it hit it and bounced straight up from it. On the 4H chart, the situation is similar with the 200 EMA

golden wave counting gold price went form 1810 to 2148 in just two month
this rally shocked everyone
what was most shocking instant reversal from all time high which nobody expected
abc wave has now retrace 50% near 1980 that is why you are seeing intraday support near that level
gold next move from depends on fed fomc today ,
which will decide gold will go 1930 or retrace back to 2007

Litecoin's Hidden Secret: Life-TIme Double Bottom Pattern🚀In the symphony of crypto charts, Litecoin (LTC) unveils a hidden masterpiece—a recurring Double Bottom pattern that has quietly shaped its journey. A closer examination reveals a substantial resistance zone from $300 to $500, and the revelation of this pattern suggests a promising narrative: once breached, the path to $1000 may be within Litecoin's grasp.
Chart Analysis: The Persistent Double Bottom Symphony
LTC's Artful Consistency:
Litecoin, throughout its historical charts, consistently paints the portrait of a Double Bottom pattern.
This pattern, formed by two distinct troughs at approximately the same price level, signifies a potential trend reversal.
Critical Resistance Zone: $300 - $500:
Litecoin encounters a formidable resistance zone ranging from $300 to $500.
A breakthrough beyond this zone would not only signify a major technical achievement but also pave the way for new possibilities.
Anticipated Scenarios: Breaking Free to $1000
Breaking the Shackles:
The persistent Double Bottom pattern suggests that Litecoin has been wrestling with a key resistance zone for an extended period.
A decisive breach above $500 might unleash Litecoin from historical constraints, with $1000 emerging as the next major milestone.
Strategic Approaches: Unleashing Litecoin's Potential
Strategic Entry Points:
Traders eyeing Litecoin's potential breakout might strategically position themselves before or during the breakthrough of the $500 resistance.
Vigilant entry, coupled with risk management, could be essential for capitalizing on the anticipated move.
Monitoring Resistance Dynamics:
Continuous monitoring of Litecoin's price action within the $300 - $500 range is imperative.
Breakout confirmation and sustained momentum above $500 would be crucial for validating the potential journey to $1000.
Conclusion: A Symphony Unfolding in Litecoin's Charts
As Litecoin follows the rhythm of a persistent Double Bottom pattern, traders and enthusiasts alike are eagerly awaiting the crescendo—a breakthrough above the $500 resistance. The stage is set for Litecoin to redefine its narrative and potentially embark on a journey towards the coveted $1000 mark.
🚀 The Hidden Double Bottom Symphony | 🎨 Breaking the $500 Resistance Palette | 🌌 Envisioning Litecoin's Ascent to $1000
❗See related ideas below❗
Share your insights on Litecoin's chart dynamics and join the conversation about the potential breakthrough and its implications. 💚🚀💚

USD/JPY TRADING JOURNALThis will be a full journal we recorded all updates and trades on the USDJPY pair
Trade 1: The current price is approaching an all-time high, and reports suggest that it is proving to be quite resilient. A noticeable retest is underway, indicating a strong potential for a significant decline. Please note that at the time of sharing this signal, the market is closed. Therefore, consider entering this trade as soon as the market reopens. Feel free to follow us for real-time updates.
Our initial trade will be a short position with two take profit levels, and the second trade will be a risk-reward ratio of 1:4
🔴Signal
Current price : 149.554
❌SL : 152.5
✅ TP1 : 145
✅TP2 : 138.5
🖌RISK MANAGEMENT ACCOREDING TO YOUR CAPITAL
0.01 LOT FOR EVERY 2K CAPITAL
This is one of our long trades with a big SL and a big TP so please risk mange
