Immunome (IMNM) — ADC-Led Precision Oncology UpsideCompany Overview
NASDAQ:IMNM Clinical-stage biotech focused on targeted cancer therapies, especially antibody–drug conjugates (ADCs) and precision oncology.
Lead Asset — Varegacestat (desmoid tumors)
Phase 3 RINGSIDE: 84% reduction in risk of progression; 56% response rate → compelling best-in-class profile.
Regulatory path: NDA planned Q2 2026, setting up the company’s first commercial launch and a major inflection point.
Pipeline Momentum (2026–2027 catalysts)
IM-1021 (ROR1 ADC): early Phase 1 data in 2026.
IM-3050 (FAP radioligand): entering Phase 1.
Multiple preclinical ADCs → INDs, broadening optionality across hard-to-treat tumors.
Why It Matters
Differentiated targets + next-gen payloads → partnerability and durable competitive moat.
Multi-asset pipeline = layered catalyst stack through 2026–2027.
Investment View
Bullish above: $21–$22
Upside target: $40–$42 — driven by NDA/launch setup and ADCs + radioligand pipeline execution.
Biotech

PRME 1W(Prime Medicine, Inc.) - Editing the futurePrime Medicine, Inc. is a biotechnology company focused on next-generation gene editing technologies, targeting rare genetic diseases and currently operating in an active R&D phase.
On the weekly chart, PRME has completed a breakout from a long-term downtrend and is now consolidating during a structural retest. Price is holding within the 3.59–4.00 support zone, where the broken trendline retest, the 0.618 Fibonacci level, and a high-interest volume area align. Price remains above the EMA, confirming that buyers continue to control the structure within the current range. Volume expanded during the breakout and has cooled during consolidation, which is typical behavior during accumulation phases. The current area represents a high-demand zone according to the volume profile, reinforcing its structural importance.
From a fundamental perspective, the company remains unprofitable, which is typical for early-stage biotech. Estimated EPS for Q4 2025 is −0.25 USD, with projected revenue of 2.08M USD. Cash flows remain negative, but liquidity levels are high and debt pressure is not critical, allowing continued R&D without immediate capital stress. Market valuation is driven by expectations around clinical progress rather than present financial performance.
This is a higher-timeframe structural transition story, where the market gradually reassesses the asset after a prolonged decline. Biotech is never about comfort, but this is how early reversals usually start.

PRAX: good looking base formation and trend structure NASDAQ:PRAX showing constructive base formation and a stable trend structure. As long as price holds above the 147–120 mid-term support zone, the setup supports potential extension toward the 450+ resistance levels.
Chart:
Weekly view:

Google’s AI Pivot: The World’s Next Pharma GiantAlphabet recently shattered Wall Street expectations with its Q4 2025 earnings report. Management is aggressively increasing capital expenditure for 2026. This spending fuels a massive expansion of AI infrastructure. Investors now see a clear shift in Google's corporate strategy.
The Great Technological Pivot
Google is no longer just a search engine company. It is transforming into a dominant scientific powerhouse. DeepMind remains the crown jewel of this technological ecosystem. Their newest AI models now learn faster than any previous systems.
From AlphaFold to AlphaGenome
AlphaFold already solved the protein-folding mystery for global science. Now, AlphaGenome decodes the "dark matter" of the human genome. It processes a million DNA letters at once. This tool predicts gene regulation with unprecedented precision.
The Most Important Pharma Company
This technology transforms Google into a pharmaceutical powerhouse. Traditional drug discovery is notoriously slow and expensive. Google’s AI accelerates this process by several decades. They now own the digital blueprint of human biology.
Patent Analysis and High-Tech Moats
Google’s patent portfolio reveals a deep focus on biotechnology. They dominate the foundational algorithms for life sciences. This intellectual property creates an unassailable competitive advantage. No traditional pharmaceutical company can match this computational scale.
Geostrategy and Leadership
CEO Sundar Pichai is leading an "AI-first" biological revolution. This geostrategy secures Google's role in global health security. Management is prioritizing long-term scientific dominance over advertising growth. They are building a more resilient, high-tech business model.
Macroeconomics and Cybersecurity
Macroeconomic pressures do not hinder their scientific progress. Google secures sensitive genetic data with advanced cybersecurity. This trust remains vital for the future of medicine. Alphabet is becoming the ultimate architect of human longevity.

Short on CRISPR Therapeutics AG (Ticker CRSP)NASDAQ:CRSP
Technicals:
- 5 touches of 59.30 ressitance since 5 Dec. without breakout
- ressistance on 0.382 fibo after breaking to 0.618. Measure since 8 Apr.
- potential downside to 43.00 - 44.50 support zone matching 0.786 fibo
- ыcenario invalidated if two bars close above 61.12
Fundamentals:
- local uncertainty after insider sales by CEO. Average price 60.19 per share
- long term development remains promising, taking into account industry's defensive profile in a recession
# - - - - -
⚠️ Signal - Sell ⬇️
✅ Entry Point - 55.52
# - - - - -
🛑 SL - 61.54
🤑 TP - 42.89
⚙️ Risk/Reward - 1:2.1 👌
⌛️ Timeframe - 1 month 🗓
# - - - - -

MRNA Story - On A Smaller ScaleIn continuation of the previous idea, I wanted to cover the shorter time frame move on $NASDAQ:MRNA.
Really, this is a more simple analysis as the base is clearly set on the weekly chart. I should note I have analyzed the consolidation on the 2-Week time period. The 2-Week time period does also give a range expansion signal, but for a more detailed look I am showing the 1-Week time period.
With the current base, and a measure of this consolidation range (from low to high), a first target of $42.76 can be obtained. If the trend continues in a really strong fashion, a second target of $68.17 would look to be hit. Sometimes when an explosive move like this happens, a retest of the mode can occur like in the example path shown below. However, just as the continuation of this trend remains to be seen, so does any retest of this move. Make bets accordingly.
Whether the trend continues, and how strong it remains, of course is yet to be determined. But this analysis allows for educated guesses to be made and positions to be taken.
Best of luck to all of us who are entering positions and looking for continuation of this trend reversal play.
Pasting the regular weekly chart (no path) here:
Enjoy,
Reagen

Why Definium Therapeutics Inc. $DFTX Looks Poised for a BreakoutThis chart shows a classic long-term base > trend reversal > momentum expansion setup.
NASDAQ:DFTX
1. Multi-year base = structural reset
After the 2021 blow-off top and full capitulation, Definium Therapeutics Inc. spent nearly 2+ years building a flat, low-volatility base in the $2–$6 range. That kind of time compression typically resets shareholder structure and washes out weak hands. Long bases matter because they often precede outsized directional moves.
2. Higher lows + rising moving averages
Price is now making consistently higher lows, and the 50-day MA has crossed above the 200-day MA (golden cross). More importantly, price is holding above both averages. That signals a transition from accumulation to a new primary uptrend, not just a dead-cat bounce.
3. Volume confirms institutional interest
The recent advance is accompanied by expanding volume, not declining volume. That’s critical. Breakouts that fail usually do so on weak participation. Here, volume is increasing as price moves higher, suggesting real demand, not retail chasing.
4. Momentum expansion (MACD)
MACD is turning positive and accelerating, which aligns with the price trend rather than diverging from it. This tells you momentum is supporting continuation, not exhaustion.
5. Overhead resistance is thin
Once price cleared the ~$10–$12 zone, it entered an area with little historical resistance until much higher levels. Markets tend to move faster when there’s less prior supply overhead.
6. Relative strength
The relative performance vs. the broader market (shown at the top) is sharply rising. That means this isn’t just a market beta move — DFTX is outperforming, which is what strong breakouts do.
---
There’s a lot of tension in the article around “pharma gatekeeping” vs grassroots access to natural mushrooms. But if you strip away the politics and look at what actually came out of this, it reinforces something we’ve seen over and over. When states get serious, they default to hospital-based, physician-led, FDA-aligned models.
NJ Psilocybin Legislation Exposes Conflicts Between Advocates for Different Therapeutic Models
---
Definium Therapeutics stock price target raised to $36 from $20 at RBC Capital NASDAQ:DFTX
---
Definium Therapeutics Sets 2026 Milestones: Three Phase 3 Trial Readouts Poised to Transform Psychiatric Care
Key Developments: DFTX is Targeting Data-Driven Breakthroughs in Mental Health
Definium Therapeutics (NASDAQ:DFTX), formerly Mind Medicine (MindMed), has sharpened its focus and reemerged with a mission: deliver transformative psychiatric treatments anchored in rigorous clinical evidence. With three Phase 3 trial readouts scheduled for 2026—including the highly anticipated Voyage study of DT120 ODT (orally dissolving tablet) for generalized anxiety disorder (GAD)—investors and clinicians alike are taking notice as DFTX aims to reshape the standard of care for anxiety and depression.
Clinical Pipeline: Multiple Late-Stage Trials Set for Results in 2026
DFTX’s late-stage pipeline features four ongoing Phase 3 trials evaluating DT120 ODT, a candidate that has already received FDA Breakthrough Therapy Designation for its novel approach in GAD. The company plans to deliver data across two of the largest psychiatric indications, affecting over 50 million people in the United States alone. Highlights for 2026 include:
Trial Name Indication Expected Milestone
Voyage Generalized Anxiety Disorder (GAD) Phase 3 Topline Data (Q2 2026)
Panorama GAD Topline Data (H2 2026)
Emerge Major Depressive Disorder (MDD) Topline Data (Mid-2026)
Ascend MDD Initiation (Mid-2026)

$PGEN: decent upside potential NASDAQ:PGEN continues to act well from the mid-term support zone highlighted in the September and October updates.
I’ll be viewing any potential pullbacks toward the rising EMA as possible buying opportunities, with the next target resistance zone near 8.
Chart:
Previously:
On support (Oct 8): weekly review —
Chart:
On bullish structure (Sep 15): www.tradingview.com
Chart:

Viking Therapeutics (VKTX) Impending Breakout!VKTX recently bounced hard on the 200-day SMA two days ago. Yesterday, VKTX surged 12% on news that the company could be a takeover target of a larger pharma company. The chart shows a longer-term downtrend line (dotted blue line) that touches some of the high points, going back to early 2024.
Many more contact points occurred over the recent few months, which shows that VKTX is "fervently determined" to break above this downtrend line. Combine this observation with the recent hard bounce off the 200-day SMA and the Nov'25 Golden Cross event (50-day SMA cross over 200-day SMA), it becomes apparent that VKTX is on the verge of a massive breakout higher.
I am preparing for this big move to the upside by loading up on ITM call options with expirations up to a year out. I chose ITM calls because they are lower risk. Even though I trade off a higher leverage factor for a lower one, I will still make bank if VKTX moves anywhere that Analysts are predicting ($92 per share average price target).
Good luck all!

Eli Lilly & NVIDIA: A $1B AI Pharma RevolutionEli Lilly’s $1 billion partnership with NVIDIA signals a seismic shift in pharmaceutical valuation and strategy.
The convergence of biology and silicon is no longer theoretical; it is the new standard for industry leadership. By integrating NVIDIA’s AI supercomputing into its core operations, Eli Lilly (NYSE: LLY) is transitioning from a traditional drug maker to a bio-computation giant. This move secures its dominance not just in medicine, but in the high-growth data economy.
Technology & Science: The "Loop" Advantage
The core of this growth thesis is the new "loop-style" discovery system. Traditional drug discovery is linear, slow, and prone to failure. Lilly’s new model utilizes an AI supercomputer to generate molecular candidates, which physicians then test. Crucially, the biological data from these tests immediately feeds back into the AI, refining the model in real-time. This recursive learning cycle drastically reduces the time-to-market for new therapies. Science is now software-defined, and Lilly controls the source code.
Industry Trends & Economics: Capturing the $105B Market
The financial implications are staggering. The drug discovery market hit $105 billion in 2025, growing at a steady 10% annually. However, the real explosion lies in AI-enabled discovery, currently under 20% of the sector but projected to expand sixfold by 2034. Lilly is not just participating in this growth; they are engineering it. By dominating AI-driven discovery, they unlock inroads to the $550 million U.S. production market, effectively vertically integrating intelligence with manufacturing.
Geopolitics & Geostrategy: Health Security
Pharmaceutical dominance is a pillar of modern national security. Nations that control the fastest drug discovery platforms possess a distinct geostrategic advantage. By onshoring this supercomputing capacity, Eli Lilly aligns itself with U.S. interests in biological resilience. This reduces reliance on foreign research supply chains and positions the company as a strategic asset. Investors should view this as a government-aligned moat that insulates the stock from standard market volatility.
Cyber & High-Tech: The Data Fortress
Integrating NVIDIA’s Thor IGX platform transforms Lilly’s cyber profile. The company is no longer just protecting formulas; it is guarding proprietary training data. This shift demands a "Zero Trust" cyber architecture. As Lilly digitizes biological experimentation, its database becomes one of the most valuable intellectual properties on earth. Management’s foresight to secure industrial-grade AI infrastructure proactively mitigates the risks of IP theft in an era of digital espionage.
Management & Leadership: A Culture of Disruption
Corporate leadership is abandoning the "siloed" R&D model. Lilly’s executives are aggressively fostering a culture where data scientists sit equal to biologists. This cross-pollination drives innovation speed. While competitors hesitate to disrupt legacy workflows, Lilly’s management is betting the balance sheet on generative AI. This decisiveness commands a valuation premium. It signals to shareholders that leadership prioritizes long-term structural dominance over short-term quarterly safety.
Conclusion
Eli Lilly is redefining the pharmaceutical business model. Through its partnership with NVIDIA, it has effectively operationalized the future of medicine. For investors, LLY is no longer just a healthcare play; it is a high-tech growth stock backed by biological assets.

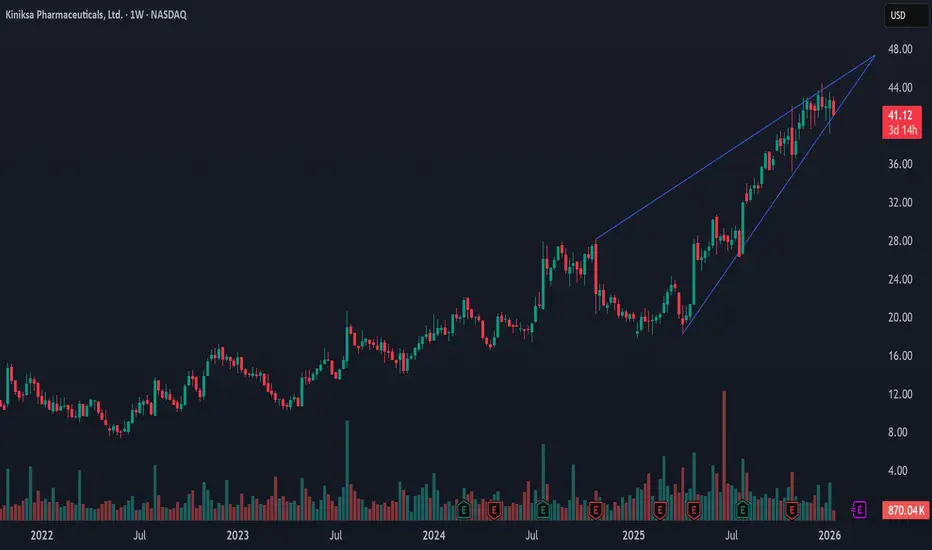
Kiniksa Pharmaceuticals Strategic Dominance Kiniksa Pharmaceuticals (KNSA): Strategic Dominance in Inflammation Therapy
Kiniksa Pharmaceuticals (KNSA) has executed a decisive pivot from clinical speculation to commercial profitability. Driven by the aggressive expansion of its flagship asset, ARCALYST (rilonacept), the company has fundamentally altered the treatment landscape for recurrent pericarditis. The company’s ability to "flip the script" from a net loss to an $18.4 million profit in Q3 2025 signals a maturation of its business model that warrants serious investor attention.
Industry Trends: The Shift in Standard of Care
The cardiovascular landscape is moving away from broad-spectrum anti-inflammatories toward precision biologics. Historically, recurrent pericarditis—a debilitating inflammation of the heart's sac was treated with NSAIDs or corticosteroids, often with poor long-term outcomes.
Kiniksa has capitalized on this unmet need by establishing ARCALYST as the first and only FDA-approved therapy specifically for this indication. The trend is clear: physicians are abandoning "watch and wait" approaches in favor of targeted Interleukin-1 (IL-1) blockers. The data support this shift, with over 3,825 physicians now prescribing the drug, including 350 new prescribers in the third quarter alone.
Financial Performance: A Profitability Inflection
Kiniksa’s Q3 2025 financials reveal a company hitting its stride.
* Revenue Surge: Quarterly revenue hit $ 180.9 million , a $69 million jump year-over-year.
* Guidance Raise: Management increased full-year revenue guidance to $670–$675 million .
* Bottom Line: The company reported $18.4 million in net income, reversing a $12.7 million loss from the prior year.
This financial discipline suggests Kiniksa is no longer reliant on dilutive capital raises to fund operations, a rare stability marker in the volatile mid-cap biotech sector.
Innovation & Science: The Next-Gen Pipeline
While ARCALYST drives current cash flow, Kiniksa’s long-term value lies in KPL-387 . This investigational therapy targets the same IL-1 alpha and beta pathways but offers a significant upgrade in delivery: a monthly injection.
Currently, ARCALYST requires weekly dosing. A monthly alternative would drastically improve patient compliance and "stickiness," fortifying Kiniksa's moat against future competitors. With Phase 2 results expected in the second half of 2026, this asset represents a potent call option on the company’s future growth.
Business Model: Patient Retention
Kiniksa’s commercial strategy focuses on the duration of therapy. The average patient now remains on ARCALYST for 32 months , up from 30 months previously. This increase in "lifetime value" per patient is a direct result of aggressive prescriber education and patient support programs. Furthermore, 20% of prescriptions are now written after a first recurrence, indicating the drug is moving earlier in the treatment line, a critical expander of the total addressable market (TAM).
Market Sentiment & Valuation
Despite the bullish fundamentals, KNSA stock trades at a discount to analyst expectations.
* Current Price: ~$42
* Average Price Target: $54
* Analyst Consensus: 7 "Strong Buy" / 1 "Moderate Buy."
The market appears to be discounting the durability of the ARCALYST franchise, perhaps fearing a growth plateau. However, with only 15% market penetration among eligible patients, the data suggests the growth runway remains substantial.
Summary
Kiniksa Pharmaceuticals has successfully transitioned from a "burn" story to an "earn" story. With a profitable quarter, a growing monopoly in pericarditis, and a de-risked pipeline asset in KPL-387, the company presents a compelling risk/reward profile. The divergence between the stock price ($42) and the average target ($54) offers a clear tactical entry point for investors seeking exposure to high-growth, profitable biotech.
IMRX Market Maker ModelThe algorithm has executed a terminal "Macro Buy-Side Liquidity Purge" at 8.50, violently rejecting the highs to reprice into the Monthly Fair Value Gap (FVG) at 4.66. The current price action represents a high-risk, high-reward "Return to Origin" setup; the market is compelled to engineer a technical bounce to mitigate the massive inefficiency created by the collapse, targeting the 6.00 equilibrium before any further structural decision is made.
EXECUTION VECTOR (THE DEAD CAT BOUNCE)
Entry: 4.50 - 4.70 (Current Market Price - Inside the Monthly FVG)
Stop Loss: 3.90 (Structural Invalidation below the Breakout Base)
Take Profit: 6.00 (Bearish Breaker / 50% Retracement of the Crash)
Risk to Reward Ratio: 2.5R
THE CAUSAL RATIONALE
The Opportunity (The Macro Purge)
Look at the Weekly Chart:
That massive wick leaving 8.50 is not just a rejection; it is a "Death Candle." It signifies that the entire rally from the lows was a calculated operation to harvest the liquidity resting above the 2023 consolidation highs. The Smart Money used that spike to exit their positions into the buying frenzy of retail chasers. The job "up there" is done. The liquidity has been taken.
The Entry (The Monthly FVG Support)
However, markets do not move in straight lines. The collapse from 8.50 to 4.66 was too fast. It created a "Liquidity Void" on the downside. The price has now slammed into the "Monthly Fair Value Gap" and the "Order Block" that launched the move. This is the "Scene of the Crime." Algorithms are programmed to defend the origin of a move on the first test. We are buying the *reaction* to this support, not a new bull run.
The Invalidation (The Trap Door)
The Omega Point is a daily close below 3.90. If price accepts value back inside the old consolidation range, it confirms that the breakout was a total failure (a "Look Above and Fail"). In that scenario, the price will rot and drift back towards 2.00. The "Monthly FVG" must hold as a trampoline.
THE PROBABILISTIC LANDSCAPE
Key Trajectory Waypoints
Target 1: 5.50 | Type: Local Resistance / Gap Fill | Probability: 70% | ETA: 2-3 Days
Target 2: 6.00 | Type: Equilibrium (50% of Drop) | Probability: 50% | ETA: 1 Week

OVID Therapeutics (OVID) - Biotech with strong nervesOVID Therapeutics is a biotech company focused on developing treatments for rare neurological and genetic disorders.
On the monthly chart, OVID has broken above a long-term descending trendline and is currently retesting it from above. The key support zone sits at 1.45, while the latest close at 1.67 confirms structure preservation. Volume expanded on the breakout and faded during the pullback, indicating a healthy retest. Monthly MACD remains above zero and shows bullish divergence, while RSI holds above 50, confirming a shift in market phase. Volume profile suggests a potential magnet zone above current prices if support continues to hold.
Fundamentally, the company remains unprofitable, which is typical for a development-stage biotech. Q4 2025 EPS is expected at −0.11, revenues are minimal, but debt levels are manageable and cash reserves provide operational runway.
This is a higher-timeframe positioning idea, where the market begins to reassess the asset after a prolonged downtrend. Biotech is never comfortable, but this is how monthly reversals usually start.

DBV Technologies (DBVT) — Non-Invasive Food Allergy BreakthroughCompany Overview
DBV Technologies NASDAQ:DBVT is a clinical-stage biotech developing epicutaneous immunotherapy (EPIT) via the Viaskin® patch for food allergies—an easy, non-invasive approach for pediatrics.
Key Catalysts
Phase 3 Win (VITESSE): VIASKIN Peanut achieved 46.6% response vs. 14.8% placebo in children 4–7, validating efficacy and safety ahead of a planned BLA in H1 2026.
Regulatory & Funding Momentum: Warrant exercises bolster cash; plans to expand into younger age groups increase addressable market.
Durability & Platform Potential: Long-term extension data support sustained benefit and optionality across multiple food allergies.
Why It Matters
Non-invasive, patch-based therapy = high caregiver/child acceptance
Clear regulatory path plus broader age expansion → larger, earlier TAM
Platform line-of-sight beyond peanut to multi-allergen pipeline
Investment Outlook
Bullish above: $14.50–$15.00
Target: $28–$30 — supported by Phase 3 efficacy, upcoming BLA, and platform durability.
#DBVT #Viaskin #EPIT #FoodAllergy #Pediatrics #Biotech

Ride the Wave to $33Biotech's can offer explosive gains
And disastrous collapses.
#WVE is a great example of that.
And a great illustration how powerful head and shoulders tops and bottoms are.
I have to apologise I was looking at this company yesterday as having a nice setup.
but unfortunately neglected to share the idea... (the company is exploding during premarket trade)
But I believe dips should be viewed as opportunities as this stocks clearly wants to go higher.

Teva 2026: The Biopharma Titan of the AI Protein Era
Teva Pharmaceutical Industries has moved far beyond its origins as a generics giant. Under the "Pivot to Growth" strategy, the company recorded its 11th consecutive quarter of growth in late 2025. As of January 2026, Teva stands as a revitalized biopharma leader. The company’s transformation focuses on innovative medicines, biosimilars, and high-tech manufacturing.
Geostrategy and Macroeconomics: A Resilient Foundation
Teva utilizes its massive global footprint to navigate complex geopolitical shifts. With over 50 manufacturing facilities, it maintains the industry's largest fully integrated network. This scale provides a critical buffer against global supply chain disruptions. Furthermore, Teva has successfully managed the impacts of the U.S. Inflation Reduction Act. The company’s strategic pricing and market access ensure steady revenue from blockbuster assets like Austedo.
Industry Trends: The Biologics Pivot
The pharmaceutical industry is rapidly shifting toward complex biologics. Teva anticipated this trend by divesting its small-molecule active pharmaceutical ingredient (API) business. This move reallocates billions in capital toward high-margin innovative therapies. The company’s biosimilar portfolio is expanding aggressively, with plans for over 30 products by 2027. This shift significantly improves operating margins and strengthens Teva’s competitive moat.
Management and Leadership: The Francis Era
CEO Richard Francis has redefined Teva’s corporate culture. His "Pivot to Growth" framework focuses on four key pillars: growth engines, innovation, generics, and business focus. Analysts praise his disciplined capital allocation and focus on pipeline maturity. Under his guidance, Teva has stabilized its debt and regained the trust of institutional investors. The company is now a lean, innovation-first organization.
Innovation and Patent Analysis: Protecting the Future
Teva’s innovation engine is delivering record results. Branded drugs like Austedo, Ajovy, and Uzedy showed 33% growth in recent cycles. The company actively secures patents for long-acting injectables and next-generation delivery systems. These intellectual property assets prevent competition and ensure long-term profitability. Teva’s patent strategy focuses on high-value therapies that will remain exclusive well into the 2030s.
The Premier "Fab" for AI Protein Folding
The surge in AI-driven protein folding companies creates a massive need for manufacturing capacity. Teva is perfectly positioned to become the "Fab" (fabrication) partner for these digital biotech firms.
* World-Class Bioreactors: * Teva operates one of the most sophisticated mammalian cell-culture networks globally.
* Teva Rise Platform: This open innovation hub directly connects AI startups with Teva's manufacturing expertise.
* The Bridge to Scale: Protein folding companies design molecules digitally but lack the factories to produce them. Teva provides the physical infrastructure to turn AI designs into life-saving medicines.
* Bioprocess Expertise: Teva’s scientists excel at the complex folding and purification of recombinant proteins.
By acting as the manufacturing backbone for the AI revolution, Teva secures a dominant role in the future of biotechnology.
Digital Frontier: Cyber and Science
Teva integrates "Industry 4.0" technologies across its entire production line. The company uses AI to predict product quality and optimize supply chain logistics. This scientific approach reduces waste and accelerates the delivery of medicine to patients. Robust cyber-resilience protocols protect Teva’s valuable proprietary data from evolving threats. These advancements solidify Teva's status as a modern high-tech leader.

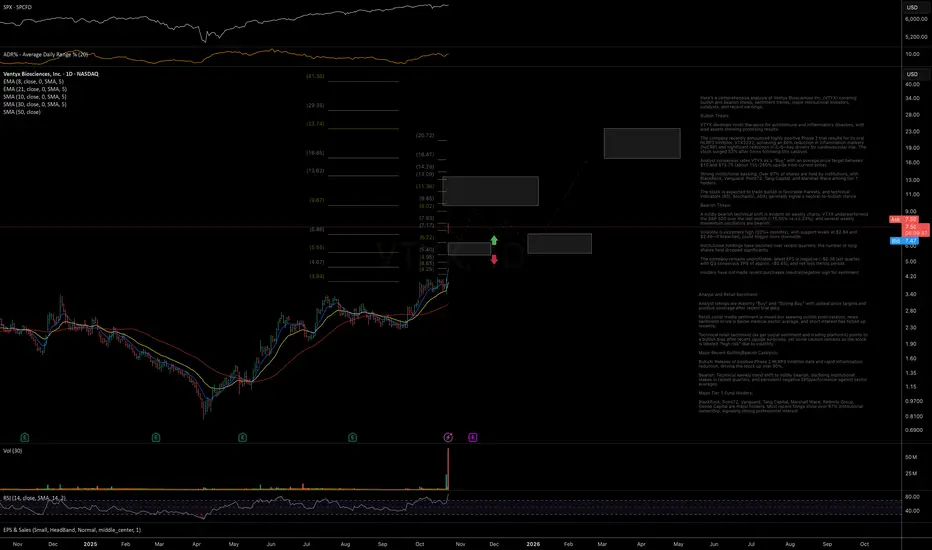
VTYX - Strong Gap-Up on Catalyst, Watching for Delayed SetupThe stock is showing a strong gap-up move on what appears to be a solid catalyst. However, given the current trading environment, which remains unfavorable for sustained breakouts, I’ll be watching for a potential delayed-reaction setup to develop over the coming days or weeks.
6.20 - 5.40 is a local support for potential pullback.
Chart:
ESPR 1W: cholesterol therapy for patients and investors alikeEsperion Therapeutics (ESPR) has broken its long descending trendline and retested the $2.4–$2.6 support area, forming a solid triple bottom with rising volume. The stock is now holding above key moving averages, signaling accumulation. While above $2.5, the technical setup points to a move toward $6.4, aligning with major resistance and the 200-week MA.
Fundamentally, the company enters one of its strongest phases in years. Following earlier liquidity struggles, Esperion has stabilized its operations and regained investor confidence. The core growth driver is Nexletol (bempedoic acid), a non-statin cholesterol-lowering therapy for patients intolerant to statins. In 2025, combined Nexletol and Nexlizet sales jumped over 45% year-on-year, surpassing $170 million for the first nine months. Recent safety data were positive, leading to new approvals across Europe and Japan - expanding partnerships and licensing revenues. Cash position strengthened via milestone payments from Daiichi Sankyo and Viatris, reducing debt and supporting R&D without new dilution. Challenges remain: profitability is still out of reach, as marketing and development expenses stay high, though liquidity provides breathing room. The broader biotech sector’s rebound amid rate-cut expectations adds tailwind to revenue-backed small caps like Esperion.
Tactically, holding above $2.5 keeps the bullish trajectory intact toward $6.4. A weekly close below $2.3 would negate the setup and re-test lower support, though current accumulation favors the upside.
Esperion helps reduce cholesterol - ironic that its chart still raises investors’ heart rate.

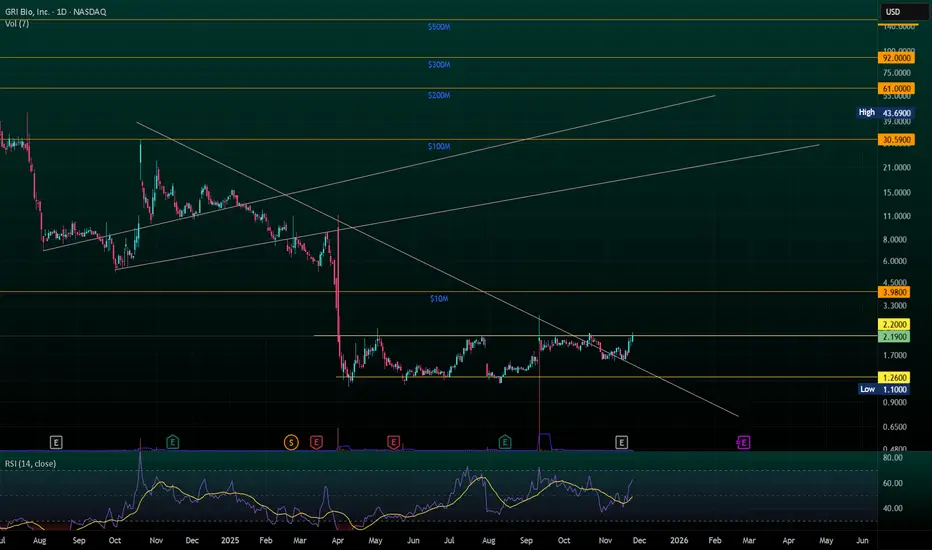
$GRI tap tap tapping $2.2 resistanceNASDAQ:GRI will release topline 12-week study data this week. All indications are that data will be positive. The price continues to test $2.2 resistance. This will be broken soon.
While all price movements are relative and unique, other companies with failed IPF trials lost ~$300M in market cap upon announcement. Others with successful trails have gained billions. GRI is worth approximately $6M today. Lots of room for upward valuation.
VKTX Viking Therapeutics Exploding Higher TodayVKTX surges higher today after pulling back again near 200-day EMA. Not sure what the news is that's driving the big move higher. The news I did find talks about the following:
1) Viking Therapeutics completed a drug clinical trial stage earlier than expected last week
2) VKTX is on lists of hot stocks to buy for 2026 and could be a takeover, acquisition target
3) VKTX is recommended by 15 Wall Street Ranked analysis who give stock 12-month consensus average price target of $92
4) VKTX is on lists of stocks with high short interest (over 20% short interest) TO BUY because they are vulnerable to getting short-squeezed
Let's talk about the 4th item above. Just imagine VKTX continues to move higher on good news about clinical trials or possibly getting acquired by a larger company. This would push the stock even higher and will force traders who have big short positions on the stock to quickly cover, creating a snowball effect that frantically drives VKTX even higher and completely surges! This is reminiscent of what happened to Game Stop (GME) a few years back. I hope that this happens because I am long on several rather large call option positions on VKTX!
Whatever you all decide to do..... Good Luck!

Breeaking: Polyrizon Ltd. ($PLRZ) Gearing for 200% SpikeThe price Polyrizon Ltd. (NASDAQ; NASDAQ:PLRZ ) experience a notable spike of over 120% in early premarket trading on Thursday breaking out of a bullish symmetrical triangle .
The share price is enroute to the $20 resistant eyeing a whooping 200% spike today. last recorded RSI was 65 further cementing NASDAQ:PLRZ bullish momentum.
In another news, Polyrizon Ltd. (Nasdaq: PLRZ) announced compelling new preclinical data showing its proprietary naloxone hydrogel adheres to nasal tissue longer than an approved and marketed intranasal naloxone spray product.
The results showed that Polyrizon’s Trap and Target ™ (T&T) hydrogel exhibited significantly higher mucoadhesion levels compared to the commercial product, supporting potentially prolonged contact at the nasal deposition site and potentially enhancing bioavailability.
About PLRZ
Polyrizon Ltd., a biotech company, engages in the development of medical device hydrogels in the form of nasal sprays in Israel. The company uses its proprietary technology to develop its products comprising Capture and Contain, a barrier against a range of allergen particulates and viruses; and Trap and Target for nasal delivery of active pharmaceutical ingredients. It also develops PL-14, a nasal allergies blocker; PL-15 for COVID-19; and PL-16 for influenza blockers.

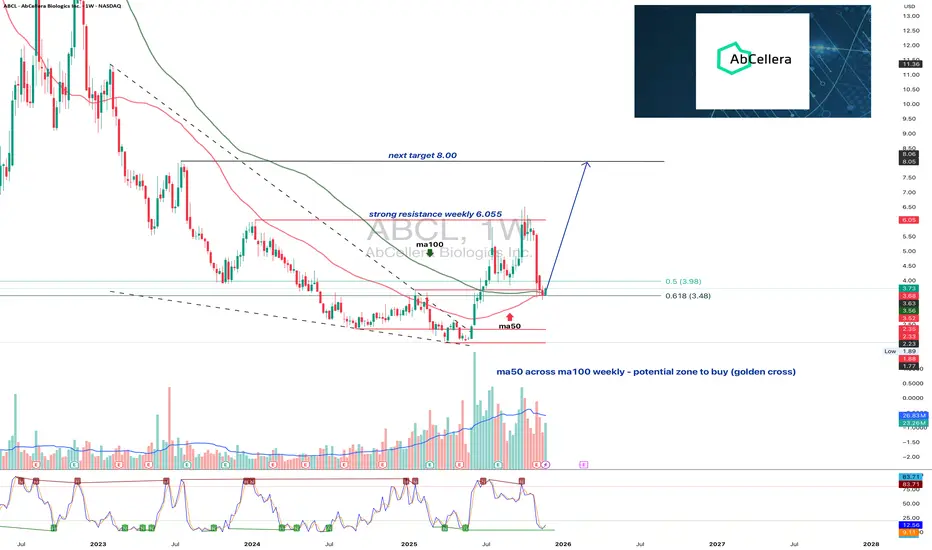
ABCL1W: turning around or just another biotech placeboABCL returns to key weekly support and prepares for the next move
ABCL has tested the strong weekly support zone between 3.48 and 3.98. This area combines Fibonacci retracement levels, a previous breakout retest and an important signal with ma50 crossing above ma100. Such a combination often forms a reliable accumulation zone. Buyers reacted immediately from this region which confirms active demand. The nearest key resistance is located near 6.05. A confident close above this level opens the path toward the next target at 8.00.
AbCellera operates in the biotechnology sector and develops advanced antibody discovery platforms for pharmaceutical partners. Revenue remains uneven due to milestone based payments. However the company maintains a strong balance sheet, significant cash reserves and a growing number of active programs. Improving sentiment in the biotech sector enhances the fundamental backdrop.
As long as price remains above the 3.48 to 3.98 area, the structure retains the signs of a forming medium term base. If this zone is lost, the market may shift into wide consolidation. The present reaction suggests that buyers are defending the level with confidence.
Support levels often speak louder than headlines. The chart usually warns long before the news arrives.
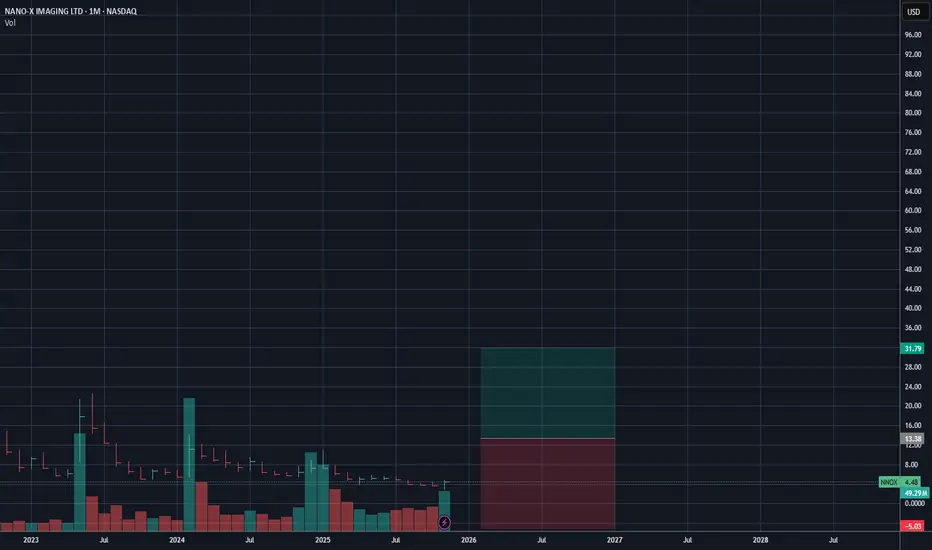
My Sentiment for $NNOX is Still LongNanox Imaging is one of those stocks I lost long term in, and kind of got attached to. However, my sentiment based on their tech and acquisitions is still long. The biggest issue is short sale volume, the need for better PR and faster project updates, the loss of their founder, and uncertainty of the future of Nanox Imaging along with the high risk in biotech. $18.41 as a target by 2027 is still feasible, however, NASDAQ:NNOX has to deliver. They have long ways to go to revamp their brand image after what happened with short sellers. As always, none of this is investment or financial advice. Please do your own due diligence and research.