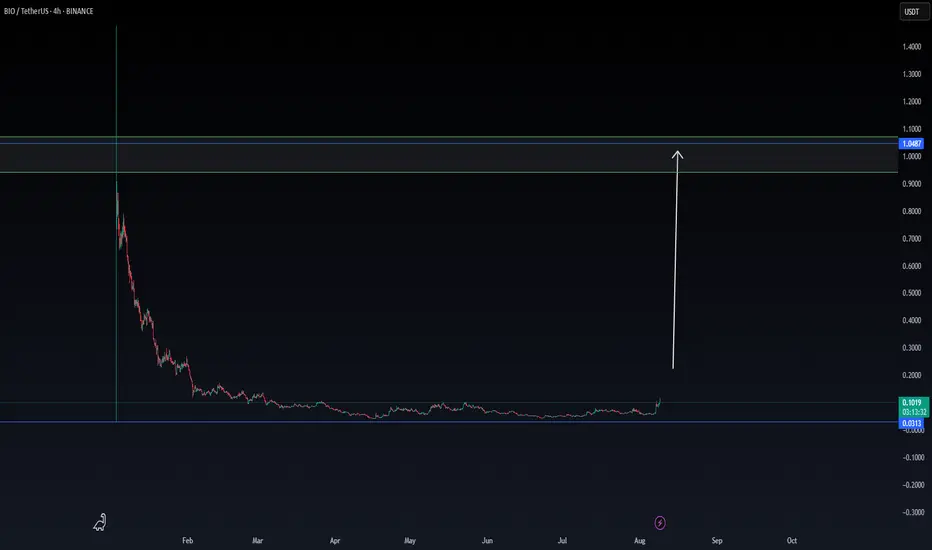
BIO is forming a Double Bottom pattern🚨📊 BIO Update
BIO is forming a Double Bottom pattern,
a bullish reversal setup 🔄📈.
If price breaks out above the red resistance zone,
the first target will be the green line level 🟩🎯.
BIOUSDT
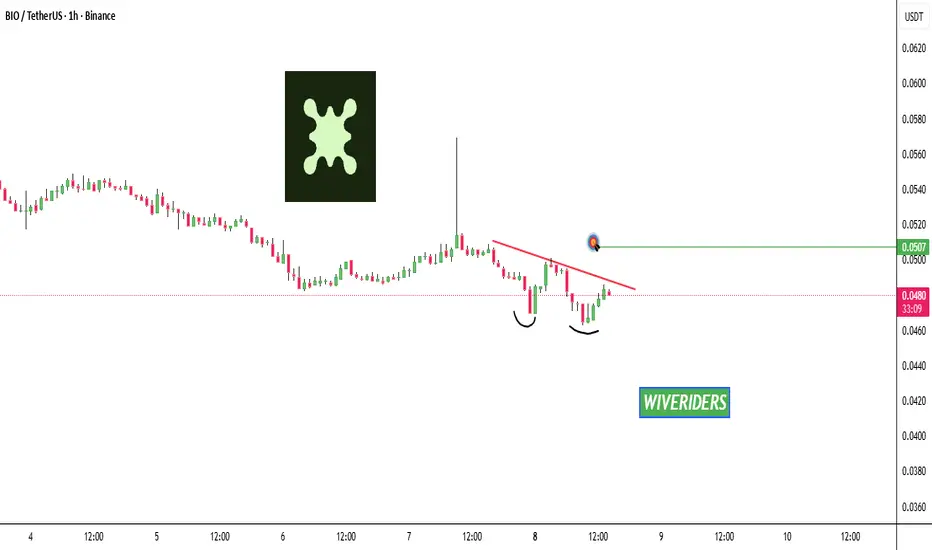
138% if...Please keep an eye on this chart and wait for it to break the blue trend line, as the support zone needs a strong bullish candle.

BIO/USDT - Long Entry | Smart Risk Management + Big Targets🚀 Trade Setup Details:
🕯 #BIO/USDT 🔼 Buy | Long 🔼
⌛️ TimeFrame: 1H
--------------------
🛡 Risk Management (Example):
🛡 Based on $10,000 Balance
🛡 Loss-Limit: 1% (Conservative)
🛡 The Signal Margin: $783.7
--------------------
☄️ En1: 0.1556 (Amount: $78.4)
☄️ En2: 0.1487 (Amount: $274.3)
☄️ En3: 0.144 (Amount: $352.67)
☄️ En4: 0.1394 (Amount: $78.4)
--------------------
☄️ If All Entries Are Activated, Then:
☄️ Average.En: 0.1465 ($783.7)
--------------------
☑️ TP1: 0.1738 (+18.63%) (RR:1.46)
☑️ TP2: 0.1888 (+28.87%) (RR:2.26)
☑️ TP3: 0.2097 (+43.14%) (RR:3.38)
☑️ TP4: 0.2397 (+63.62%) (RR:4.99)
☑️ TP5: 0.2778 (+89.62%) (RR:7.02)
☑️ TP6: Open 🔝
--------------------
❌ SL: 0.1278 (-12.76%) (-$100)
--------------------
💯 Maximum.Lev: 4X
⌛️ Trading Type: Swing Trading
‼️ Signal Risk: 🙂 Low-Risk! 🙂
--------------------
🔗 www.tradingview.com
❤️ Your Like & Comments are valuable to us ❤️

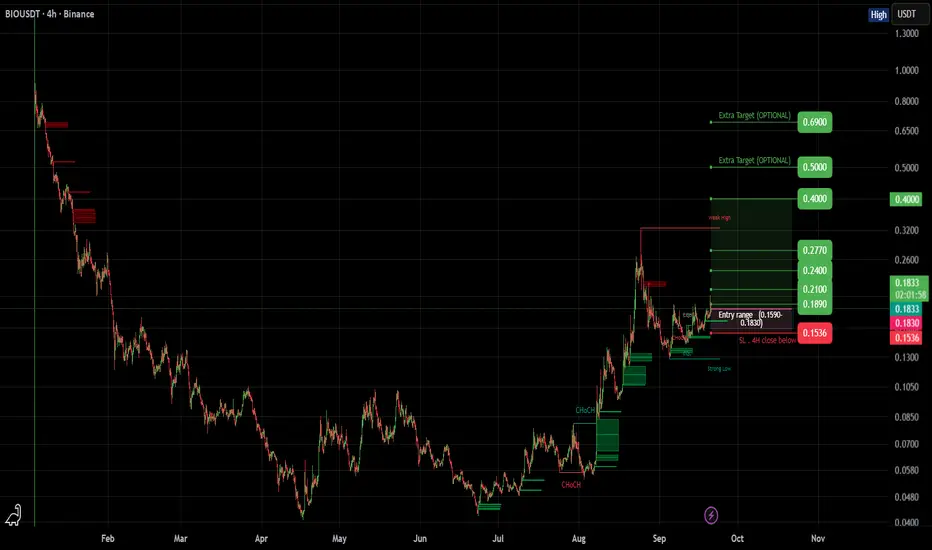
BIO (SPOT)BINANCE:BIOUSDT
Entry range (0.1590- 0.1830)
SL 4H close below 0.1536
T1 0.1890
T2 0.2100
T3 0.2400
T4 0.2770
T5 0.4000
02 Extra Target are optional 0.50 & .68
_______________________________________________________
Golden Advices.
********************
* collect the coin slowly in the entry range.
* Please calculate your losses before the entry.
* Do not enter any trade you find it not suitable for you.
* No FOMO - No Rush , it is a long journey.
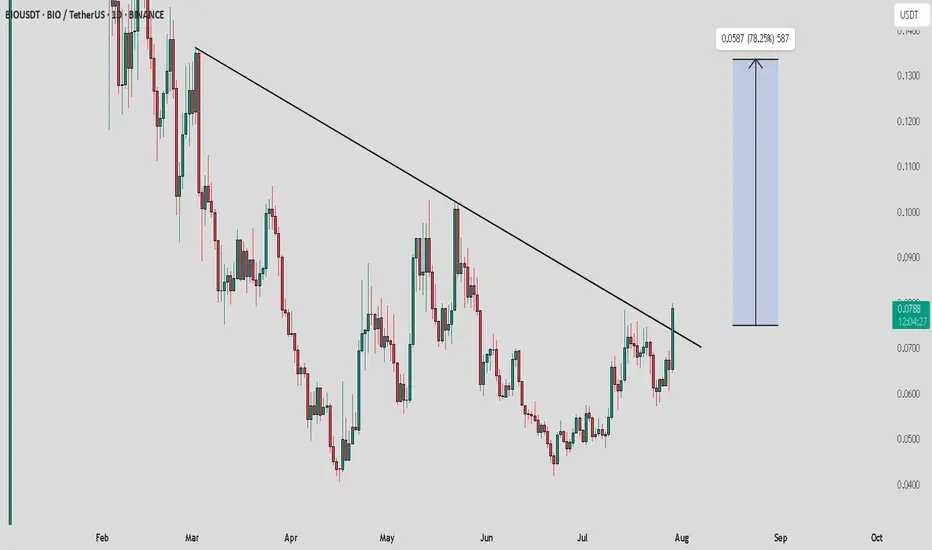
BIOUSDT Forming Bullish ContinuationBIOUSDT is currently forming a bullish continuation pattern, a strong technical indicator that suggests the prevailing uptrend is likely to resume. This setup typically occurs when price consolidates after a rally, allowing the market to gather momentum before making its next leg higher. With this structure in play, the pair is showing signs of strength and resilience, supported by increasing investor confidence.
The trading volume remains steady and healthy, signaling that market participants are actively accumulating positions. This is an encouraging sign, as higher volume often validates the potential for a breakout. Based on the current chart outlook, BIOUSDT has the potential to achieve impressive gains of 90% to 100%+ in the upcoming sessions if the continuation pattern plays out as expected.
Investor sentiment is clearly leaning bullish, with growing interest in this project adding fuel to the technical setup. The alignment of strong price action, consistent volume, and positive market interest creates an ideal environment for a significant upward move. This combination makes BIOUSDT an attractive opportunity for traders looking to capitalize on strong momentum in the crypto market.
✅ Show your support by hitting the like button and
✅ Leaving a comment below! (What is You opinion about this Coin)
Your feedback and engagement keep me inspired to share more insightful market analysis with you!
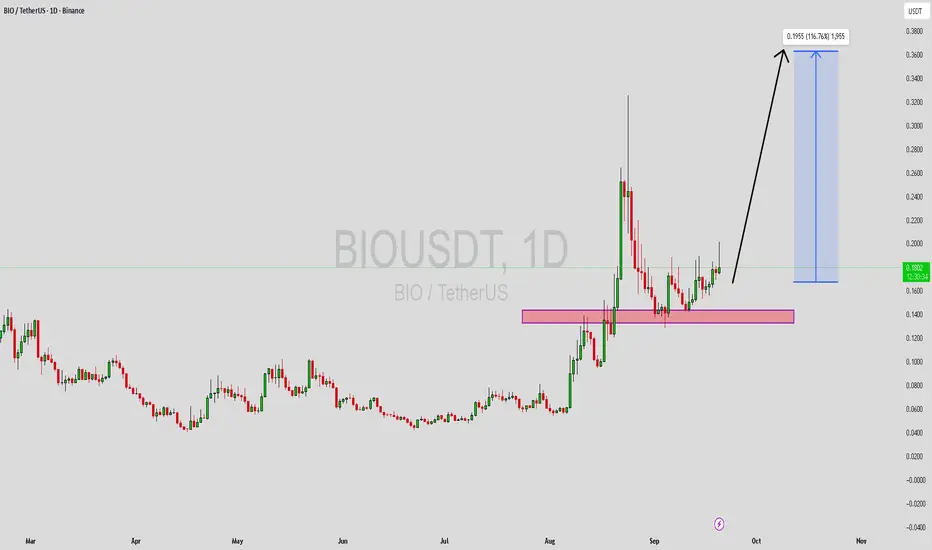
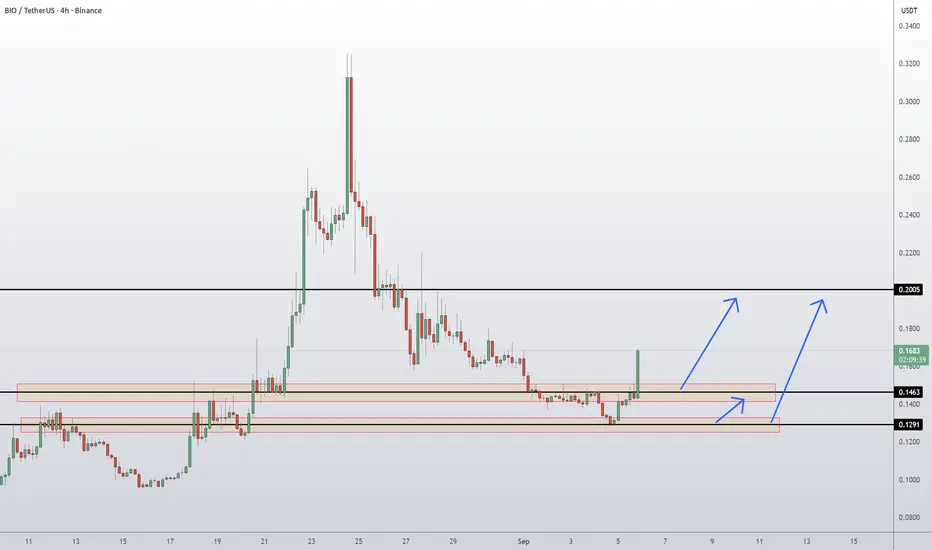
BIO Coin Bio Protocol Token- Price Prediction and Technical AnalBIO/USDT has recently bounced strongly from the 0.1291 demand zone, showing renewed bullish momentum after a prolonged decline. Price has reclaimed above the 0.1463 resistance level, which is now acting as short-term support. If this breakout sustains, the next upside objective lies at the 0.2005 resistance zone, where sellers are likely to reappear. However, if price slips back under 0.1463, a retest of the 0.1291 demand base could unfold before another attempt higher.
📈 Key Levels:
Buy trigger: Rejection bounce from 0.1463 or 0.1291 support zones
Buy zone: 0.1291 – 0.1463 region
Target: 0.2005 resistance
Invalidation: Daily close below 0.1291 (would weaken bullish structure)
👉 Follow me for More Real Time Opportunities.
Share your Thoughts if you have any?
Multiple altcoins · The 2025 bull market is onBIOUSDT:
Here we have three weeks closing green and the highest volume ever as Bitcoin retraces. No altcoin can grow this strongly if Bitcoin is now in a bear market. No altcoin would start a bullish wave if Bitcoin is entering correction mode. The only time the altcoins grow is when Bitcoin is rising or sideways within a bull market, at other times the altcoins drop. Seeing bullish altcoins confirms a bullish Bitcoin.
BTCUSDT:
Bitcoin has been red seven days, since 14-August. Is this the start of a major correction or a period of consolidation before higher? Consolidation before higher. The proof are the altcoins.
Here Bitcoin is still trading above EMA89. Last time this level worked as support.
Bitcoin can easily move sideways within a wide range, $100,000 to $120,000, and still support major bullish action across the entire market.
Bitcoin can also consolidate between $110,000 and $120,000. $112,000 is still holding as support. Above this price, Bitcoin is bullish even short-term.
ZECUSDT:
20-August is a higher low vs 7-April and then it goes bullish, a strong breakout with two full green candles. This candles are coupled with high volume, the highest since April.
The move broke EMA89 and EMA55 as resistance. MA200 was also conquered and immediately confirmed as support.
Two strong green days while Bitcoin is moving down. It reveals what is coming for Bitcoin.
HTUSDT:
HuobiToken (HT) goes up more than 280% since 20-August. The same 20-Aug. we just saw with Zcash. Is this the latest higher low date? Let's continue.
SKLUSDT:
Here we have the highest (buy) volume week ever last week as SKLUSDT broke above EMA55. This is happening after a new all-time low. Think about it.
The market bottoms and from the bottom we have the strongest buying ever and this is also coupled with the break of a long-term resistance level. We can easily say Skale Network hit bottom and is ready to grow. While Bitcoin retraces, here we have another very strong bullish breakout, this only happens within a bull market.
Toncoin:
Clearly, a long-term rising trend. TONUSDT is trading above all the short-term moving averages; EMA8/13/21 weekly, the bulls are in.
There are many pairs like this, hundreds literally.
Remember we also saw the big ones: Cardano, Chainlink, XRP, Solana and Ethereum. Look at where Binance Coin is at right now and don't forget Tron, it is all going up.
The smaller projects are yet to catch up, yet to move; the entire market is yet to grow, but here we have proof enough that shows the 2025 bull market is on.
Namaste.

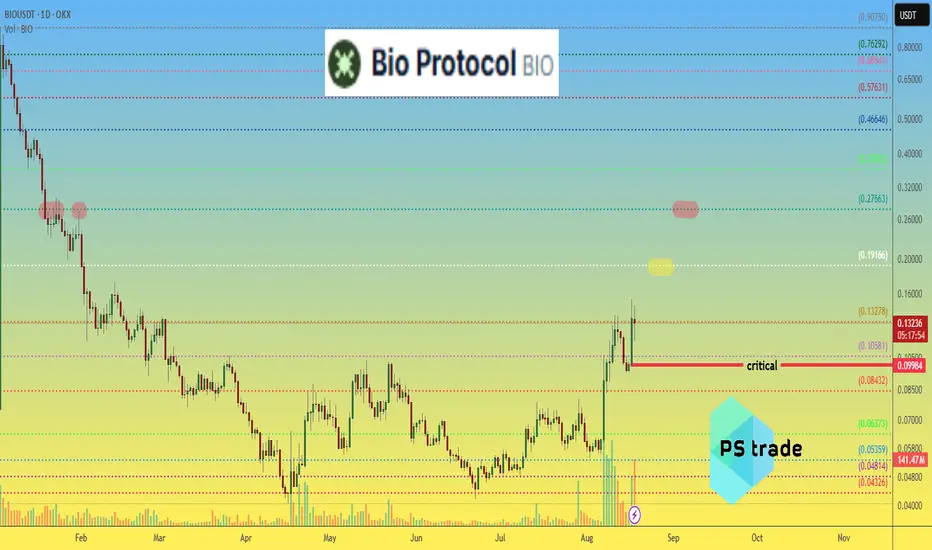
BIO protocol price analysis📉 While the market is going through a correction phase, it's worth paying attention to coins that show resilience… or even push upward 💪
💥 One of the clearest examples is $BIO. The current price action signals strength — especially in contrast to the general downtrend across the market 🔻
🗓 We first highlighted OKX:BIOUSDT back on April 17, when we noticed the first signs of increased trading volumes. But the current volumes are significantly higher 🚀
🎯 Our previously mentioned targets from April remain valid:
• Mid-term target: $0.18–0.19
• Main target: $0.27–0.30
⚠️ Key support zone: $0.10 — a breakdown below this level would invalidate the current bullish structure.
⁉️ Are you still holding your #BioProtocol tokens — either from the airdrop or from early buys at higher prices? Let us know in the comments 👇
📌 Not financial advice — just personal opinions. Always DYOR.
_______________
◆ Follow us ❤️ for daily crypto insights & updates!
🚀 Don’t miss out on important market moves
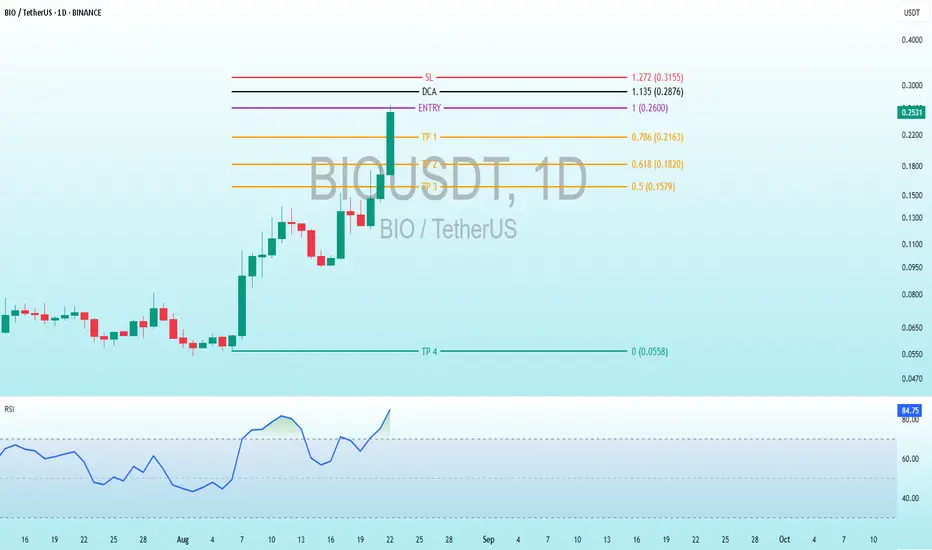
$BIO 1D Trading Explosion - Unlock Key Levels & RSI SecretsBINANCE:BIOUSDT
Key Levels (marked with lines):
SL (Stop Loss): 1.272 (0.3155 USDT) - A level to close the position at a loss.
DCA (Dollar Cost Averaging): 1.135 (0.2876 USDT) - A level for additional purchases if the price drops.
Entry (Entry Point): 1 (0.2600 - 0.2570 USDT) - The price where the position was opened.
TP1: 0.786 (0.2163 USDT) - The price where the position was opened.
TP2: (Take Profit 1): 0.618 (0.1820 USDT) - The first profit target.
TP3: 0.5 (0.1579 USDT) - The second profit target.
TP4: 0.0558 (no specific price marked, but it is a low profit level).
Price Movement:The price had a noticeable increase up to the entry level (0.786), but then experienced a sharp decline, approaching the TP levels.
The latest candlestick is green, suggesting a positive daily close, but it is still far from previous highs.
RSI Indicator (Relative Strength Index):RSI is around 85.13, indicating an overbought condition. This suggests that the price may be overextended and could see a reversal or consolidation.
Interpretation:Strategy: The chart suggests a trading strategy with an entry at 0.786, with profit targets (TP) and a stop-loss (SL) for risk management. The DCA level indicates a plan for additional purchases if the price drops.
Current Status: With a high RSI and the price near TP1, it might be time to take profits or monitor for a potential pullback.
Risk: The SL level is relatively high, suggesting tolerance for losses, but the risk increases if the price continues to drop toward DCA.
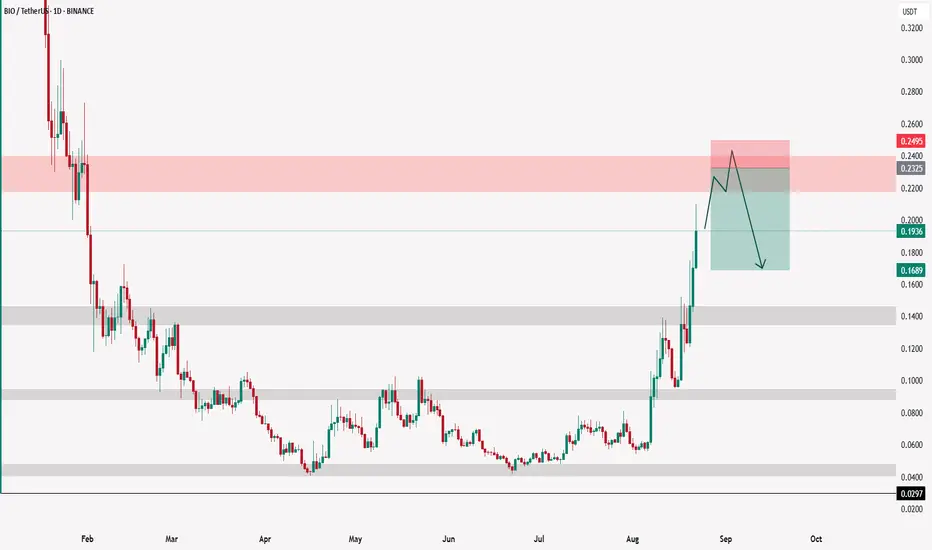
BIO CON PRICE ANALYSIS AND POSSIBLE TRADE IDEAS !!NYSE:BIO Coin Update 🎣.
• Currently NYSE:BIO Coin Price trading in overbought zone on LTF's and HTF's.
• If you get bearish confirmation right now or Until it's Price trading below 0.23$ ( Daily resistance) then you are able to execute quick short scalp on it. ( with tight SL)
• Personally if i take trade then i will update✅
Warning : That's just my analysis DYOR Before taking any action🚨🚨
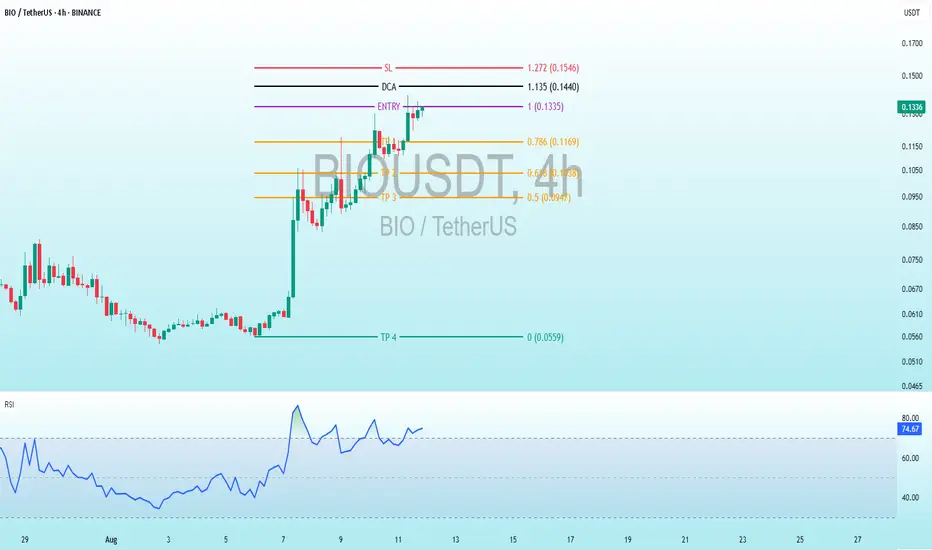
Comprehensive Technical Analysis of BIOBINANCE:BIOUSDT
Fibonacci Levels and Trading Setup
These levels appear to be Fibonacci retracement/extension levels, drawn from a low (0% at 0.0559 USD) to a high (100% at 0.1335 USD), but used for a short setup. This is unusual for an uptrend but suggests the chart creator (AltcoinPioneers) expects a decline after the pullback. Here are the detailed levels (with prices in brackets):
SL (Stop Loss, red): 1.272 (0.1546 USD) – Extension level above 100%, where the position closes if the price rises further (maximum risk).
DCA (black): 1.135 (0.1440 USD) – Possibly a level to add to the short (average down) if the price rises slightly, to lower the average cost.
ENTRY (purple): 1 (0.1335 USD) – Entry level for short (sell). The current price is very close (0.1310), so it might be active or pending.
TP1 (orange): 0.786 (0.1169 USD) – First Take Profit, a retracement level.
TP2 (orange): 0.614 (0.1038 USD) – Second TP, near the golden ratio (0.618).
TP3 (orange): 0.5 (0.0947 USD) – Third TP, half of the range.
TP4 (green?): 0 (0.0559 USD) – Final TP, at the previous low.
RSI Indicator Analysis
Current Value: Around 70-73, with the blue line peaking at ~80 and now slightly declining.
RSI Trend: Started from ~30 (oversold) during the price decline, rose sharply with the upward impulse (indicating bullish momentum), but is now in the overbought zone (>70). This signals the asset might be "overpriced" in the short term, and a correction downward is possible (bearish divergence if the price doesn’t confirm upward movement).
Interpretation: An RSI above 70 often precedes a pullback or bearish reversal, especially on a 4h timeframe. If it falls below 50, it confirms weakness.
BIO THE next hype coin that can return up $1There is a high chance BIO is going to return up $1
We will follow to see if this is going, depending Data
The coin is now moving between $0,09 and $0,10
Data shows that this coin has the volume power to break back to $1 , next targets could be $0,25 and $0,43
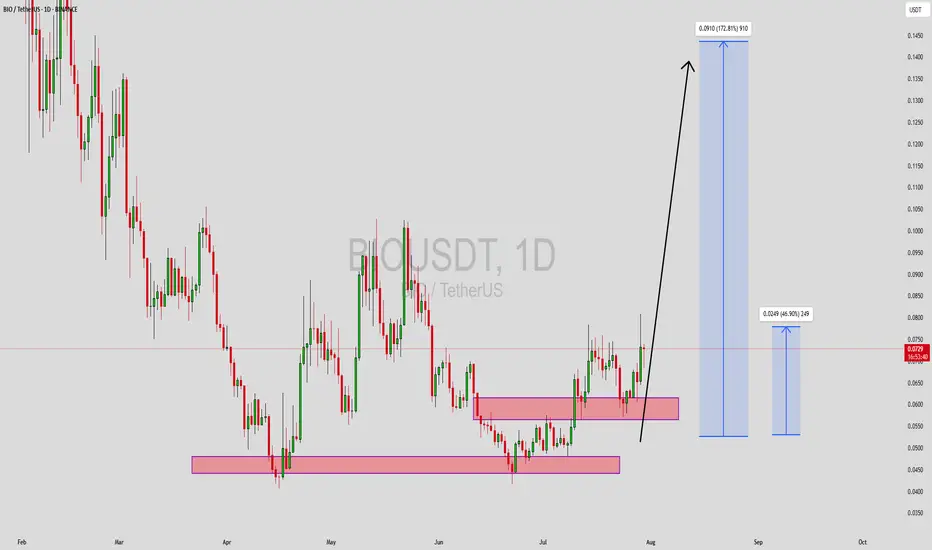
BIOUSDT Forming Strong PotentialBIOUSDT is currently presenting a highly promising technical structure, suggesting a strong potential upside. The chart shows the price has recently bounced from a key support zone and has started forming higher lows—an early signal of bullish accumulation. With multiple support blocks holding firm and upward price projection arrows indicating potential targets, the setup leans toward a breakout continuation. The volume pattern also confirms healthy market activity, which reinforces the strength of this possible trend reversal.
The price action seems to be coiling just beneath resistance, which typically precedes an impulsive breakout move. Based on the chart’s structure and market dynamics, there is a clear path for a substantial price rally. The projected targets indicate a potential gain of 140% to 150%, making BIOUSDT a high-potential candidate for short- to mid-term traders. The confluence of horizontal support zones and higher timeframe trend signals suggest that momentum may continue to build in the coming sessions.
What sets BIOUSDT apart right now is the growing investor interest around the project. Whether driven by ecosystem developments or speculative momentum, the increased volume and social buzz are helping sustain price levels and set the stage for a bullish continuation. A confirmed breakout above the recent consolidation could lead to rapid gains, especially if broader market conditions remain favorable.
Traders should keep an eye on a daily close above the marked resistance region with increased volume as a confirmation signal. Given the sharp projected upside and the clear technical roadmap laid out on the chart, BIOUSDT remains a compelling opportunity for those monitoring altcoins with breakout potential.
✅ Show your support by hitting the like button and
✅ Leaving a comment below! (What is You opinion about this Coin)
Your feedback and engagement keep me inspired to share more insightful market analysis with you!
BIO / USDT : Breaking out with strong potentialBIO/USDT breaking resistance with Strong potential
Bullish Scenario: If the price maintains momentum above key support, expect a continued move towards $0.15.
Bearish Scenario: A failure to hold above support could lead to a pullback to lower levels.
Pro Tip: Enter on confirmation of support hold or breakout above $0.075. Set tight stop loss to manage risk.
$BIOUSDT Trade Setup UpdateNYSE:BIO has successfully flipped resistance into support and is now consolidating above the trendline, showing strength at every retest.
- Breakout from downtrend resistance
- Holding the rising support trendline
- Buyers stepping in near the $0.074 zone (green box)
- Risk-reward is still favorable if you're looking for continuation
Targets ahead:
• $0.102
• $0.123
• $0.149
As long as the trendline holds, the structure remains bullish. Keep SL tight below the green zone and trail as the price climbs.

BIO Protocol price analysis⁉️ Someone reminded MM - #BioProtocol that after the listing it would be nice to maintain the price, and ideally to pump a little, finally woke up)
We think that many people have #BIO in their portfolios under the name: “let it lie there, maybe it will grow someday” :)
So, we keep our fingers crossed for growth.
🟢 It will be difficult for OKX:BIOUSDT to go up the range of $0.08-0.16, as longs were collected there and some of them will definitely want to go out “to zero”.
🔴 But if and when MM gets to the shorts and “forces” them to cover, then growth can accelerate significantly.
In general, I would like to see the price of #BIO at least $0.28-0.30 and with a project capitalization of about $500 million.
_____________________
Did you like our analysis? Leave a comment, like, and follow to get more

BIO after listing, zones of interestPretty simple idea for BINANCE:BIOUSDT after listing
Always work with IAP model (shared in my ideas for free)
2 main zones of interest marked on a chart! 12h tf.
Invalidation of idea if token drop under listing price!
Zone of fixation local swing trade on a spot marked red block
Hope you enjoyed the content I created! You can support this idea with your likes and comments so more people can see it.
✅ Disclaimer: Please be aware of the risks involved in trading. This idea was made for educational purposes only, not for financial investment purposes.
Check out my ideas about interesting altcoins in the related section below ↓
For more ideas, please hit "Like" and "Follow"!

BIO COIN NEXT POSSIBLE MOVES AND TRADE SETUPS !!NYSE:BIO Coin Updates & Next Possible Moves!!
• From Last 4 days price consolidating now i a range... Now if CRYPTOCAP:BTC get little bit stable too then i am expecting now minimum 30% bounce back in its price.
- High Risk Coin Without Stoploss Don't Build trade on it🚨
Warning : That's just my analysis DYOR Before Taking Any Action🫡.

BIO Protocol - 1st TV AnalysisBio protocol just launched, in my view it has a strong fundamental, the price can go as up to $3.
Currently, 0.66 temporary short term support. Cheers
