BITCOIN Free Signal! Sell!
Hello,Traders!
BITCOIN Smart Money shows reaction from a key supply zone where liquidity was engineered above equal highs. Price is likely to deliver downside targeting sell-side liquidity.
---------------------
Stop Loss: 104,822$
Take Profit: 102,778$
Entry Level: 103,763$
Time Frame: 2H
---------------------
Sell!
Comment and subscribe to help us grow!
Check out other forecasts below too!
Disclosure: I am part of Trade Nation's Influencer program and receive a monthly fee for using their TradingView charts in my analysis.
Bitcoin-btcusd-btc

Bitcoin – Technical Outlook
🔹 Key Zone: 101,500 – 104,500
At the moment, price is trading within this key zone where strong buying and selling activity is taking place — a critical area that will likely determine the next major move.
🟢 Bullish Scenario (Uptrend)
If price breaks above and holds above 104,500, this would confirm a continuation of bullish momentum.
In that case, price is expected to move higher toward 120,040, with further potential extension toward 125,567.
📈 This zone is an important confirmation area that could signal the beginning of a new bullish leg.
🔴 Bearish Scenario (Downtrend)
However, if price drops below and stabilizes under 101,500, this would indicate a potential bearish reversal.
In that case, the price may move downward toward the support zone at 97,700 – 93,400.
Breaking below this area would confirm further bearish extension toward 88,080.
📊 Summary:
Currently, Bitcoin is trading inside the key zone (101,500–104,500).
A breakout above or below this range will likely define the next strong market direction — whether a bullish continuation or a deeper bearish correction.

BITCOIN Correction Ahead! Buy!
Hello,Traders!
BITCOIN fell down sharply today, but the price is now hitting the horizontal demand level and we are already seeing some early rejection signs, so as the coin is oversold, a local bullish correction is to be expected. Time Frame 12H.
Buy!
Comment and subscribe to help us grow!
Check out other forecasts below too!
Disclosure: I am part of Trade Nation's Influencer program and receive a monthly fee for using their TradingView charts in my analysis.

BITCOIN and stocks, 2021 vs 2025...Bitcoin (BTCUSD) could be entering a new Bear Cycle and as we've mentioned a few times recently, the 1W MA50 (blue trend-line) will play a big part at deciding that. This is basically the level that BTC is testing right now.
What may seem surprising to some, is that while Bitcoin has been correcting, the stock market (S&P500 illustrated by the black trend-line) has been rising making All Time High (ATH) after All Time High. This is not uncommon towards the end of Bull Cycles and has been particularly relevant during the Top of the previous (2021) Cycle.
As you can see, Bitcoin topped 7 weeks before stocks did, as we witnessed heavy profit taking and rotation of those (extraordinary) crypto gains towards stocks. Even the 1W RSI Lower Highs structure is similar between 2021 and 2025. The 4-year Cycle Theory in full confirmation (so far).
If the pattern plays out the exact same way time-wise as in 2021 (often it doesn't), we should be expecting stocks to top around the week of November 24. As for Bitcoin's trend after, following the 2022 blueprint wouldn't be unreasonable at all, as a 1W candle closing below the 1W MA50 would open the way to a 1W MA100 (green trend-line) test, multiple months of ranged price action between the two and then violent crash towards the 1M MA100 (red trend-line).
So do you think Bitcoin has topped and if yes, are stocks about to follow soon? Feel free to let us know in the comments section below!
-------------------------------------------------------------------------------
** Please LIKE 👍, FOLLOW ✅, SHARE 🙌 and COMMENT ✍ if you enjoy this idea! Also share your ideas and charts in the comments section below! This is best way to keep it relevant, support us, keep the content here free and allow the idea to reach as many people as possible. **
-------------------------------------------------------------------------------
💸💸💸💸💸💸
👇 👇 👇 👇 👇 👇

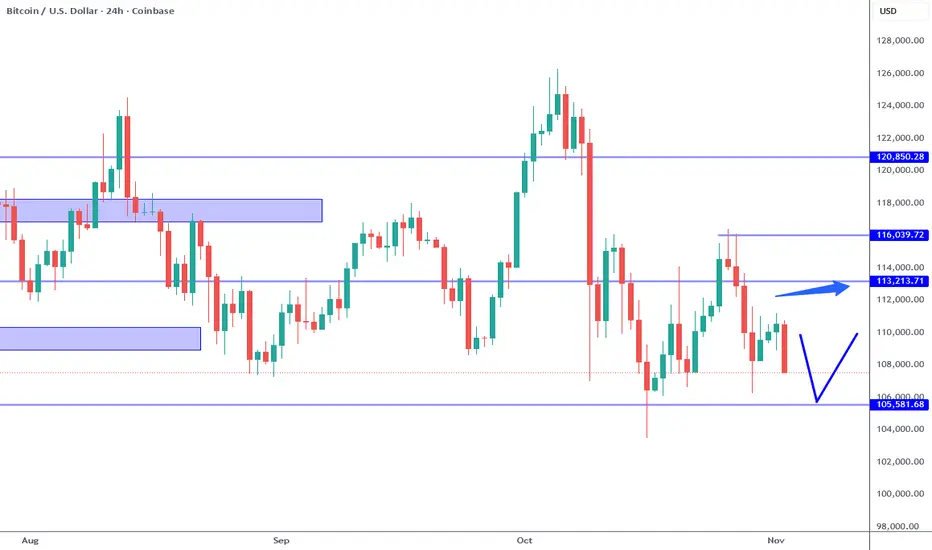
Bitcoin: Watch 105K For Bullish Reversal Again.Bitcoin all over the map. Pay attention to the nearest support and resistance levels which are 113K resistance and 105K support. 109K a minor support has been broken again. There is no way to know which way this market will break on the short term. The general trend is still bullish, BUT resistance levels like 113K and 118K AREA have yet to break.
Smaller time frame momentum is arguably bearish which is good for day trade strategies, otherwise there is not much to do on the swing trade time frame at current prices. A test of the 105K support is likely to follow this week, which can present an attractive swing trade long opportunity (upon confirmation). IF 105K breaks, the next area to watch is the 103L to 100K area for a bullish reversal. This location is also a major psychological level which is also attractive for investing.
Also worth mentioning, there is a head and shoulders formation on this chart, and while it implies bearish possibilities, I would put more emphasis on the levels because these patterns can easily appear randomly. Support and resistance levels, which can also be random, are more relevant in my opinion because of previous trader/investor behavior (or being stuck in a position). Either way do not jump to conclusions or grasp at the obvious. Notate levels, then wait for price to react there and provide a way to measure risk.
Another important note is the CHANGE in Chairman Powell's rate cutting intent during the FOMC press conference over the previous week. When asked about the December rate decision, he explained that is was NOT a sure thing. Based on previous comments and hints, the market seemed to have priced in a December rate cut. Since this comment, the market has cooled off a bit from the constant new all time high every day party. Just goes to show, all it takes is a just few unexpected words to change sentiment. There is NO way to see something like this coming on a chart.
This along with the lack of government data can invite unexpected surprises bullish or bearish. This is why in a game of incomplete information, it is best to focus on RISK, not obsess over forecasts.
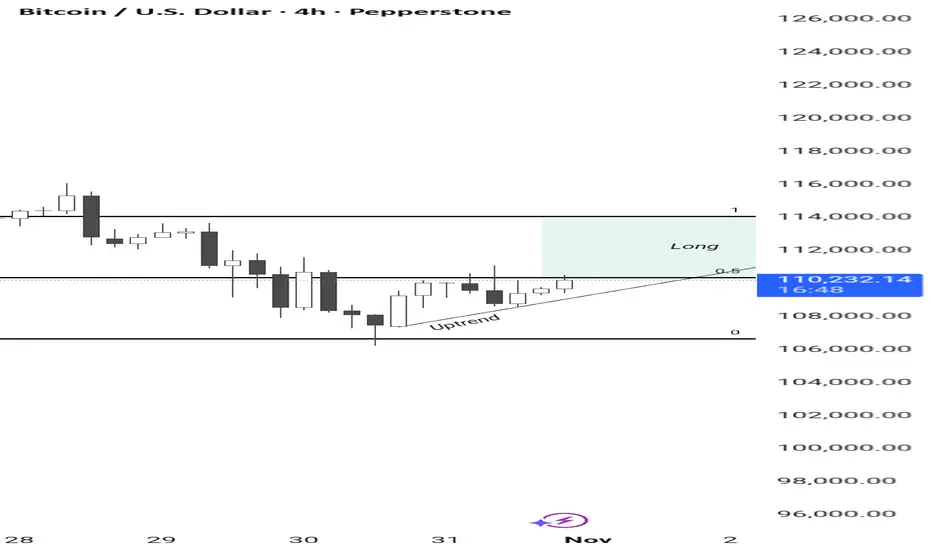
Bitcoin Bitcoin rejected the price at the support level of 107000, now in an uptrend at the 0.5 Fibonacci level, favoring a continuation of the long movement to the resistance at 114000.
BITCOIN Has this huge Bearish Divergence started the Bear Cycle?Bitcoin (BTCUSD) continues to be under heavy pressure in the past 4 weeks since the October 06 All Time High (ATH) and finds itself battling to hold the 1W MA50 (blue trend-line) as Support. That trend-line has been basically the Support of this Bull Cycle since March 2023, and acted as the most optimal long-term buy level.
** Has the Bull Cycle ended? **
However this Bull Cycle may have very well come to an end already as the 1W RSI has been long exhibiting the same kind of bearish pattern (Lower Highs trend-line), while also having completed the 4-year Cycle, that all previous Bull Cycles formed on their respective tops. This is a huge Bearish Divergence formation as it goes against the price's Higher Highs, indicating trend exhaustion.
As you can see that 1 RSI Lower Highs trend-line formed the November 2021, December 2017 and December 2013 Cycle Tops. Even worse, the current Lower Highs trend-line has been going on since the March 11 2024 High. If BTC closes a 1W candle below its 1W MA50, it has greater probabilities to confirm the start of the new Bear Cycle as all previous ones did on such break-out.
** If yes, how much can it drop? **
Now, it might not be too relevant at this time yet, but as far as how low the Bear Cycle can go to before it bottoms, there are three potential levels of interest where long-term investors can Dollar Cost Average (DCA).
The January 2015 Bear Cycle bottom was formed on the 1W MA200 (orange trend-line). Then the December 2018 Bear Cycle bottom was formed on the 1W MA200 and the 0.382 Fibonacci retracement level from the previous bottom. The last Bear Cycle has its bottom below the 1W MA200 and on the next Fib in line, the 0.5 level. The decline on each Bear Cycle that followed decelerated and was less than the previous (-86.70% to -84.19% to -77.22%).
If the new Bear Cycle has already started then the first level for a potential bottom is again the 0.382 Fib around $58000 where contact may potentially be made with the 1W MA200 as well. If it follows the previous Bear Cycle and bottoms on the 0.5 Fib, it will also be below the 1W MA200 around $45000. If on the other hand it goes a Fib level further, as the last two Cycles did, we are looking at the 0.618 Fib as a potential strong bottom candidate around $35000. That will also be a -70.76% decline from the Top, which will be -7% less than the previous Bear Cycle, which is also the difference that the 2022 Bear Cycle had from the 2018 one.
So what do you think? Has the Bull Cycle ended already and if yes, how low can the new Bear Cycle go? Feel free to let us know in the comments section below!
-------------------------------------------------------------------------------
** Please LIKE 👍, FOLLOW ✅, SHARE 🙌 and COMMENT ✍ if you enjoy this idea! Also share your ideas and charts in the comments section below! This is best way to keep it relevant, support us, keep the content here free and allow the idea to reach as many people as possible. **
-------------------------------------------------------------------------------
💸💸💸💸💸💸
👇 👇 👇 👇 👇 👇

BITCOIN CLEAR REJECTION|SHORT|
✅BTCUSD made a liquidity grab above the previous high, price sharply rejected from the 4H supply area, confirming a fakeout and shift in order flow. The market structure suggests redistribution, with inefficiency below acting as the draw on liquidity. Expect short-term delivery toward $114,000. Time Frame 4H.
SHORT🔥
✅Like and subscribe to never miss a new idea!✅

The Clearance Theory Dear Followers
As an analyst I always watch the market and take a notes
I would like to share one of my theorys today
I did notice this pattern did happen before throw the last few years
I call it the The clearance
it did happen before when the market was about to move strongly toward a new direction
and for making sure it will face a weak resistance the market will try to fulfill most of the pending orders before his final move
it takes the pending orders and dumb it till all the major orders fulfilled, Then >>>>>>>>
Good luck everyone

BITCOIN and the 'myth' behind following the Global SupplyA lot of talk is being thrown around lately regarding the M2 Global Supply (black trend-line) and how Bitcoin (BTCUSD) will follow it upwards as it explodes. Those claims have intensified especially in the past 2 weeks as an argument to support BTC's recovery following the decline from its $126k Top.
However, history shows that the two don't have to be correlated. In fact, during the past two Cycles, BTC topped at least 105 days (15 weeks) before the Global M2 did. Especially during the previous Cycle (2021), BTC has broken well below its 1W MA50 (blue trend-line) and stayed under up until the M2 peaked also. Note that the 1W MA50 is what has (so far) supported BTC's current correction.
As a result, no hopes of recovery can be rest upon a currently rising Global Liquidity. And if BTC's Cycle Top was 2 weeks ago, the Global Liquidity might peak 15 weeks from that, around January 19 2026 (possibly around the time the stock market peaks too).
But what do you think? Do you think Bitcoin will catch up to the rising M2 Global Supply or will continue its decline into a new Bear Cycle as it has historically happened? Feel free to let us know in the comments section below!
-------------------------------------------------------------------------------
** Please LIKE 👍, FOLLOW ✅, SHARE 🙌 and COMMENT ✍ if you enjoy this idea! Also share your ideas and charts in the comments section below! This is best way to keep it relevant, support us, keep the content here free and allow the idea to reach as many people as possible. **
-------------------------------------------------------------------------------
💸💸💸💸💸💸
👇 👇 👇 👇 👇 👇

Bitcoin Analysis.I still believe that the markets are still down trending. We will see how prices react to the discount imbalances to see if we get a reaction from the weekly third trend line touch.

BITCOIN The NIGHTMARE chart you don't want to see right nowBitcoin (BTCUSD) is on the verge of establishing an LMACD Bearish Cross on the 1M time-frame, which for better reliability needs to close the current 1M candle (October) to confirm it.
** The nightmare LMACD Bearish Cross **
As the title says, this is a 'nightmare' development for the market, certainly not something that the majority of investors want to see right now, as this Bearish Cross has had disastrous effects every time it took place at the end of the 4-year Cycle.
First of all, let's not allow being overlooked the fact that the 1M LMACD is also reversing right before a test of its multi-year Lower Highs trend-line. That line priced all previous Cycle Tops.
** Is this a Cycle Top? Best-worst case scenarios**
Back to he Bearish Cross, it has always been formed around Cycle Tops as well. More specifically, the one that was formed after January 2014, was already on the 3rd month after the Cycle Top. The one that was formed after February 2018, was on the 4th month of the Bear Cycle. More recently, the one that was formed on August 2021 was 3 months before the Cycle Top. Interestingly enough, that was a peculiar Cycle with an (almost) Double Top, which was no surprise that the LMACD got rejected on its Lower Highs trend-line much earlier on the April 2021 Top.
As a result, the best case scenario based on this model for BTC is to have another 3 months of Bull, especially if it gets aided by favorable news (Trade deal, rate cuts, adoption). The more likely however historically, especially if October closes in red in 10 days, is that Bitcoin has entered a new Bear Cycle and this MACD Bearish Cross comes to confirm it.
** How low can it go?? **
What's even worse is that, if we've already seen the Top, the market tends to decline on average by more than -80% historically, with the last Bear Cycle suffering losses of almost -78% (the softest Cycle of all). It was also the only one that closed a month (numerous 1M candles actually) below the 1M MA50 (blue trend-line) unlike the first two, which used that as a Support/ Cycle Bottom. As a result, the best case scenario if a new Bear Cycle has already started is to place a bottom on its 1M MA50 around $60000 - 65000 and the worst to decline by -78% around $30000 (or a little worse).
Again, not the kind of technical analysis most want to be seeing right now..
** The positive look **
For conclusion, we should always keep in mind that the fundamental scenery/ environment changes with every Cycle in a more favorable way, e.g this Cycle we had much stronger institutional adoption, even national treasuries and more importantly we saw the introduction of the Bitcoin ETF by Blackrock which was a game changer in capital inflows. You don't see often such investment bank giants 'allowing' one of their products to tank by -80%.
But what do you think? Are we already in a Bear Cycle or there are some more months left in the Bull's tank? Feel free to let us know in the comments section below!
-------------------------------------------------------------------------------
** Please LIKE 👍, FOLLOW ✅, SHARE 🙌 and COMMENT ✍ if you enjoy this idea! Also share your ideas and charts in the comments section below! This is best way to keep it relevant, support us, keep the content here free and allow the idea to reach as many people as possible. **
-------------------------------------------------------------------------------
💸💸💸💸💸💸
👇 👇 👇 👇 👇 👇

BITCOIN Did the 1W MA50 save the Cycle again??Bitcoin (BTCUSD) has now completed two straight weeks since the Friday 10 flash-crash of almost touching the 1W MA50 (blue trend-line) but managing to hold it and rebound. This is not the first time we see this pattern during this Cycle. In fact it is a frequent one that systemically fuels the 3-year Channel Up of this Bull Cycle.
As you can see, ever since the November 21 2022 bottom of the previous Bear Cycle, the current Bull Cycle has been trading within this Channel Up pattern, which after it broke above the 1W MA50 and in March 2023, turned it into its long-term Support.
More specifically, since that day, every time BTC broke and closed a weekly candle below its 1W MA20 (red trend-line), it dropped further to its 1W MA50 to find Support, priced the Channel Up Higher Low and rebounded.
This has happened so far 3 times (excluding now), in September 2023 it almost touched the 1W MA50 and rebounded but in August 05 2024 and April 07 2025, it marginally breached it and then rebounded. Based on this, BTC is currently at or very close to the new Higher Low (Support), hence a buy opportunity.
The only condition that hasn't been fulfilled, is the 1W RSI entering its 2-year Support Zone. If the 1W MA50 indeed holds and manages to keep closing the 1W candles above it, that would be an indication that the Bull Cycle is still in effect. The minimum rally a pull-back has given throughout the Cycle has been +92.44%, so as long as it holds, there are strong probabilities that BTC may reach a least $143000.
Do you share that model's optimism or you think the new Bear Cycle has already started? Feel free to let us know in the comments section below!
-------------------------------------------------------------------------------
** Please LIKE 👍, FOLLOW ✅, SHARE 🙌 and COMMENT ✍ if you enjoy this idea! Also share your ideas and charts in the comments section below! This is best way to keep it relevant, support us, keep the content here free and allow the idea to reach as many people as possible. **
-------------------------------------------------------------------------------
💸💸💸💸💸💸
👇 👇 👇 👇 👇 👇

Bitcoin: Range Low Buying Opportunity?Bitcoin has tested the range low below the 105K area. This is an attractive location for new longs IF there is a reversal confirmation (which does not exist right now). It is also possible that a new trend structure is developing (Broad Wave 2) but it is too early to tell. On the smaller time frames, the 109K area is a minor resistance and an area to watch for a potential lower high, while the 113K mid point can now act as a major resistance area. IF either of this resistances stick and confirm, this could be signs of a broader bearish scenario that can see prices back in the 80K area.
Until 103K to 100K area is cleared, it can still be argued Bitcoin is consolidating and price is testing the range low. Just like the 76K swing low, this area may also be such a opportunity UNLESS it breaks. Macro economic fundamentals support the Bitcoin bull argument in terms of where the FED is taking interest rates and plans to "expand" their balance sheet (QE). We still how all of this is affecting gold and silver, and should provide a similar support for Bitcoin. This market has its own variables to contend with, but generally speaking, the coming economic environment (INFLATION) should have a positive effect.
Fundamentals like FED actions carry a lot of weight and must be considered in light of technical events on the chart. This means if Bitcoin breaks support, while other factors can drive it to lower support levels, the PROBABILITY of that is likely to be lower. Use the technical levels as points of reference and observe the price action around these levels. For example, IF an inside bar appears at the completion of the current candle and the high of that candle is broken, that can be interpreted as a buy signal off of a bullish range low. How you mange the risk in this situation is your responsibility.
Forecasting Bitcoin or any market, especially over long time horizons is not practical. Markets trend, BUT environments CHANGE upon the perception of NEW information. Most participants are limited to public information, and with that the only way to navigate the uncertainty is by being good at assessing and managing risk. Charts are just a way to help visualize what that means.
Thank you for considering my analysis and perspective.

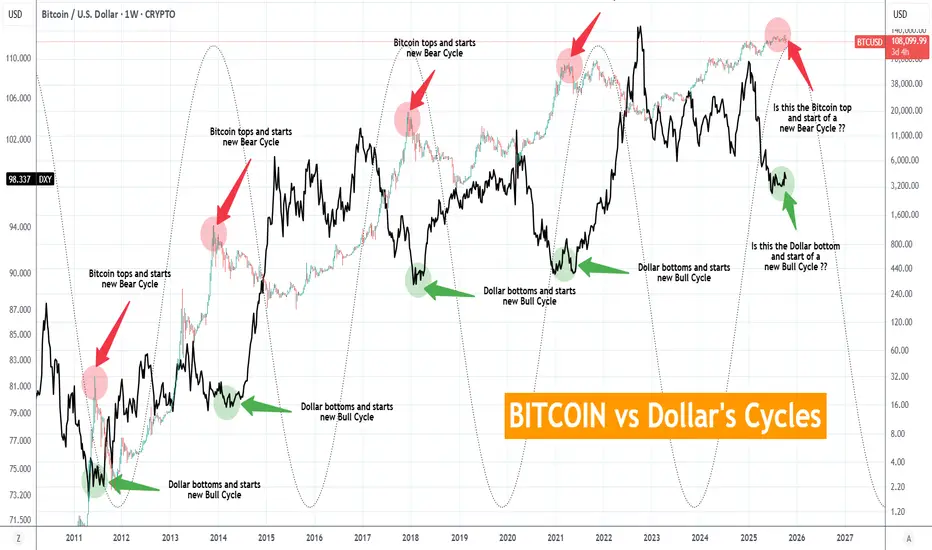
BITCOIN vs Dollar's Cycles. Has the new BTC Bear Cycle started?This is as simple as it can get. And obviously, it is not the first time we give you this chart. This is a cross-asset comparison between Bitcoin (BTCUSD) and the U.S. Dollar Index (DXY) illustrated by the black trend-line. It represents the Cycles of the two assets, typically negatively correlated across the span of 15 years.
As you can see, when the USD bottoms and starts a new Bull Cycle, BTC tops and starts a new Bear Cycle. Similarly vice versa with USD's Bull Cycle tops against BTC's Bear Cycle bottoms.
So the million dollar question is whether the USD has bottomed again. Based on the 4-year Cycle Model and as the Sine Waves illustrate on this chart, it may have. It is no surprise that while the DXY has formed Higher Lows since July 07, BTC has topped and turned sideways on ranged trading with a new Low made on last Friday's crash.
It is not necessary for the USD to break upwards aggressively in order for BTC to start dropping aggressively into its new Bear Cycle. As Jan - March 2018, Jan - March 2013 and May - August 2011 have shown, the USD may range sideways, as long as it is a clear sign of bottom formation, while Bitcoin is already into its Bear Cycle.
So the conclusion is that as long as the USD keeps trading sideways without making a new Low, it is quite like for Bitcoin to be entering its new Bear Cycle. Sound planning, calculated profit taking and gradual (to say the least) de-risking may be required.
So do you think Bitcoin's new Bear Cycle has started? Feel free to let us know in the comments section below!
-------------------------------------------------------------------------------
** Please LIKE 👍, FOLLOW ✅, SHARE 🙌 and COMMENT ✍ if you enjoy this idea! Also share your ideas and charts in the comments section below! This is best way to keep it relevant, support us, keep the content here free and allow the idea to reach as many people as possible. **
-------------------------------------------------------------------------------
💸💸💸💸💸💸
👇 👇 👇 👇 👇 👇
Still believe in a short position on bitcoin
Yes, stopped out
But I insist on the direction of my position in the comming days.

BITCOIN Risky Short! Sell!
Hello,Traders!
BITCOIN is reacting from a horizontal supply area after a strong impulsive move down. Smart Money may engineer a retracement before continuing to target 111,300$ liquidity. Time Frame 2H.
Sell!
Comment and subscribe to help us grow!
Check out other forecasts below too!
Disclosure: I am part of Trade Nation's Influencer program and receive a monthly fee for using their TradingView charts in my analysis.

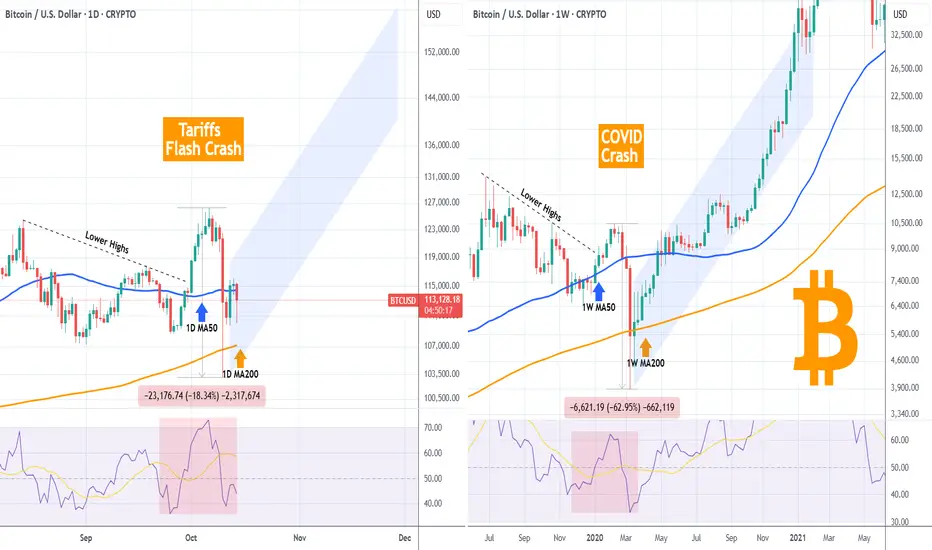
BITCOIN Is last Friday's flash crash similar to COVID's?Bitcoin (BTCUSD) made a strong flash crash last Friday following President Trump's tariff threats to China. That brought back memories of the March 2020 COVID crash. But are those that similar??
Quick answer: strength/ aggression wise no. Last Friday's crash marked 'just' a -18.34% decline from its top on a week basis. COVID's crash, which was longer admittedly, pulled the price down by -62.95% from February's 2020 High. Massive difference in market psychology and dynamics (even though we may have not seen the last of the current Tariff Crash). And that is the reason one chart is on the 1D time-frame and the other on the 1W time-frame.
However this is the exact reason that they look so similar in technical structure. As you can see both started on a Lower Highs downtrend, which broke to the upside that led to the eventual crash that broke below both the MA50 and MA200 (blue and orange trend-lines respectively). Even their RSI structures are similar.
The COVID crash taught us that as long as the MA200 closed the candles above it, a massive rally was sustained to new Highs. If the same structure is followed on the current fractal, we may see BTC rising by as high as $150k.
So what do you think? Do those two crashes share similarities that can justify a market recovery now? Feel free to let us know in the comments section below!
-------------------------------------------------------------------------------
** Please LIKE 👍, FOLLOW ✅, SHARE 🙌 and COMMENT ✍ if you enjoy this idea! Also share your ideas and charts in the comments section below! This is best way to keep it relevant, support us, keep the content here free and allow the idea to reach as many people as possible. **
-------------------------------------------------------------------------------
💸💸💸💸💸💸
👇 👇 👇 👇 👇 👇
BITCOIN Bullish Correction Ahead! Buy!
Hello,Traders!
BITCOIN taps into a horizontal demand area after sharp decline, signaling a potential bullish reversal. Smart Money likely accumulating positions before expansion toward 116,800$ to rebalance inefficiency. Time Frame 4H.
Buy!
Comment and subscribe to help us grow!
Check out other forecasts below too!
Disclosure: I am part of Trade Nation's Influencer program and receive a monthly fee for using their TradingView charts in my analysis.

BITCOIN Short squeeze in action with 1W MA50 saving the day?Bitcoin (BTCUSD) is rebounding rather as aggressively as it flash crashed on Friday following President Trump's threats on new China tariffs. We've seen the outcome of such Trade War threats back in February - April. In fact that was the last time (April 09 2025) that BTC hit its 1W MA50 (red trend-line). Following that, an enormous long-term rally followed that made new All Time Highs (ATH).
Friday was the first time since then that the price almost touched the 1W MA50, while breaking through the 1D MA200 (orange trend-line) for the first time since April 22. Friday's Low is so far technically a Higher Low on the 1-year Rising Wedge pattern.
The more U.S. and China seem to agree on a new truce and not move forward to escalate threats into actions, the stronger the current short squeeze will be in the market and the current rally will most likely target the top (Higher Highs trend-line) of the Rising Wedge on the key psychological level of $130000.
If however it appears that agreements fall through and the bottom (Higher Lows trend-line) of the Rising Wedge breaks, we expect a deeper and potentially more aggressive fall to he 1W MA100 (green trend-line) around $85000. It also has to be mentioned that Friday's Low hit the 1D RSI 4-month Support Zone and rebounded.
Which scenario do you think is more likely to happen? Feel free to let us know in the comments section below!
-------------------------------------------------------------------------------
** Please LIKE 👍, FOLLOW ✅, SHARE 🙌 and COMMENT ✍ if you enjoy this idea! Also share your ideas and charts in the comments section below! This is best way to keep it relevant, support us, keep the content here free and allow the idea to reach as many people as possible. **
-------------------------------------------------------------------------------
💸💸💸💸💸💸
👇 👇 👇 👇 👇 👇

Bitcoin: Play Range Until Something Changes.Bitcoin is still within the Wave 4 consolidation even though some charts show a brief test of the 102K level. While many supports broke, it was BRIEF. This tariff surprise is the kind of thing I warn about every week on my streams: they come out of no where and a chart WILL NOT warn you about something like this. I have been warning about buying into the 125K area and new highs precisely because of this type of vulnerability. From here the key drivers are going to be either we get a negotiation outcome and the tariffs are delayed again OR we get an implementation of the tariffs. On top of that, unless I am missing something we don't have the results of NFP, and other government reports which also hold potential positive or negative surprises. Plus how is Powell going to process this info for the FOMC meeting this month?
Massive movements like this often signal a structural change. IF this tariff and trade situation gets worse, it could be the fundamental driver that implies that Wave 5 has completed which could mean we are in the beginning of a broad corrective wave. Keep in mind technicals alone are NOT sufficient for this type of analysis in this situation. Everything depends on the outcome of this China Trade situation. The type of sentiment that we are seeing is typical of this time of year and has often marked the bottom of the "Santa Rally" which is has a tendency to follow in the coming months.
As of now, the support and resistance levels are the same. The 108K AREA support for bullish reversals and the 118K AREA resistance for bearish, both specifically on this time frame. IF 118K establishes a lower high, this would be the technical area for a short that can test the 108Ks again and potentially break. This would COINCIDE with a negative tariff outcome.
In my opinion, the situation is more likely to be smoothed over. It is hard to believe these new tariffs will be implemented and I would be watching for positive announcements this week. I have little evidence to base this on besides on the behavior we have seen since April. The 113K area which seems to be the mid point of this range is probably the MOST random price location to be taking any swing trade positions. The best way to play this right now while waiting for clarity is to work on smaller time frames, I repeat this every week. Otherwise, there is not much else to do except maintain an open mind and WAIT for a clear signal.
Thank you for considering my analysis and perspective,

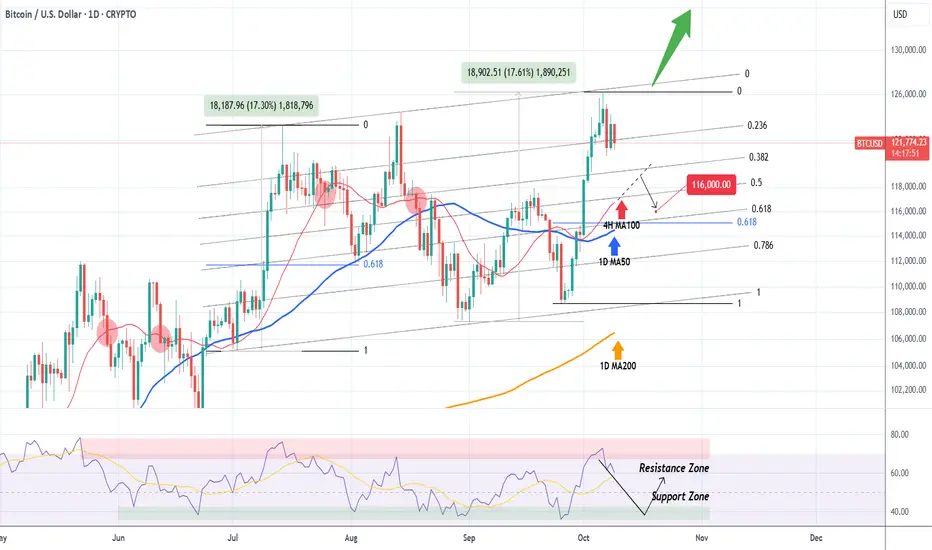
BITCOIN How low can it pull back??Bitcoin (BTCUSD) got rejected on the Higher Highs trend-line we mentioned on our last analysis and is already pulling back. The question is how far can it drop?
Today we expand on that analysis by applying the Fibonacci Channel on the Higher Highs trend-line. Instantly we can see that the Channel Up has two almost perfectly symmetrical Bullish Legs (+17.30% and +17.61% respectively).
The key on this pattern is the 4H MA100 (red trend-line). Every time BTC broke below it since May 29, the decline extended all the way to at least the 1D MA50 (blue trend-line).
Since the 1D RSI also got rejected on its Resistance Zone, we expect a pull-back towards its Support Zone and if the 4H MA100 breaks, further extension towards the 1D MA50. We estimate a potential target to be $116000, which is marginally above the 0.618 Fibonacci retracement level, where the August 02 bounce took place. Needless to say, a break (and 1D candle close) above the Channel's top (Higher Highs trend-line), invalidates any pull-back scenario and, as mentioned previously, constitutes a bullish break-out to a new pattern/ rally.
What do you think will happen next? Feel free to let us know in the comments section below!
-------------------------------------------------------------------------------
** Please LIKE 👍, FOLLOW ✅, SHARE 🙌 and COMMENT ✍ if you enjoy this idea! Also share your ideas and charts in the comments section below! This is best way to keep it relevant, support us, keep the content here free and allow the idea to reach as many people as possible. **
-------------------------------------------------------------------------------
💸💸💸💸💸💸
👇 👇 👇 👇 👇 👇
WHATS UP WITH BITCOIN?
✅BITCOIN went up by almost 16.5% in under 11 days and established a new All-Time-High. An absolutely incredible run, so no wonder we are now seeing a bearish correction.
The take profit wave and the local opportunistic selling pressure might take the price back down to around 118,000$ demand area. This is where we can start buying from again as I am sure a new ATH will be established soon!
LONG🚀
✅Like and subscribe to never miss a new idea!✅
