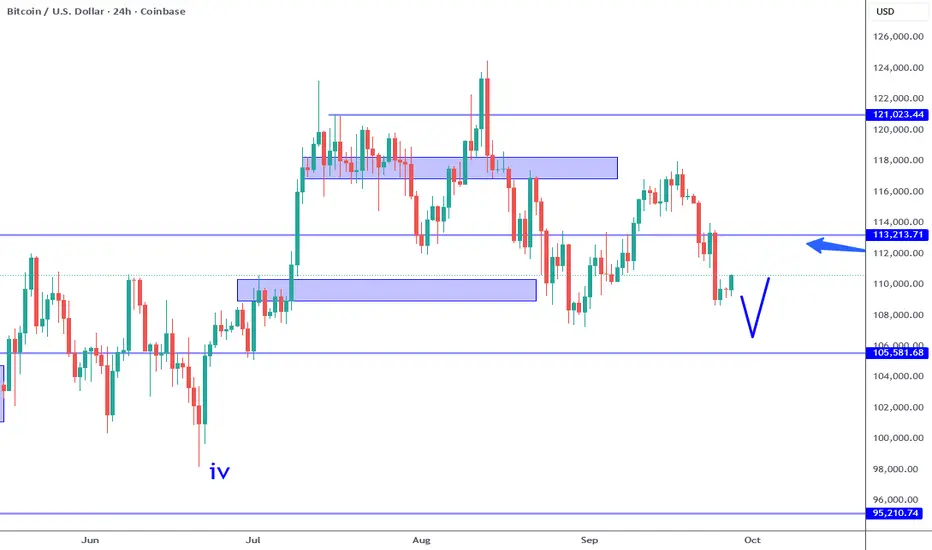
Bitcoin: Range Low Buying Opportunity?Bitcoin has tested the range low below the 105K area. This is an attractive location for new longs IF there is a reversal confirmation (which does not exist right now). It is also possible that a new trend structure is developing (Broad Wave 2) but it is too early to tell. On the smaller time frames, the 109K area is a minor resistance and an area to watch for a potential lower high, while the 113K mid point can now act as a major resistance area. IF either of this resistances stick and confirm, this could be signs of a broader bearish scenario that can see prices back in the 80K area.
Until 103K to 100K area is cleared, it can still be argued Bitcoin is consolidating and price is testing the range low. Just like the 76K swing low, this area may also be such a opportunity UNLESS it breaks. Macro economic fundamentals support the Bitcoin bull argument in terms of where the FED is taking interest rates and plans to "expand" their balance sheet (QE). We still how all of this is affecting gold and silver, and should provide a similar support for Bitcoin. This market has its own variables to contend with, but generally speaking, the coming economic environment (INFLATION) should have a positive effect.
Fundamentals like FED actions carry a lot of weight and must be considered in light of technical events on the chart. This means if Bitcoin breaks support, while other factors can drive it to lower support levels, the PROBABILITY of that is likely to be lower. Use the technical levels as points of reference and observe the price action around these levels. For example, IF an inside bar appears at the completion of the current candle and the high of that candle is broken, that can be interpreted as a buy signal off of a bullish range low. How you mange the risk in this situation is your responsibility.
Forecasting Bitcoin or any market, especially over long time horizons is not practical. Markets trend, BUT environments CHANGE upon the perception of NEW information. Most participants are limited to public information, and with that the only way to navigate the uncertainty is by being good at assessing and managing risk. Charts are just a way to help visualize what that means.
Thank you for considering my analysis and perspective.
Bitcoin-btcusd-btc

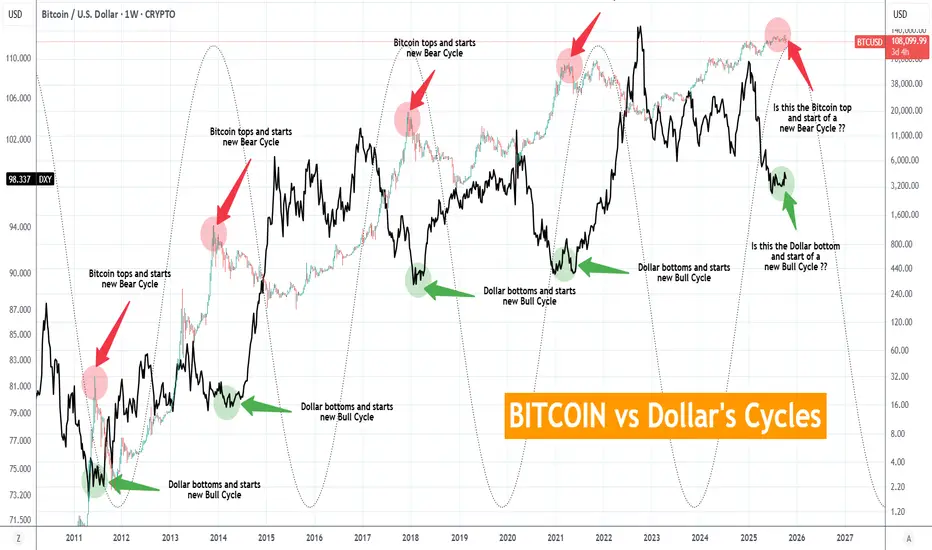
BITCOIN vs Dollar's Cycles. Has the new BTC Bear Cycle started?This is as simple as it can get. And obviously, it is not the first time we give you this chart. This is a cross-asset comparison between Bitcoin (BTCUSD) and the U.S. Dollar Index (DXY) illustrated by the black trend-line. It represents the Cycles of the two assets, typically negatively correlated across the span of 15 years.
As you can see, when the USD bottoms and starts a new Bull Cycle, BTC tops and starts a new Bear Cycle. Similarly vice versa with USD's Bull Cycle tops against BTC's Bear Cycle bottoms.
So the million dollar question is whether the USD has bottomed again. Based on the 4-year Cycle Model and as the Sine Waves illustrate on this chart, it may have. It is no surprise that while the DXY has formed Higher Lows since July 07, BTC has topped and turned sideways on ranged trading with a new Low made on last Friday's crash.
It is not necessary for the USD to break upwards aggressively in order for BTC to start dropping aggressively into its new Bear Cycle. As Jan - March 2018, Jan - March 2013 and May - August 2011 have shown, the USD may range sideways, as long as it is a clear sign of bottom formation, while Bitcoin is already into its Bear Cycle.
So the conclusion is that as long as the USD keeps trading sideways without making a new Low, it is quite like for Bitcoin to be entering its new Bear Cycle. Sound planning, calculated profit taking and gradual (to say the least) de-risking may be required.
So do you think Bitcoin's new Bear Cycle has started? Feel free to let us know in the comments section below!
-------------------------------------------------------------------------------
** Please LIKE 👍, FOLLOW ✅, SHARE 🙌 and COMMENT ✍ if you enjoy this idea! Also share your ideas and charts in the comments section below! This is best way to keep it relevant, support us, keep the content here free and allow the idea to reach as many people as possible. **
-------------------------------------------------------------------------------
💸💸💸💸💸💸
👇 👇 👇 👇 👇 👇
Still believe in a short position on bitcoin
Yes, stopped out
But I insist on the direction of my position in the comming days.

BITCOIN Risky Short! Sell!
Hello,Traders!
BITCOIN is reacting from a horizontal supply area after a strong impulsive move down. Smart Money may engineer a retracement before continuing to target 111,300$ liquidity. Time Frame 2H.
Sell!
Comment and subscribe to help us grow!
Check out other forecasts below too!
Disclosure: I am part of Trade Nation's Influencer program and receive a monthly fee for using their TradingView charts in my analysis.

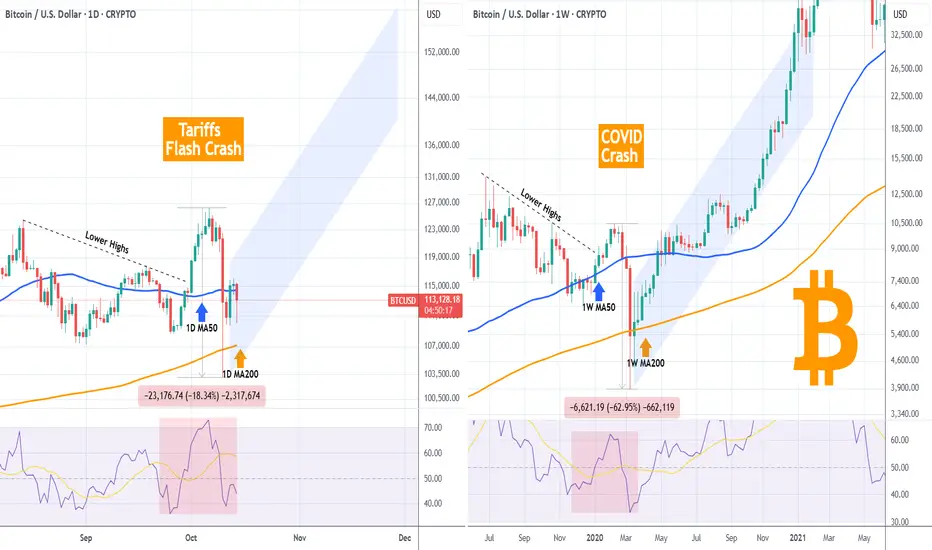
BITCOIN Is last Friday's flash crash similar to COVID's?Bitcoin (BTCUSD) made a strong flash crash last Friday following President Trump's tariff threats to China. That brought back memories of the March 2020 COVID crash. But are those that similar??
Quick answer: strength/ aggression wise no. Last Friday's crash marked 'just' a -18.34% decline from its top on a week basis. COVID's crash, which was longer admittedly, pulled the price down by -62.95% from February's 2020 High. Massive difference in market psychology and dynamics (even though we may have not seen the last of the current Tariff Crash). And that is the reason one chart is on the 1D time-frame and the other on the 1W time-frame.
However this is the exact reason that they look so similar in technical structure. As you can see both started on a Lower Highs downtrend, which broke to the upside that led to the eventual crash that broke below both the MA50 and MA200 (blue and orange trend-lines respectively). Even their RSI structures are similar.
The COVID crash taught us that as long as the MA200 closed the candles above it, a massive rally was sustained to new Highs. If the same structure is followed on the current fractal, we may see BTC rising by as high as $150k.
So what do you think? Do those two crashes share similarities that can justify a market recovery now? Feel free to let us know in the comments section below!
-------------------------------------------------------------------------------
** Please LIKE 👍, FOLLOW ✅, SHARE 🙌 and COMMENT ✍ if you enjoy this idea! Also share your ideas and charts in the comments section below! This is best way to keep it relevant, support us, keep the content here free and allow the idea to reach as many people as possible. **
-------------------------------------------------------------------------------
💸💸💸💸💸💸
👇 👇 👇 👇 👇 👇
BITCOIN Bullish Correction Ahead! Buy!
Hello,Traders!
BITCOIN taps into a horizontal demand area after sharp decline, signaling a potential bullish reversal. Smart Money likely accumulating positions before expansion toward 116,800$ to rebalance inefficiency. Time Frame 4H.
Buy!
Comment and subscribe to help us grow!
Check out other forecasts below too!
Disclosure: I am part of Trade Nation's Influencer program and receive a monthly fee for using their TradingView charts in my analysis.

BITCOIN Short squeeze in action with 1W MA50 saving the day?Bitcoin (BTCUSD) is rebounding rather as aggressively as it flash crashed on Friday following President Trump's threats on new China tariffs. We've seen the outcome of such Trade War threats back in February - April. In fact that was the last time (April 09 2025) that BTC hit its 1W MA50 (red trend-line). Following that, an enormous long-term rally followed that made new All Time Highs (ATH).
Friday was the first time since then that the price almost touched the 1W MA50, while breaking through the 1D MA200 (orange trend-line) for the first time since April 22. Friday's Low is so far technically a Higher Low on the 1-year Rising Wedge pattern.
The more U.S. and China seem to agree on a new truce and not move forward to escalate threats into actions, the stronger the current short squeeze will be in the market and the current rally will most likely target the top (Higher Highs trend-line) of the Rising Wedge on the key psychological level of $130000.
If however it appears that agreements fall through and the bottom (Higher Lows trend-line) of the Rising Wedge breaks, we expect a deeper and potentially more aggressive fall to he 1W MA100 (green trend-line) around $85000. It also has to be mentioned that Friday's Low hit the 1D RSI 4-month Support Zone and rebounded.
Which scenario do you think is more likely to happen? Feel free to let us know in the comments section below!
-------------------------------------------------------------------------------
** Please LIKE 👍, FOLLOW ✅, SHARE 🙌 and COMMENT ✍ if you enjoy this idea! Also share your ideas and charts in the comments section below! This is best way to keep it relevant, support us, keep the content here free and allow the idea to reach as many people as possible. **
-------------------------------------------------------------------------------
💸💸💸💸💸💸
👇 👇 👇 👇 👇 👇

Bitcoin: Play Range Until Something Changes.Bitcoin is still within the Wave 4 consolidation even though some charts show a brief test of the 102K level. While many supports broke, it was BRIEF. This tariff surprise is the kind of thing I warn about every week on my streams: they come out of no where and a chart WILL NOT warn you about something like this. I have been warning about buying into the 125K area and new highs precisely because of this type of vulnerability. From here the key drivers are going to be either we get a negotiation outcome and the tariffs are delayed again OR we get an implementation of the tariffs. On top of that, unless I am missing something we don't have the results of NFP, and other government reports which also hold potential positive or negative surprises. Plus how is Powell going to process this info for the FOMC meeting this month?
Massive movements like this often signal a structural change. IF this tariff and trade situation gets worse, it could be the fundamental driver that implies that Wave 5 has completed which could mean we are in the beginning of a broad corrective wave. Keep in mind technicals alone are NOT sufficient for this type of analysis in this situation. Everything depends on the outcome of this China Trade situation. The type of sentiment that we are seeing is typical of this time of year and has often marked the bottom of the "Santa Rally" which is has a tendency to follow in the coming months.
As of now, the support and resistance levels are the same. The 108K AREA support for bullish reversals and the 118K AREA resistance for bearish, both specifically on this time frame. IF 118K establishes a lower high, this would be the technical area for a short that can test the 108Ks again and potentially break. This would COINCIDE with a negative tariff outcome.
In my opinion, the situation is more likely to be smoothed over. It is hard to believe these new tariffs will be implemented and I would be watching for positive announcements this week. I have little evidence to base this on besides on the behavior we have seen since April. The 113K area which seems to be the mid point of this range is probably the MOST random price location to be taking any swing trade positions. The best way to play this right now while waiting for clarity is to work on smaller time frames, I repeat this every week. Otherwise, there is not much else to do except maintain an open mind and WAIT for a clear signal.
Thank you for considering my analysis and perspective,

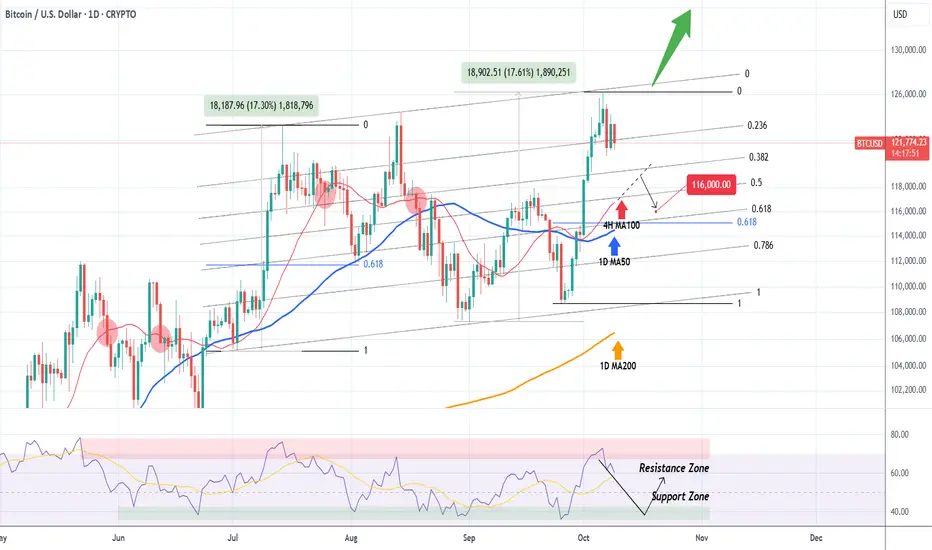
BITCOIN How low can it pull back??Bitcoin (BTCUSD) got rejected on the Higher Highs trend-line we mentioned on our last analysis and is already pulling back. The question is how far can it drop?
Today we expand on that analysis by applying the Fibonacci Channel on the Higher Highs trend-line. Instantly we can see that the Channel Up has two almost perfectly symmetrical Bullish Legs (+17.30% and +17.61% respectively).
The key on this pattern is the 4H MA100 (red trend-line). Every time BTC broke below it since May 29, the decline extended all the way to at least the 1D MA50 (blue trend-line).
Since the 1D RSI also got rejected on its Resistance Zone, we expect a pull-back towards its Support Zone and if the 4H MA100 breaks, further extension towards the 1D MA50. We estimate a potential target to be $116000, which is marginally above the 0.618 Fibonacci retracement level, where the August 02 bounce took place. Needless to say, a break (and 1D candle close) above the Channel's top (Higher Highs trend-line), invalidates any pull-back scenario and, as mentioned previously, constitutes a bullish break-out to a new pattern/ rally.
What do you think will happen next? Feel free to let us know in the comments section below!
-------------------------------------------------------------------------------
** Please LIKE 👍, FOLLOW ✅, SHARE 🙌 and COMMENT ✍ if you enjoy this idea! Also share your ideas and charts in the comments section below! This is best way to keep it relevant, support us, keep the content here free and allow the idea to reach as many people as possible. **
-------------------------------------------------------------------------------
💸💸💸💸💸💸
👇 👇 👇 👇 👇 👇
WHATS UP WITH BITCOIN?
✅BITCOIN went up by almost 16.5% in under 11 days and established a new All-Time-High. An absolutely incredible run, so no wonder we are now seeing a bearish correction.
The take profit wave and the local opportunistic selling pressure might take the price back down to around 118,000$ demand area. This is where we can start buying from again as I am sure a new ATH will be established soon!
LONG🚀
✅Like and subscribe to never miss a new idea!✅

BITCOIN This is the last Resistance standing.Bitcoin (BTCUSD) got rejected (and is currently pulling back) on the Higher Highs trend-line that started on July 14. This is technically the last Resistance before a complete technical bullish break-out that will take the market to a new pattern out of this 3-month consolidation phase.
Until that happens, there are high probabilities to extend this pull-back all the way to the 0.382 Fibonacci extension ($119.5k), which is the minimum level that all similar corrections within these 3 months pulled back to.
As you can see such similar corrections have all been on 4H RSI Bearish Divergences, which have been Lower Highs against BTC's Higher Highs, typical indicator of a Top.
So what do you think will happen next, pull-back or break-out? Feel free to let us know in the comments section below!
-------------------------------------------------------------------------------
** Please LIKE 👍, FOLLOW ✅, SHARE 🙌 and COMMENT ✍ if you enjoy this idea! Also share your ideas and charts in the comments section below! This is best way to keep it relevant, support us, keep the content here free and allow the idea to reach as many people as possible. **
-------------------------------------------------------------------------------
💸💸💸💸💸💸
👇 👇 👇 👇 👇 👇

BITCOIN Bullish Bias! Buy!
Hello,Traders!
BITCOIN is testing the upper boundary of a key order cluster, hinting at possible bullish expansion. A confirmed break above could open the way for continuation toward the 126,000$ target zone. Time Frame 8H.
Buy!
Comment and subscribe to help us grow!
Check out other forecasts below too!
Disclosure: I am part of Trade Nation's Influencer program and receive a monthly fee for using their TradingView charts in my analysis.

BITCOIN 125k broke (new ATH) and it's not stopping there!Bitcoin (BTCUSD) hit $125700 yesterday, making a new All Time High (ATH), closing the 2nd strongest 1W candle of the year. This is a confirmed detachment from the Former Resistance-turned-Support trend-line, following a double bottom bounce on the Bull Cycle's (Higher Lows) Buy Zone.
As you can see, this structure is similar to the first green zone bounce in August 2023 that eventually rose to its 2.0 Fibonacci extension before turning sideways for a while. Even the December 16 2024 High was on the 2.0 Fibonacci extension, even though the formation that preceded it (March - October 2024), wasn't that much similar to the other two.
Based on that, we can see BTC approaching $160000 (Fib 2.0 ext).
Do you expect the market to hit that level? Feel free to let us know in the comments section below!
-------------------------------------------------------------------------------
** Please LIKE 👍, FOLLOW ✅, SHARE 🙌 and COMMENT ✍ if you enjoy this idea! Also share your ideas and charts in the comments section below! This is best way to keep it relevant, support us, keep the content here free and allow the idea to reach as many people as possible. **
-------------------------------------------------------------------------------
💸💸💸💸💸💸
👇 👇 👇 👇 👇 👇

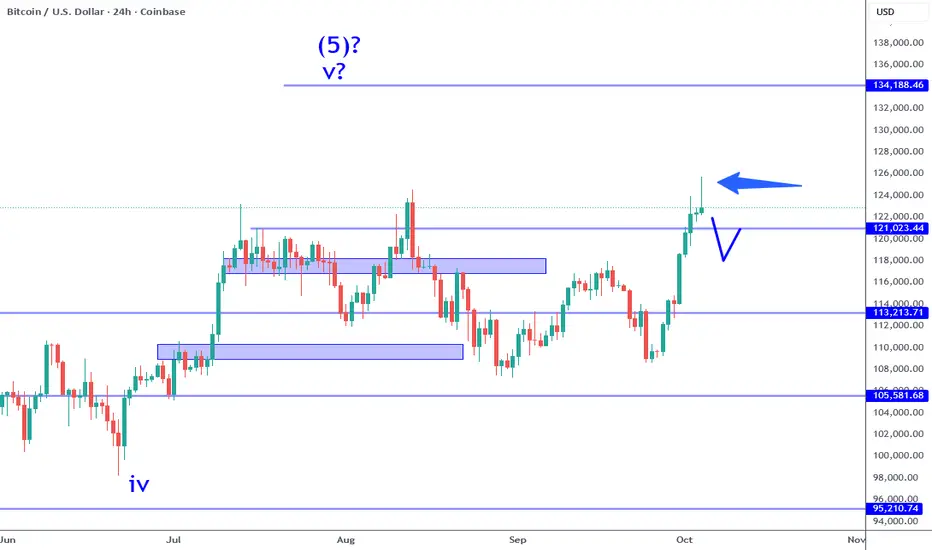
Bitcoin: 125K ATH Then Comes A Pin Bar?Bitcoin straight to new highs above 125K and now showing a bearish pin bar. This is qualifies as a failed high or fake out so far, especially if this candle closes like this. This recent price action signifies that the current consolidation is a wave 4 and this bullish move is likely the beginning of wave 5 which can see a test of the 130Ks UPON a successful breakout. IF the pin bar confirms, a retrace back into the 118K support (old resistance) is likely to play out this week.
The illustration on the chart represents the pullback scenario I am anticipating. The arrow points to the pin bar and new all time high. This outlook is best utilized for day and swing traders and requires confirmations on intraday time frames like 15M, 4H, etc. As far as the risk on the bigger picture goes, this is a range high and the failed breakout means any new longs taken here for the purpose of investing contain the highest amount of risk.
How you play this game is highly dependent on your personal relationship with RISK. If you can handle throwing 10K into Bitcoin now and watch it get reduce to 8K or 5K over the next few months (assuming no leverage), then you have tolerance for risk. Maybe Bitcoin rallies to the 130K area or potentially higher BUT keep in mind, in my opinion, the risk taken a new highs like these is not worth the potential reward. For example, sitting in a 20K retrace is not worth hoping for a 10 or 15K point profit. I personally prefer to get better prices that offer greater probability and potential. The question is are you willing to WAIT? Many are not.
I am not bearish on Bitcoin, I just don't like buying potential tops. Also there is some potential for surprises in the next week or two with the delayed NFP report and the next CPI. While these may have a position effect on the general market, there is potential for a negative surprise. May be enough of a catalyst for Bitcoin as well. Just something to think about.
Thank you for considering my analysis and perspective.
BITCOIN Are we going to see 'UPTOBER' this time??Bitcoin (BTCUSD) has historically seen incredible rallies during the month of October and even more so those Octobers of the last years of Bull Cycles, like the one we are at now. Those rally phases have been very accurately called 'Uptober' rallies.
More specifically, the last three such Octobers (2021, 2017 and 2013) have been massively bullish, all starting after September corrections (Channel Down patterns). In 2013, October reached the 2.382 Fibonacci extension from September's correction, in 2017 and 2021 it reached the 1.786 Fibonacci ext.
As a result, if 'Uptober' is repeated again, this historic price actions gives us an optimistic Target at $132k (Fib 2.382) and a less optimistic one at $125.5k (Fib 1.786).
Do you think we will get such Uptober one more time? Feel free to let us know in the comments section below!
-------------------------------------------------------------------------------
** Please LIKE 👍, FOLLOW ✅, SHARE 🙌 and COMMENT ✍ if you enjoy this idea! Also share your ideas and charts in the comments section below! This is best way to keep it relevant, support us, keep the content here free and allow the idea to reach as many people as possible. **
-------------------------------------------------------------------------------
💸💸💸💸💸💸
👇 👇 👇 👇 👇 👇

BITCOIN making a bullish break-out similar to July'sBitcoin (BTCUSD) just broke above the Lower Highs trend-line of its August 14 All Time High (ATH). This was implemented after a bottom on the 5-month Higher Lows trend-line as well as the 1D RSI Support.
The last time all those conditions were fulfilled was on the July 02 Lower Highs break-out, after which BTC completed a +25.33% rally from the Low, almost touching its 1.786 Fibonacci extension.
Ahead of another 4H Golden Cross, just like then, we expect Bitcoin to make another +25.33% Bullish Leg and reach at least $136000 on the medium-term.
Do you think that's reasonable to expect within October? Feel free to let us know in the comments section below!
-------------------------------------------------------------------------------
** Please LIKE 👍, FOLLOW ✅, SHARE 🙌 and COMMENT ✍ if you enjoy this idea! Also share your ideas and charts in the comments section below! This is best way to keep it relevant, support us, keep the content here free and allow the idea to reach as many people as possible. **
-------------------------------------------------------------------------------
💸💸💸💸💸💸
👇 👇 👇 👇 👇 👇

BITCOIN Strong Rejection! Sell!
Hello,Traders!
BITCOIN After a sharp push into the horizontal supply area, price printed a fakeout and rejected liquidity above. SMC outlook suggests downside continuation toward intraday inefficiency fills. Time Frame 2H.
Sell!
Comment and subscribe to help us grow!
Check out other forecasts below too!
Disclosure: I am part of Trade Nation's Influencer program and receive a monthly fee for using their TradingView charts in my analysis.

BITCOIN Did the 1W MA20 just save the day??On one of our recent analyses we talked about the importance of the 1W MA20 (red trend-line) for Bitcoin (BTCUSD) and the continuation of its non-stop bullish trend since the April 07 2025 Low.
As mentioned then, BTC was likely to extend the trend as long as the 1W candles keep closing above the 1W MA20. The three times a candle didn't, since June 2023, the price declined more to hit (or come very close to) the 1W MA50 (blue trend-line).
Last week was again a successful 1W candle close above the 1W MA50, third time in a month (since August 25) to do so. Technically that solidifies it as a Support and as long as it holds, Bitcoin has more probabilities to repeat at least a +96.38% rally ('weakest' rally it had on this Bull Cycle) and test $145000.
So do you think the 1W MA50 just saved the day and a new rally is ahead of us? Feel free to let us know in the comments section below!
-------------------------------------------------------------------------------
** Please LIKE 👍, FOLLOW ✅, SHARE 🙌 and COMMENT ✍ if you enjoy this idea! Also share your ideas and charts in the comments section below! This is best way to keep it relevant, support us, keep the content here free and allow the idea to reach as many people as possible. **
-------------------------------------------------------------------------------
💸💸💸💸💸💸
👇 👇 👇 👇 👇 👇

BITCOIN Supply Area Ahead! Sell!
Hello,Traders!
BITCOIN price approaches the horizontal supply area, where SMC suggests bearish order flow may resume. Reaction from this zone could drive the pair toward the target at 113,300$. Time Frame 2H.
Sell!
Comment and subscribe to help us grow!
Check out other forecasts below too!
Disclosure: I am part of Trade Nation's Influencer program and receive a monthly fee for using their TradingView charts in my analysis.

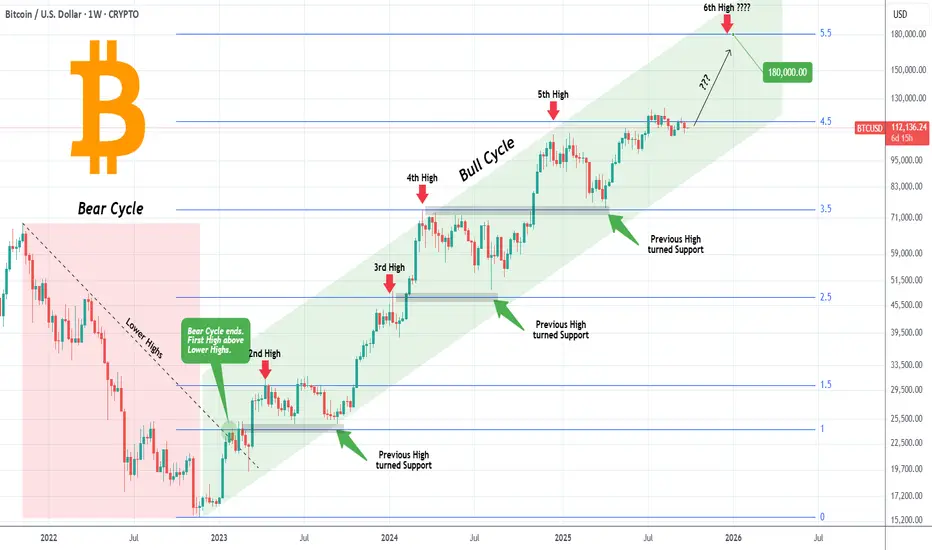
BITCOIN Is there time left for one final run??Bitcoin (BTCUSD) has been trading within a Channel Up pattern through the entirety of its Bull Cycle. The key characteristic of this pattern, which has also helped us at taking profits during each phase in timely manner, has been that every High since the Bear Cycle's Lower Highs trend-line broke, has been on a +0.5 Fibonacci extension interval.
As you can see, starting from Fib 1.5 ext, BTC has fulfilled the pattern by making Highs on the 2.5, 3.5 and 4.5 Fibs so far. What technically remains plausible until the end of the year is the 5.5 Fib ext, which sits at $180k.
With the 4-year Cycle theory suggesting a Cycle Top a little before the end of the year, is it realistic to expect this Target? Do you think there's time for BTC to make one final run like this? Feel free to let us know in the comments section below!
-------------------------------------------------------------------------------
** Please LIKE 👍, FOLLOW ✅, SHARE 🙌 and COMMENT ✍ if you enjoy this idea! Also share your ideas and charts in the comments section below! This is best way to keep it relevant, support us, keep the content here free and allow the idea to reach as many people as possible. **
-------------------------------------------------------------------------------
💸💸💸💸💸💸
👇 👇 👇 👇 👇 👇
Bitcoin: Higher Probability At Range Levels.Bitcoin range is defined by the blue rectangles on this chart. Range low is around the 105 to 108K area and the range high is around the 115 to 118K areas. The 113K area happens to be near the midpoint of this range which means price action here is MOST random. Over the previous week, I pointed out the 113K potential support, and during the week there was a test followed by a bullish engulfing candle. I characterized this as a long, yet now we see that Bitcoin had alternate ideas. There is NO way to forecast price action, the best we can do is come up with reference points and then evaluate the price action that appears.
While the bearish rejection of the 113K area looks very negative, it is meaningless over the bigger picture. The broader trend has not changed, it is generally bullish and the shorter term trend is consolidating (likely the broader wave 4). Keep in mind, historical price action offers a way to gauge risk, strength, weakness BUT does NOT offer any way to accurately forecast the future. Like poker, this is a game of INCOMPLETE information and in order to navigate effectively we MUST adjust as the market provides new pieces of the puzzle.
As of now, here are the levels I am watching: range support 105K, 108K, range resistance 118K, 121K. It is all about how price action behaves IF it reaches one of these areas. Since I do not short on this time frame, that limits me to looking for bullish reversal at these support levels, otherwise there is not much else to do. IF the resistance is reached, even if sell signals occur on this time frame, if I was planning to short, I would be extra selective since there is still a greater chance of a bullish breakout based on the price structure.
The illustration on the chart shows one potential scenario which I believe has a greater probability. IF adverse catalysts occur, then it can completely negate this idea even with confirmation present. The predefined RISK and position sizing aspect is key when it comes to navigating this market optimally. There are many ways to define these variables, one that I use is the Trade Scanner Pro which utilizes the ATR to define risk, etc. Position sizing is another story, but beyond the scope of this article.
Range bound markets are hard to trade if you are too focused on the small picture. You can obtain higher probability outcomes simply by waiting for price areas that carry much more meaning historically. By preparing in advance, you can anticipate price behavior rather than react to price spikes or internet hype. For Bitcoin, it is simply about WAITING for the range support/resistance and confirmation patterns with structured risk management.
Thank you for considering my analysis and perspective.
Do you think I'm joking ???Bitcoin, as you can see, is within a descending wedge. If it breaks down, the price could drop below $100k, but we should wait for the breakout confirmation.

BITCOIN LOCAL LONG|
✅BTCUSD Price reclaims neckline support, showing ICT displacement from the demand area. Smart Money aims for higher liquidity toward 111,000$ to rebalance inefficiency. Time Frame 1H.
LONG🚀
✅Like and subscribe to never miss a new idea!✅
