Back in the Channel – Eyes on New ATHs AheadBitcoin: Back in the Channel – Eyes on New ATHs Ahead 🚀
We're slowly seeing confidence return… and this is not just another bounce. This chart shows BTC reclaiming the massive ascending channel that has governed price action since early 2023. Price just wicked perfectly back into structure — a key reclaim above 88,652 has flipped the narrative back in the bulls' favor. 📈
Three key things stand out:
Channel structure is intact — this is a clean re-entry.
Support held above 88,652 — major validation point.
Targets now shift to 115,054 → 124,144 → 138,800 — each level has history and structure behind it.
New ATHs may not come tomorrow, but with this kind of technical structure, early 2026 could bring serious fireworks . If the bulls stay disciplined, this is a textbook reaccumulation setup inside a macro trend.
Longs are valid as long as we hold above 88,652. Let price do the talking.
Thought of the Day 💡
Respect the structure, not the emotions. Charts like this don’t lie — it's the humans that waver. The higher the timeframe, the stronger the truth.
Disclaimer: What you read here is not financial advice — it’s high-level market philosophy from the FXPROFESSOR himself. Risk is real, and your capital is your responsibility. Learn, adapt, evolve.
One Love,
The FXPROFESSOR 💙
My worries: 79k was NOT checked as support And that is the major support on my chart. There is still over 40% likely that we need to check that 79k level.... but hey: i will be LONG over 88,652 — eyes on 115K → 124K → 138K 🚀 (just remember to play the levels: long over/short under!)
Bitcoin-btcusd

BTCUSD Pauses at Structure Top — Bulls Aim for 95,500 RetestHello traders! Here is my breakdown of the current BTCUSD setup. After a strong bearish phase, Bitcoin found support near the major Support Level around $89,100. Before reaching this zone, price was trading inside a broad descending channel, where both the Resistance Line and Support Line guided the downtrend. A fake breakout occurred near the lower boundary, showing early buyer interest, but overall momentum remained bearish until price reached the support. From there, BTC formed a clear sideways Range, signaling accumulation before a reversal attempt. Once buyers gained strength, price broke out of the range and shifted into a bullish structure. BTC began climbing within a rising wedge-like channel, respecting both the ascending Support Line and the diagonal Resistance Line. Along the way, the market formed multiple breakouts and fake breakouts, confirming active participation from both sides. However, buyers consistently defended the rising trendline, maintaining higher lows while approaching the key horizontal Resistance Level near $95,500. Currently, BTCUSD is pulling back slightly after touching the wedge resistance. As long as price holds above the ascending support and stays above $89,100, the bullish structure remains intact. My scenario suggests a potential continuation toward TP1 → $95,500 upon a successful rebound from the local support. If the market breaks below the rising structure, however, a deeper correction may unfold before any further upward attempt. For now, buyers are favored while the price remains inside the ascending channel. Please share this idea with your friends and click Boost 🚀

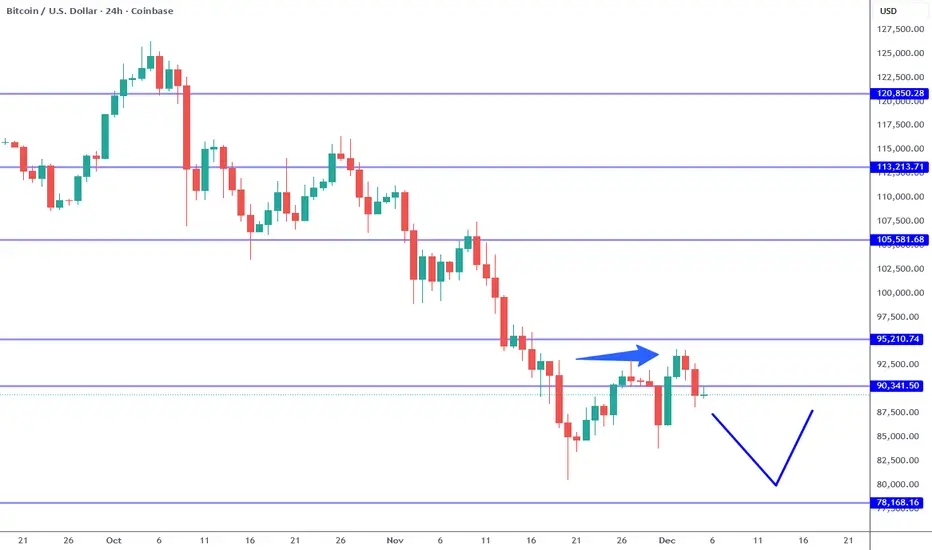
Bitcoin Setting Up For New Low.Bitcoin short term trend is STILL bearish. The 95K resistance defines the structure which implies a lower low is likely to follow in the near future. There is also a failed high off the 93,500 area which suggests further weakness as well (see arrow). IF the 88K area breaks again (trend line break), a test of the 78K low area becomes a higher probability. IF the 95K resistance is broken instead, it cancels out this scenario. It is not about which way I think the market is going to move, it is about what the MARKET chooses. Our job is to look for confirmations, manage risk and adjust to NEW information.
This week we have the FOMC meeting and press conference. This event carries a LOT of weight especially because the Fed is expected to provide guidance on how they plan to shape monetary policy in the near future. The market has priced in another 25 basis point cut, which means what will move the market dramatically is what is said as the press conference. This event has the potential to change the Bitcoin price structure and short term expectation as well. Going into this with opinions is a sub optimal way to mange risk around such an event.
While the major index markets like S&P and Nasdaq are also testing potential resistance levels, IF the Fed unveils and dovish outlook prices will likely grind higher. Also it is important to keep in mind in the coming year (May) Chairman Powell will be out and a new appointee will take over. WHOEVER this person is (still not officially known), WHATEVER they say in interviews, etc., before he is officially the chairman will carry MORE weight than Powell. Important to KEEP in mind for the coming year.
When markets are coming up to an event such as this FOMC, it is better to keep expectations low and take whatever you can get. For example, if you play the bullish trend line on a 4 hour chart for a swing trade, do not look for more than 1:1 trades even for brief swing trades. It is the same if the resistance levels are tested: wait f or confirmations, whether it is a day or swing trade, and keep profit objectives tighter than usual. Markets are likely to become more and more indecisive going into the day of the meeting.
If 78K to 80K support is tested again, watch for a lower low. 73K is a major support. These levels are attractive for investing in my opinion.
Thank you for considering my analysis and perspective.
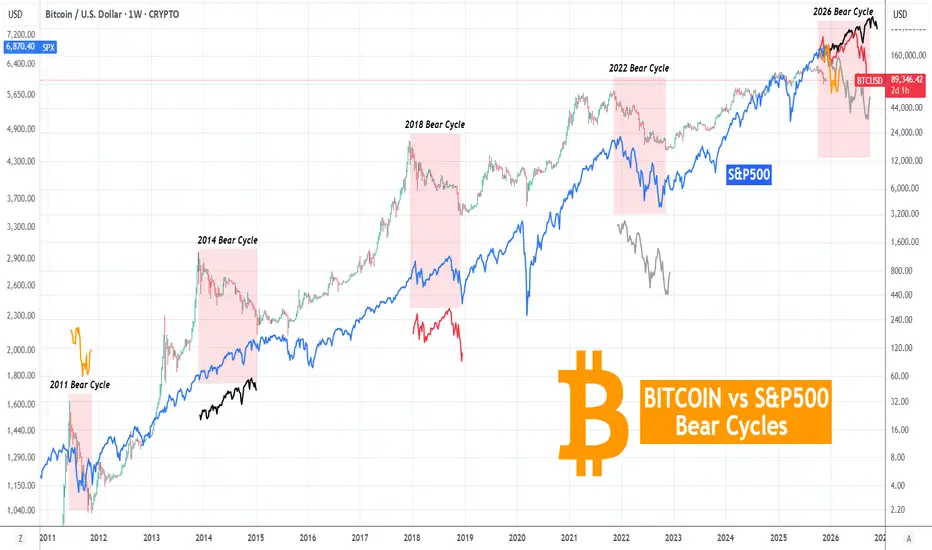
BITCOIN vs S&P500 Is the Bear Cycle correlation a myth?Bitcoin (BTCUSD) has entered a new Bear Cycle while the stock markets remain near their All Time Highs (ATH). The general notion is that when BTC starts a Cycle (either Bull or Bear), the stock market, which on this particular analysis is the S&P500 (blue trend-line) follows suit. But how much truth is in it?
Here we see those Bear Cycles since 2011. As you can see in 2011 and 2022 both BTC and the S&P500 dropped around the same time. In 2018 even though both started falling, the S&P500 recovered shortly after, even made new ATH but dropped again remaining volatile. On the other hand in 2014, the S&P500 kept rising, even though BTC was in a Bear Cycle.
As a result, the above notion isn't 100% accurate, not entirely a 'myth' but for sure not a certainty. We even plotted all previous S&P500 sequences during BTC's Bear Cycle, on today's Cycle and as you can see the worst case scenario based on that is a 2022 type correction (grey fractal), which would bring the index back to the April 2025 lows. Bitcoin will most likely have a typical Bear Cycle, especially with the last two (2022 and 2018) being almost identical.
So do you think the Bear Cycle correlation is a myth or not? Feel free to let us know in the comments section below!
---
** Please LIKE 👍, FOLLOW ✅, SHARE 🙌 and COMMENT ✍ if you enjoy this idea! Also share your ideas and charts in the comments section below! This is best way to keep it relevant, support us, keep the content here free and allow the idea to reach as many people as possible. **
---
💸💸💸💸💸💸
👇 👇 👇 👇 👇 👇
BTC TO 60K PREDICTION this is just my prediction for btc
we had a choch on the weekly and failure to close above our previous weekly high and we broke through previous monthly low with heavy momentum and we are in weekly premium and have a fvg that needs to be filled before going higher and we also have an order block below with lines up with my monthly short term ema(blue line) and usually price likes to come to an order block when a fvg gets filled so yea btc to 60k

BITCOIN SIGNAL: THIS IS WHERE THE CRASH WILL STOP!!!? (watchout)Yello Paradisers! Enjoy the video!
We are discussing a lot of technical stuff—Elliott Wave theory. We are going through multiple time frames, and I'm updating you about the price action, development structure, and important levels, as well as what the highest probability next move is.
And Paradisers! Keep in mind to trade only with a proper professional trading strategy. Wait for confirmations. Play with tactics. This is the only way you can be long-term profitable.
Remember, don’t trade without confirmations. Wait for them before creating a trade. Be disciplined, patient, and emotionally controlled. Only trade the highest probability setups with the greatest risk to reward ratio. This will ensure that you become a long-term profitable professional trader.
Don't be a gambler. Don't try to get rich quick. Make sure that your trading is professionally based on proper strategies and trade tactics.

BITCOIN Mayer Multiple shows the way to the Bear Cycle bottom.Bitcoin (BTCUSD) remains on a short-term rebound, as mentioned before, a standard counter-trend/ dead cat bounce during Bear Cycles.
Here you see the Mayer Multiple Bands (MMB), an indicator we've used countless times to determine tops, bottoms and general trends of a Cycle. This time we plot this simple yet powerful tool to make an early estimate on the potential bottom of this Bear Cycle.
We will keep this short as there is no reason to overcomplicate things, especially at this stage. BTC is as we said on a small rebound currently after almost testing the 2SD below (blue trend-line) of the MMB. On all previous Bear Cycles show on this chart, every time this happened, the market bounced and consolidated then.
When the 2SD below trend-line broke, the market reached the 3SD below (green trend-line) rather aggressively and quickly. In all instances, that was the Bear Cycle bottom, with the only exception being the 2022 Bear Cycle, which gave one last short-term rebound/ consolidation and bottomed when it broke below the 1W MA300 (red trend-line).
The 1W MA300 has historically had a hidden but key role on BTC Cycles. When tested, always after the initial MMB bottom, it provided a 2nd and final opportunity to enter (buy) the new Bull Cycle at such a low price.
It is possible to see something like that happen again. With its course (1W MA300), assuming the current Bear Cycle also lasts for around 52 weeks (364 days) like the previous two, we estimate it to be a little under $60000 by October 2026. The MMB 3SD below though could be by that time around $40000. It is possible of course that we breach the 1W MA300 (much) earlier thus at a lower price, meaning also potentially hitting the MMB bottom a little higher.
In any case the bottom range seems roughly by $60k - $40k. Since determining the Cycles (hence Tops - exits, Lows - entries) has always been more about timing and less about pricing, this is why we've discussed before that it would be a good idea to start buying (call it DCA if it suits you better) around $60k. As always, however, these are just the facts. The decision is yours.
So at what price do you think this Cycle will bottom? Feel free to let us know in the comments section below!
---
** Please LIKE 👍, FOLLOW ✅, SHARE 🙌 and COMMENT ✍ if you enjoy this idea! Also share your ideas and charts in the comments section below! This is best way to keep it relevant, support us, keep the content here free and allow the idea to reach as many people as possible. **
---
💸💸💸💸💸💸
👇 👇 👇 👇 👇 👇

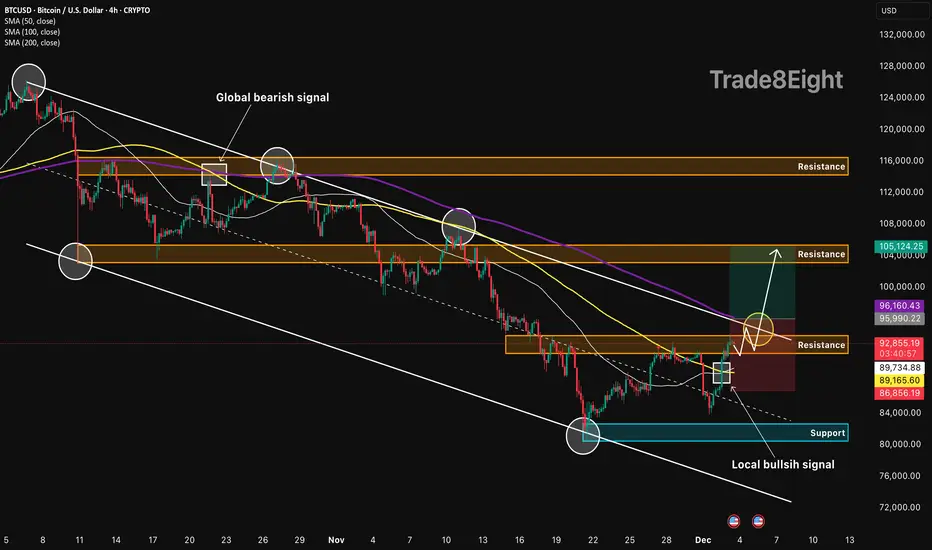
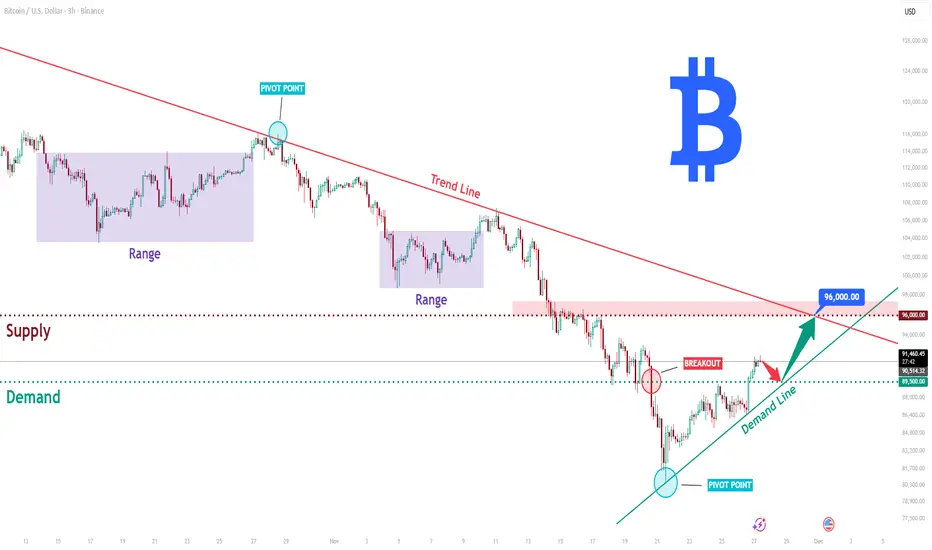
BTCUSD: channel breakout setup🛠 Technical Analysis: On the 4-hour timeframe, Bitcoin (BTCUSD) is trading within a descending channel but has recently printed a "local bullish signal" after bouncing from the 82,000 support zone. The price is currently compressing against the channel's upper trendline and the immediate resistance block at 92,877, with the moving averages (SMA 50, 100) flattening to support a potential reversal. The projected trade setup anticipates a high-momentum breakout above the SMA 200 and the diagonal resistance, targeting the liquidity pool at the 105,000 level.
❗️ Trade Parameters (BUY) ❗️
➡️ Entry Point: Buy on confirmed breakout of resistance (approx. 95,500 – 96,200)
🎯 Take Profit: 104,500 – 105,120
🔴 Stop Loss: Below SMA (approx. 86,850)
⚠️ Disclaimer: This is a potential trade idea based on current analysis; market conditions and price direction are subject to change based on news factors and volatility.
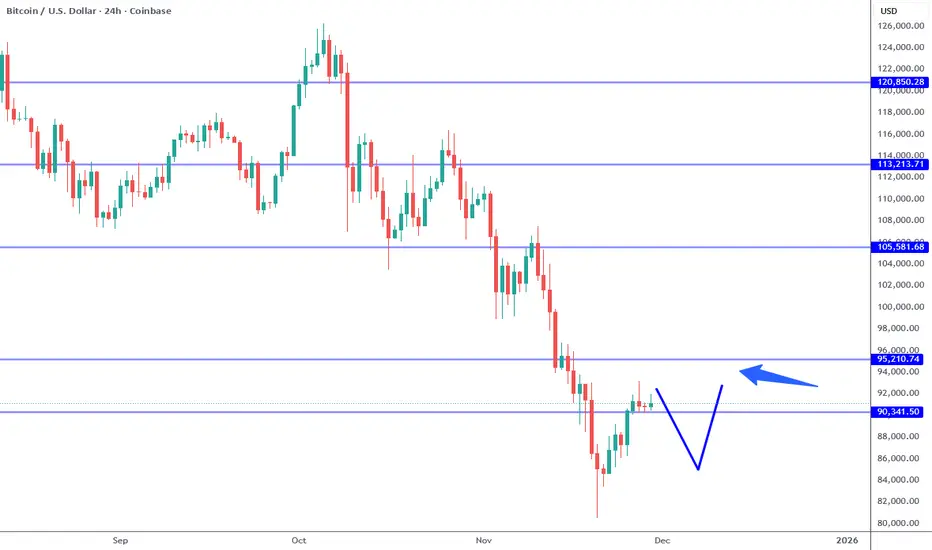
BTCUSD Long: Volatility Rising — Retest of 90,000 ExpectedHello, traders! The price auction for BTCUSD has been in a corrective phase, forming a broad descending structure guided by the major Trend Line. This bearish pattern has been defined by a sequence of lower highs and lower lows, with price repeatedly getting rejected from the Supply Zone and consolidating inside the highlighted range. The market has respected both the descending supply line and the rising Demand Line, creating a well-defined compression of price action.
Currently, the auction is at a critical inflection point, with BTC retesting the Demand Line near the 85,600 demand level. After a series of volatile moves inside the range, the price is attempting to stabilize at this structural support while gradually approaching the descending trendline once again. This tightening of volatility between supply and demand suggests that a significant directional move is likely to occur soon.
My scenario for the development of events is a bullish rebound from the Demand Line, followed by a test of the descending supply line. I expect the price to attempt an impulsive breakout toward the major Supply Zone. In my opinion, a successful breakout above this zone may carry BTC toward the 92,300 resistance target marked on the chart. Manage your risk!

BITCOIN (BTCUSD): Bullish Reversal is Coming?!
On our yesterday's live stream, we discussed Bitcoin.
It looks like the market found a bottom and preparing for a bullish reversal.
To confirm a start of an uptrend, I suggest focus on
92000 - 94100 Order Block zone.
Its breakout and a daily candle close above will confirm a bullish reversal.
A formation of a Higher Low after the last retracement from that leaves
some clues of a weakening bearish momentum.
A breakout will be our final confirmation.
❤️Please, support my work with like, thank you!❤️
I am part of Trade Nation's Influencer program and receive a monthly fee for using their TradingView charts in my analysis.

$BTCUSD - #Bitcoin cycle analysisHi guys! 👋🏻
🔔I'd like to share with you my current Bitcoin BTCUSD analysis here.
🔔 The last correction is taking an impulse 5-wave structure, it seeems like we are about to complete the 5th wave of the Intermediate A, bounce back to $102K to complete the B and drop back to the levels near $70K - 64K to complete the correction.
🔔 I know it sounds disappointing but we need a correction to regain power. Now, before throwing tomatoes, please see cycle charts below. And never underestimate the power and rules of cycles in the market.
🔔 Why channels always matter
🔔Wave paths
🔔Fibo
🔔 Path to $150K shall look like this
🔔Concetration of Supports and Resistances
Sharing for educational purposes!
✊🏻 Good luck with your trades! ✊🏻
If you like the idea hit the 👍🏻 button, follow me for more ideas.

BITCOIN FREE SIGNAL|SHORT|
✅BTCUSD price is approaching the mitigation block after sweeping liquidity inside the premium zone. If the retest confirms displacement, a drawdown into the target imbalance becomes likely.
—————————
Entry: 92,246$
Stop Loss: 93,200$
Take Profit: 90,000$
Time Frame: 4H
—————————
SHORT🔥
✅Like and subscribe to never miss a new idea!✅

Bitcoin Count to $55,000Need to get over 100k to turn bullish at this point. Think we are either finishing this move around 72,500 or going to continue down to around 55-60k
Not financial advice

BITCOIN Can this Bear Cycle be mapped?Bitcoin (BTCUSD) is on its 3rd straight week of consolidation on its 1W MA100 (green trend-line) after marginally breaking below it (green circle). We've shown in previous analyses how the build up, including the Higher Lows trend-line (1W RSI Lower Highs Bearish Divergence) and the 1W MA50 (blue trend-line) rebound, of the 2025 Bull Cycle High, mirrors the 2021 peak formation.
Given the strong similarities, there are valid probabilities suggesting that those can expand into the Bear Cycle too. And this is what we attempt to do on today's post, mapping the new Bear Cycle based on the 2022 price action.
As you can see, we have classified the 2022 Bear Cycle into three phases. The key characteristic of those is MA contact. Phase 1 ends when the price hit the 1W MA100, Phase 2 when it hits the 1W MA200 (orange trend-line) and Phase 3 the 1W MA350 (red trend-line). So far the symmetry is also high on the time range between the 1W MA50 and 1W MA100 contacts among the two fractals (245 days vs 224 days).
If this holds for the whole duration of the 2026 Bear Cycle as well, we can expect it to roughly be 52 weeks (364 days) from the Bull Cycle Top to the Bear Cycle bottom, like the 2022 sequence.
The time Fibonacci levels help at maintaining a sense of positioning within the Bear Cycle, with the 0.236 Fib being just before Phase 1 ends and Fib 0.618 when Phase 2 makes contact with the 1W MA200.
Even though a straight up repeat of the -77.36% decline of the 2022 Bear Cycle would put the potential new bottom just below $30k, a Fibonacci extension symmetry suggests that Fib 1.0 was the Low we just made (1W MA100), Fib 1.5 ext around the time the price makes contact with the 1W MA200 and Fib 2.0 when the Cycle bottoms.
This indicates that $63900 is the first point of interest (and potentially start of buying) and $51000 the potential bottom.
Would you agree with this mapping? Feel free to let us know in the comments section below!
---
** Please LIKE 👍, FOLLOW ✅, SHARE 🙌 and COMMENT ✍ if you enjoy this idea! Also share your ideas and charts in the comments section below! This is best way to keep it relevant, support us, keep the content here free and allow the idea to reach as many people as possible. **
---
💸💸💸💸💸💸
👇 👇 👇 👇 👇 👇

BTCUSD: Bearish Sequnce Not Finished,Unless It Breaks 100kA lot of traders are wondering when Bitcoin will complete the pullback from the highs, but if we are really in a higher-degree retracement then keep in mind that the big pullbacks on Bitcoin usually lasted around 12 months, and right now we are only one and a half months away from the recent highs. That’s the first thing. The second thing, and the most important for me, is always the Elliott wave structure itself. I simply cannot ignore it, because it helps me identify the key levels that must be broken before we can confidently look for a turning point.
If you look closely at the price drop from the 116515 level, you can clearly see that this is a strong decline without a completed five-wave sequence yet. So even if we assume this is wave C rather than wave four, it still has to be structured by five waves. That means the current rebound from the 80k zone could easily be just a fourth wave, maybe stopping around 90k, which is an important swing level for this week.
Based on Elliott waves and price action, this weakness can still resume. The key level for a bullish turn is very clear: a push back above 99k, or better said 100k, which is a strong psychological pivot. Below it we stay in bearish mode with risk for one more drop.

BTCUSD | Rejected Posted this idea few days ago and worked out a bit to well maybe :).
We are still in a downtrend so that's the reasoning behind the short idea from the red zone.
looking forward to see what happens at the 81.500 level.
What are your insights on Bitcoin?
Stay safe out there and do your own due diligence, this is not investment advise!

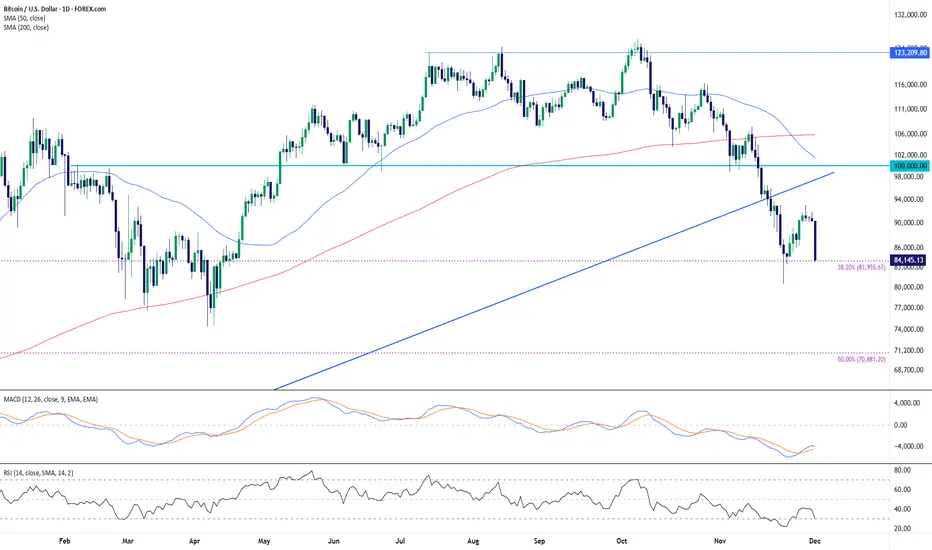
Bitcoin Extends Decline Toward Fibonacci Support as Momentum RemBitcoin continues to trade under clear downside pressure after breaking beneath its long-standing ascending trendline in November. The recent rebound attempt stalled near the underside of that same trendline—now acting as dynamic resistance—and price has since rotated lower again.
The broader structure shifted bearish once price fell below the 50-day SMA and 200-day SMA, both of which are now flattening or turning lower. This places the market in a momentum-cooling environment where sellers remain in control unless a sustained recovery develops above key moving averages.
The chart also highlights confluence around the 38.2% Fibonacci retracement level drawn from the major swing low, which sits near the latest reaction zone. The initial bounce from this area shows that participants are aware of the level, though the follow-through remains limited for now.
Momentum indicators reflect persistent weakness. The MACD remains in negative territory, with both signal lines tracking below zero and only modest signs of stabilization. RSI recently dipped into the 30-zone before attempting to lift, indicating oversold conditions were tested but broader momentum has not convincingly recovered.
Overall, the chart continues to lean bearish as long as the market holds below the broken trendline and the major moving averages. Price behavior around the Fibonacci region will be an important gauge of whether this decline matures into a deeper corrective phase or begins to base out.
-MW
01/12/25 Weekly OutlookLast weeks high: $93,088.10
Last weeks low: $85,279.04
Midpoint: $89,183.57
A brutal start to the week for the bulls here. A -6% move to the downside as soon as the Month of December opens rejecting off the range weekly high. Across the high time frame this confirms a new lower high and a failure to get back within the trend that has stayed consistent throughout this bull market.
All of last weeks recovery bounce has been wiped out in a matter of hours, so now the question is where does the buy side pick up, if at all? FOMC interest rate decision is predicting another rate cut (80% probability) as well as the end of quantitative tightening and the beginning of quantitative easing on paper should bring more liquidity into risk-on markets such as Bitcoin, but that is on a longer timescale.
In the more immediate time frame I think the range broadly $80,000-$100,000 with this weeks range seeing a lot of the noisy PA. Midpoint is a key S/R level to gauge sentiment and conviction, a reclaim of the level may open the door to a stop loss hunt around weekly high but for now the momentum is definitely with the bears.

BTCUSD 1W - My Thoughts Going into Dec 1 2025 Week BTC heads into the first week of December in a clear corrective phase, with price likely to remain choppy as it digests the recent downside move. The mid-80k zone is acting as an interim equilibrium, but the broader structure still favors a deeper liquidity sweep toward the 70k-73k support band before any meaningful trend re-acceleration.
Volatility should remain elevated, and the market is positioned to shake out weak hands during this chop. Structurally, pullbacks into key supports continue to define the higher timeframe trend, while sellers are losing momentum on each leg lower.

Bitcoin: Watch For Higher Low 85K Area.Bitcoin has bounced off of 80K while promising, the short term trend structure is still bearish. 95K and 100K are the next resistances and potential turning points respectively. IF price cannot break 100K or produce a higher low, it would be reasonable to anticipate a lower low (below 80K). A short tern bearish trend should NOT be confused with a "bear" market. This corrective move from the 126 peak is nothing more than an overdue retrace and many "experts" are simply not experienced enough to know what a real bear market is.
If you follow the general consensus on social platforms, you will have a very hard time anticipating the market, and instead always find yourself reacting. In this game, collective "wisdom" or the herd mentality is usually WRONG because they are reacting to what they see and fail to consider factors that are not so apparent. Also short term price movements (1 to 3 months) is strongly affected by SENTIMENT which is IRRATIONAL. Focusing on short time frames prevents you from recognizing the probabilities and opportunities that are slowly developing in the larger time horizons. This is where swing traders and investors should be paying the MOST attention. If the "experts" are so good, why wasn't anyone calling for this "bear market" back when Bitcoin was pushing 126K?
Bear and Bull market is too vague of a way to describe a market environment and sets the expectations that it will continue. As a CONTRARIAN, I look for strong arguments to support short term and long term risks and probabilities. This move is a simple pullback within a broader bullish structure. To better put this into perspective, consider the upcoming KEY economic drivers that will affect Bitcoin: December Federal Reserve concludes quantitative tightening (inflationary), the FOMC meeting Fed is expected to cut rates again (inflationary), over the coming year Fed is expected to start quantitative easing (inflationary). Everything points to more money in the system which will strongly benefit anything anti inflationary like Bitcoin, Gold, stocks, etc. These type of catalysts are NOT in line with a "bear" market.
Another important point is the 88K overlap that I have talked about previously. While price has briefly probed below 88K, it has only spent literally a day or two before swiftly recovering. While the short term structure is bearish, IF price cannot stay below 88K, then In my opinion there is a greater chance that Bitcoin is still within the broad Wave 4 and NOT in the broadest Wave 2 which implies Wave 5 is to follow. IF this is true. Bitcoin should have no problem breaking above 100K which will be an important test. Wave 5 can test the 126K high at minimum but keep in mind this can take months to play out. In these situations wave counts can be confusing, which is why I do NOT make decisions based on them alone, they only serve as a general guide to help shape expectations. Price structure and confirmations carry a LOT more weight.
The illustration on my chart shows the test of low and potential higher low scenario that I am anticipating for the coming two weeks. The arrow points to the key resistance that will either keep this bear structure intact, or break which will confirm we are changing back into a bullish structure (wave 4 scenario). Even if price does not reverse, I am still looking at these lows as an investment opportunity.
Thank you for considering my analysis and perspective.
BTCUSD Long: Compression Near Trend Line, Possible Move to $96KHello, traders! BTCUSD continues to move within a broader descending structure, where the price has consistently respected the major downward trend line. Each approach to this trend line has resulted in a new lower high, confirming seller control in the medium-term outlook.
Currently, after the decline, Bitcoin tested the Demand Zone around $89,500, where buyers formed an important pivot point, triggering a noticeable upward impulse. This reaction confirmed strong demand and pushed the price toward the key compression area between the Demand Line and the main descending Trend Line.
My scenario, if buyers maintain pressure and break above the descending trend line, BTCUSD may extend its bullish correction toward the $96,000 supply zone. However, if the demand level fails to hold, this scenario becomes invalid, opening the path toward deeper support levels. Manage your risk!
BITCOIN Has the price reached the bottom ?!Despite the rise that is happening now, I still see more downsides
I expect to see a test of 13.800$
This support is very important and we should not see the closing of a month candle below it
The situation of the global economy is not good, so I do not expect to see large liquidity entering the markets in these months
Please support the idea by pressing the like button and writing your opinion in the comment box
Good luck 🌹

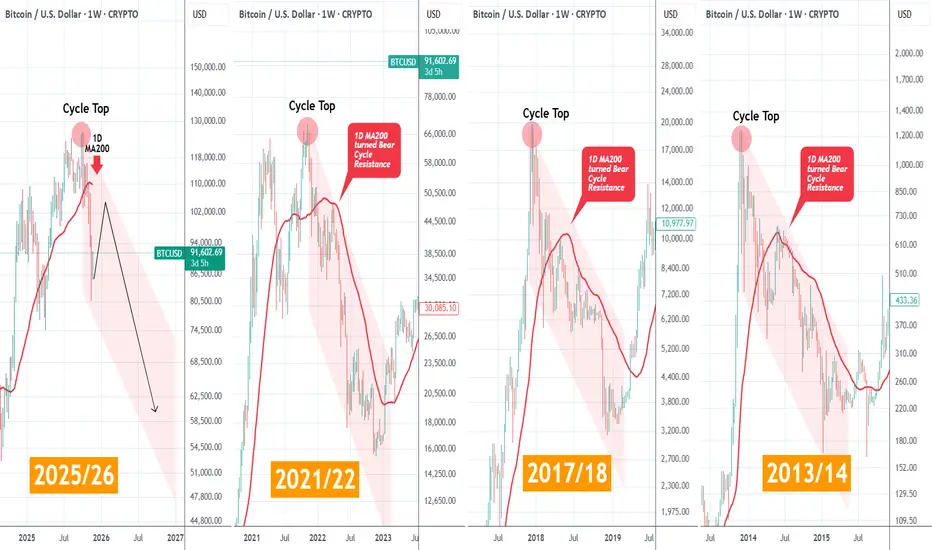
BITCOIN ! HAPPY THANKSGIVING ! Does the 1D MA200 spoil the mood?First of all allow me to wish everyone Happy Thanksgiving with all the blessings this day may bring to your family and loved ones.
As for Bitcoin (BTCUSD), the anticipated short-term rebound is targeting the first Lower High of the emerging Bear Cycle. What's critical in this? The 1D MA200 (red trend-line) and the reason is simple.
As the previous three Cycles show on this graph, when BTC starts a Bear Cycle and breaks below its 1D MA200, it then turns into the Resistance for the rest of the Cycle. And as you can see, it rejected every single time the Lower Highs. Practically that is the most optimal level for someone to short for as long as the Bear Cycle lasts.
As a result, we expect the current counter-trend rally/ dead-cat bounce (call it as you want), to be limited by the 1D MA200, which is currently at $110k and falling, then get rejected and start the next Bearish Leg of the Channel Down.
So do you think the 1D MA200 will play the role of the long-term Resistance from now on? Feel free to let us know in the comments section below!
---
** Please LIKE 👍, FOLLOW ✅, SHARE 🙌 and COMMENT ✍ if you enjoy this idea! Also share your ideas and charts in the comments section below! This is best way to keep it relevant, support us, keep the content here free and allow the idea to reach as many people as possible. **
---
💸💸💸💸💸💸
👇 👇 👇 👇 👇 👇