Bitcoin – Technical Outlook
🔹 Key Zone: 101,500 – 104,500
At the moment, price is trading within this key zone where strong buying and selling activity is taking place — a critical area that will likely determine the next major move.
🟢 Bullish Scenario (Uptrend)
If price breaks above and holds above 104,500, this would confirm a continuation of bullish momentum.
In that case, price is expected to move higher toward 120,040, with further potential extension toward 125,567.
📈 This zone is an important confirmation area that could signal the beginning of a new bullish leg.
🔴 Bearish Scenario (Downtrend)
However, if price drops below and stabilizes under 101,500, this would indicate a potential bearish reversal.
In that case, the price may move downward toward the support zone at 97,700 – 93,400.
Breaking below this area would confirm further bearish extension toward 88,080.
📊 Summary:
Currently, Bitcoin is trading inside the key zone (101,500–104,500).
A breakout above or below this range will likely define the next strong market direction — whether a bullish continuation or a deeper bearish correction.
Bitcoin-btcusd

Just another Bear Cycle BTCIn the current halving period, Bitcoin has begun to enter a bear period where the halving period has begun to end and it is time for BTC to consolidate for the next 4 years.
The current period of 52 weeks from which this thesis was created, will fall in the 3rd quarter of 2026 (November 2026). It is recommended to start doing DCA again in nov 2026

BTCUSD — Daily Swing Plan (1D) # BTCUSD — Daily Swing Plan (1D)
**Thesis:** Macro trend remains bullish, but a liquidity sweep into demand is likely before continuation toward the upper resistance band.
## Key Levels
* **Resistance:** 103,571 → 106,000 (pivot), then **116,626 – 119,784** (primary take-profit zone)
* **Demand / Support:** **92,660 – 88,656** (staged buy zone)
* **Dynamic support:** rising green trendline intersecting ~98–100k
## Base Case (Pullback then Rally)
1. Price wicks into **92,660 – 88,656** to collect liquidity.
2. Reversal back above the trendline; reclaim **103,571** and hold as support.
3. Extension toward **116,626 – 119,784** for distribution/TP.
## Alternative Bull Case
* Fast reclaim and hold above **103,571** without a deep retest → grind toward **110k+** and then **116–120k**.
## Bear Invalidation / Risk
* **Daily close below 88,656** invalidates the bounce setup and opens **85k / 81k**. Reassess if triggered.
## Indicators & Context
* **Stoch RSI (3,3,14,14) 1D** is oversold (~16), favoring mean-reversion higher.
* **Price action** suggests a potential “V-reversal after sweep” from demand; confirmation is a **daily close above 103,571**.
## Execution Plan (Not financial advice)
* **Entries:** scale in across **92.7k → 90k → 88.7k** (inside demand).
* **Invalidation:** hard stop on **daily close < 88,656**.
* **Take-profit:** partial at **103.6k**, then **110k**, and **116–120k** (primary).
* **Risk:** keep sizing conservative; avoid over-leverage; focus on daily closes, not intraday spikes.
**One-liner:** Expect a sweep into **92.7–88.7k**, then a reclaim of **103.6k** and continuation into **116–120k** unless **88.7k D1 close** fails.
Disclaimer: This analysis is for educational purposes only and reflects personal opinions—not investment, trading, or financial advice. Crypto assets are highly volatile and carry risk of total capital loss. Always do your own research, manage risk carefully, and trade at your own responsibility.

BITCOIN Correction Ahead! Buy!
Hello,Traders!
BITCOIN fell down sharply today, but the price is now hitting the horizontal demand level and we are already seeing some early rejection signs, so as the coin is oversold, a local bullish correction is to be expected. Time Frame 12H.
Buy!
Comment and subscribe to help us grow!
Check out other forecasts below too!
Disclosure: I am part of Trade Nation's Influencer program and receive a monthly fee for using their TradingView charts in my analysis.

BTC at Double Channel Support — Next Impulse Loading?📉 BTC at Double Channel Support — Next Impulse Loading? 🎯
Bitcoin is currently testing a double channel confluence support near $100,211 , a level that’s been both technically and psychologically relevant across the 15m, 1H, and 4H views.
The left pane shows the descending red channel, where price just wicked below support and reclaimed — a signal we’ve seen in prior reversals.
The right pane highlights the broader blue/green support — creating a high-probability reaction zone.
🔹 Technical Support: $100,211
🔹 Local Resistance: $105,161 → $110,596
🔹 Major Target: $122,955 - $138,888 zone
The bullish case strengthens if BTC flips $105,161 on strong volume. But failure to hold $100K opens doors to $97,389 and $96,821 next.
Zooming out: this is a classic inflection zone — the reaction here could define BTC's next multi-thousand move.
🛠️ Smart traders aren't guessing — they’re preparing for both outcomes.
Trading Wisdom 📜
Inflection points > predictions.
In markets, it’s not about being right — it’s about being ready. If this is the bottom, let the chart prove it before the ego jumps in. 🎯
Disclaimer
Disclaimer: I’m just sharing wisdom, not instructions. No licenses, no guarantees — just years of trading scars and precision chartwork. Be smart, protect your capital, and don’t copy blindly. 138k remains my target for the year guys..let's see!
One Love,
The FXPROFESSOR 💙
A lot of people ask how I trade — truth is, it’s pretty simple. I have a daily budget, and I enjoy trading. I’ve moved away from getting married to altcoins, so you’ll notice I post less of them lately. But I still trade every day. I buy dips around key support/resistance levels and exit just below if invalidated. Sometimes it takes more than one attempt, but patience is part of the game. Yes, I use high leverage — that’s my style, and it keeps me engaged. The real secret? Take some profit when it works. That’s it. 💙

Bitcoin Tests $100K Support as Bearish Momentum AcceleratesBitcoin has come under renewed selling pressure, sliding sharply toward the key $100,000 psychological and structural support area. The price has now broken below the 50-day simple moving average (SMA) and is testing the 200-day SMA, signaling a significant test of trend integrity after months of consolidation between $100,000 and $123,000.
The 50-day SMA has turned lower, reflecting weakening medium-term momentum, while the 200-day SMA remains upward-sloping, maintaining the broader bullish framework. A daily close below the $100,000 support would represent a potential shift in long-term sentiment, whereas a rebound from this zone could keep Bitcoin within its established range.
Momentum indicators underscore the recent downside pressure: the MACD remains below its signal line, extending its bearish crossover, and the RSI has slipped to around 35, approaching oversold conditions last seen during earlier correction phases.
Overall, Bitcoin is at a pivotal juncture — the $100K region serves as both a technical and psychological inflection point that may determine whether the broader uptrend can reassert itself or give way to deeper consolidation.
-MW

BITCOIN (BTCUSD): Pullback From Key Support
Bitcoin is currently trading within a wide horizontal range on a daily.
We see a test of its support now.
There is a high chance that the price will bounce from that, following
a formation of a confirmed bullish imbalance candle.
Goal - 105170
❤️Please, support my work with like, thank you!❤️
I am part of Trade Nation's Influencer program and receive a monthly fee for using their TradingView charts in my analysis.

BITCOIN and stocks, 2021 vs 2025...Bitcoin (BTCUSD) could be entering a new Bear Cycle and as we've mentioned a few times recently, the 1W MA50 (blue trend-line) will play a big part at deciding that. This is basically the level that BTC is testing right now.
What may seem surprising to some, is that while Bitcoin has been correcting, the stock market (S&P500 illustrated by the black trend-line) has been rising making All Time High (ATH) after All Time High. This is not uncommon towards the end of Bull Cycles and has been particularly relevant during the Top of the previous (2021) Cycle.
As you can see, Bitcoin topped 7 weeks before stocks did, as we witnessed heavy profit taking and rotation of those (extraordinary) crypto gains towards stocks. Even the 1W RSI Lower Highs structure is similar between 2021 and 2025. The 4-year Cycle Theory in full confirmation (so far).
If the pattern plays out the exact same way time-wise as in 2021 (often it doesn't), we should be expecting stocks to top around the week of November 24. As for Bitcoin's trend after, following the 2022 blueprint wouldn't be unreasonable at all, as a 1W candle closing below the 1W MA50 would open the way to a 1W MA100 (green trend-line) test, multiple months of ranged price action between the two and then violent crash towards the 1M MA100 (red trend-line).
So do you think Bitcoin has topped and if yes, are stocks about to follow soon? Feel free to let us know in the comments section below!
-------------------------------------------------------------------------------
** Please LIKE 👍, FOLLOW ✅, SHARE 🙌 and COMMENT ✍ if you enjoy this idea! Also share your ideas and charts in the comments section below! This is best way to keep it relevant, support us, keep the content here free and allow the idea to reach as many people as possible. **
-------------------------------------------------------------------------------
💸💸💸💸💸💸
👇 👇 👇 👇 👇 👇

BTCUSD Long: Buyers Defend Demand Zone, Targeting $110,400 MoveHello traders! Bitcoin (BTCUSD) is currently trading within a key structural zone, showing signs of balance between demand and supply after a volatile move. Following the previous sell-off from the $116,000 Supply Area, the price found strong buying pressure near the $106,500 Demand Zone, which coincides with the ascending Demand Line that has been acting as dynamic support for several weeks.
After multiple rejections from the Supply Line, BTC has recently formed a fresh pivot low at the Demand Line — an area that has historically triggered bullish reactions. This reaction zone is particularly significant because it aligns with a confluence of horizontal and diagonal support, increasing the probability of a bounce scenario.
In the short term, I’m watching for a potential bullish rebound from the $106,500–$107,000 zone. A confirmed bounce with strong bullish candles could trigger a move toward the next pivot resistance around $110,400, which sits near the descending Supply Line. This would be the first major target for any short-term long positions.However, if buyers fail to sustain above the Demand Line, a breakdown below $106,000 would invalidate the bullish setup and potentially open the path for a deeper correction toward the next support levels. For now, the most probable scenario suggests a technical rebound toward $110,400, as long as the Demand Line continues to hold. I’ll be watching for confirmation signals such as higher lows or bullish breakouts to enter a long position. Manage your risk!

Bitcoin’s price is at one of its most critical moments yet!👋🏻 Hey everyone! Hope you’re doing great! Welcome to SatoshiFrame channel.
✨ Today we’re diving into the 4-Hour Bitcoin analysis. Stay tuned and follow along!
👀 On the 1-hour timeframe of Bitcoin, we can observe that after failing to break above its key resistance zone, BTC moved toward the multi-timeframe lows. Losing those lows created a selling pressure, pushing the price to retest its fundamental support levels. Currently, I’ve identified two critical zones in my analysis — a breakout from either one could provide a solid trading opportunity.
⌛ Bitcoin’s volume shows a strong bias toward sell positions, to the point where buyers are barely preventing the higher timeframes from entering oversold conditions. However, if this selling pressure and volume persist, Bitcoin could break the lower boundary of its recent daily range and continue downward. Volume data gives us the best insight into market behavior, allowing us to build effective scenarios.
✍️ There are two potential scenarios for Bitcoin that I’ll briefly summarize below — both can be used as setups for positioning.
🟢 Long Scenario: If Bitcoin breaks above the resistance zone at $108,072, completes a pullback, and shows an increase in buying volume with momentum entering the market, we can open a long position. This setup looks somewhat risky, so it’s better to enter with a smaller position size. The best trigger for a long entry is located around $111,180.
🔴 Short Scenario: If Bitcoin breaks below the key support level at $105,732, it could offer a short position setup — provided that selling pressure and bearish momentum continue. After the breakdown, we’ll need to wait for a pullback before entering the trade.
❤️ Disclaimer : This analysis is purely based on my personal opinion and I only trade if the stated triggers are activated .

BITCOIN SIGNAL: BIGGEST MOVE YET TO COME!!!? (scary)Yello Paradisers, enjoy the video!
And Paradisers! Keep in mind to trade only with a proper professional trading strategy. Wait for confirmations. Play with tactics. This is the only way you can be long-term profitable.
Remember, don’t trade without confirmations. Wait for them before creating a trade. Be disciplined, patient, and emotionally controlled. Only trade the highest probability setups with the greatest risk to reward ratio. This will ensure that you become a long-term profitable professional trader.
Don't be a gambler. Don't try to get rich quick. Make sure that your trading is professionally based on proper strategies and trade tactics.

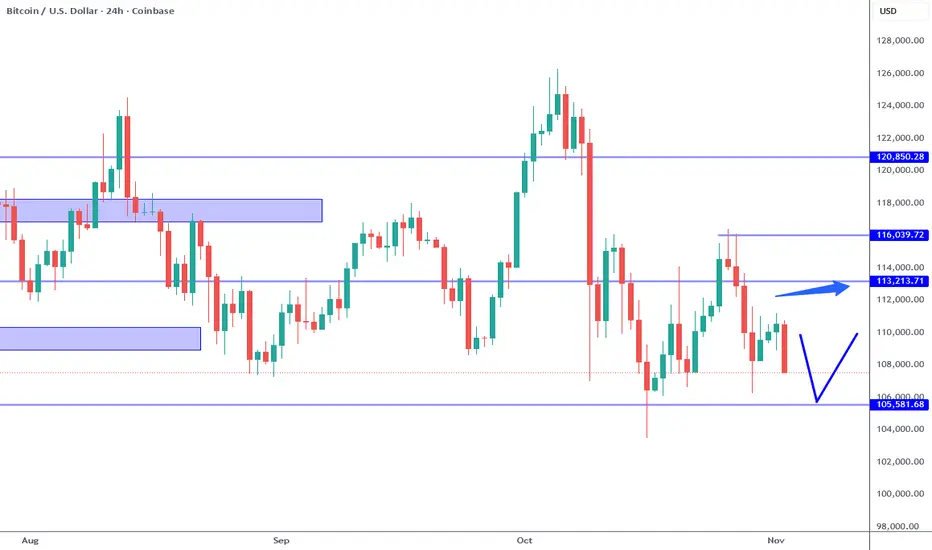
Bitcoin: Watch 105K For Bullish Reversal Again.Bitcoin all over the map. Pay attention to the nearest support and resistance levels which are 113K resistance and 105K support. 109K a minor support has been broken again. There is no way to know which way this market will break on the short term. The general trend is still bullish, BUT resistance levels like 113K and 118K AREA have yet to break.
Smaller time frame momentum is arguably bearish which is good for day trade strategies, otherwise there is not much to do on the swing trade time frame at current prices. A test of the 105K support is likely to follow this week, which can present an attractive swing trade long opportunity (upon confirmation). IF 105K breaks, the next area to watch is the 103L to 100K area for a bullish reversal. This location is also a major psychological level which is also attractive for investing.
Also worth mentioning, there is a head and shoulders formation on this chart, and while it implies bearish possibilities, I would put more emphasis on the levels because these patterns can easily appear randomly. Support and resistance levels, which can also be random, are more relevant in my opinion because of previous trader/investor behavior (or being stuck in a position). Either way do not jump to conclusions or grasp at the obvious. Notate levels, then wait for price to react there and provide a way to measure risk.
Another important note is the CHANGE in Chairman Powell's rate cutting intent during the FOMC press conference over the previous week. When asked about the December rate decision, he explained that is was NOT a sure thing. Based on previous comments and hints, the market seemed to have priced in a December rate cut. Since this comment, the market has cooled off a bit from the constant new all time high every day party. Just goes to show, all it takes is a just few unexpected words to change sentiment. There is NO way to see something like this coming on a chart.
This along with the lack of government data can invite unexpected surprises bullish or bearish. This is why in a game of incomplete information, it is best to focus on RISK, not obsess over forecasts.
Has Bitcoin already priced in its next move ? | Day 56☃️ Welcome to the cryptos winter , I hope you’ve started your day well.
⏰ We’re analyzing BTC on the 1-Day timeframe .
👀 Bitcoin on the daily timeframe. After the flash crash it experienced, Bitcoin is almost building a box with a top at $114,559 and a bottom at $106,431, which by breaking these areas, it can get out of this trading range and give us a position.
The noteworthy point in the recent days is the Monday meeting between Trump and the President of China, which can determine the destiny of the market and give it a good direction.
🧮 The RSI oscillator, two key zones have formed for us in the areas of 54.5 and 36, and by the fluctuation limit crossing these areas, the next move of Bitcoin can begin.
🕯 Bitcoin’s volume on the daily timeframe has increased sharply after recording a new all-time high, and this has been a tendency toward increasing selling pressure. In the image, it is completely clear that you can see exactly what happened to the market after the flash crash it experienced.
📈 To take a position with this structural style that we currently have, you can refer to the multi-timeframe analysis of Bitcoin and extract the long and short position triggers, and if Bitcoin gives you an entry, enter the position around the anticipated top or bottom with low risk so that later you can add more volume to your position at higher or lower levels.
❤️ Disclaimer : This analysis is purely based on my personal opinion and I only trade if the stated triggers are activated .

Has Bitcoin entered the distribution phase yet?👋🏻 Hey everyone! Hope you’re doing great! Welcome to SatoshiFrame channel.
✨ Today we’re diving into the 4-Hour Bitcoin analysis. Stay tuned and follow along!
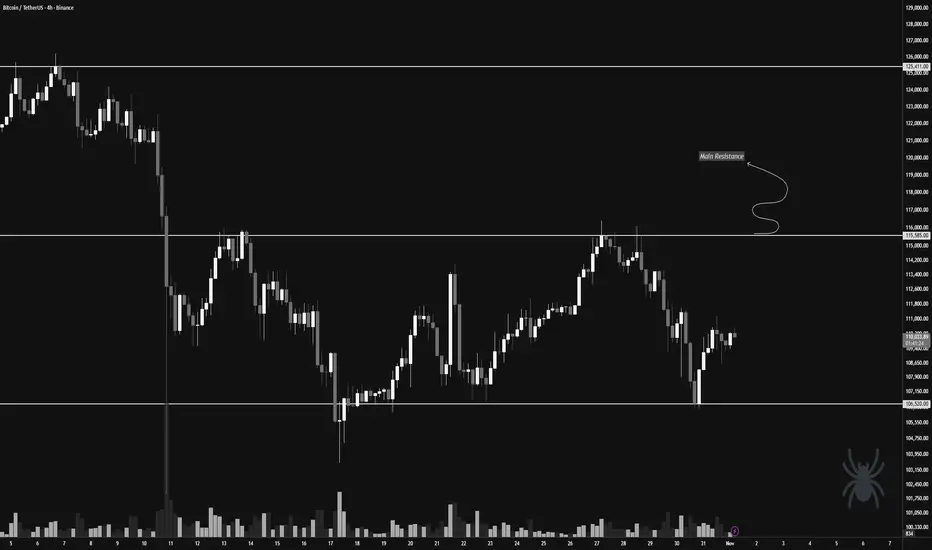
👀 On the 4-hour timeframe, we can see that Bitcoin recently dropped due to the impact of the FOMC news but then rebounded from the key support level at $106,520 and is now facing its multi-timeframe resistances. Looking at the chart more broadly, we notice equal highs and lows around the $115,585 and $106,520 zones. With a breakout of either of these levels, Bitcoin could experience a sharp and significant move.
🧲 Bitcoin’s selling volume has slightly increased, and if the supports break, this selling could turn into pressure — collectively applying downward force on the market price. Then, buyers may re-enter and start buying Bitcoin again. The hypothesis of a possible distribution phase could turn into a valid theory; however, we must be cautious — if Bitcoin decides to move upward after Monday’s session, it could confirm a new all-time high and continue its upward trend.
✍️ The main scenario for Bitcoin lies around the $115,585 price zone. If this level breaks, we could enter a long position and stay with it for a potentially extended upward move. It’s worth noting that an increase in buying volume along this path could serve as a strong confirmation for our long position.
On the other hand, the short position scenario would become valid if the price breaks below the support and selling pressure intensifies, giving us a high-momentum short setup.
❤️ Disclaimer : This analysis is purely based on my personal opinion and I only trade if the stated triggers are activated .
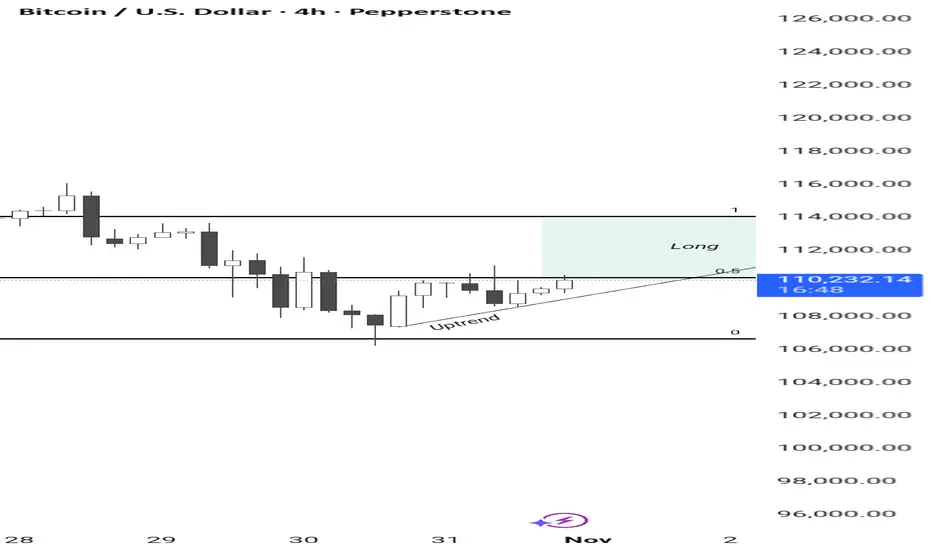
Bitcoin Bitcoin rejected the price at the support level of 107000, now in an uptrend at the 0.5 Fibonacci level, favoring a continuation of the long movement to the resistance at 114000.
BITCOIN SIGNAL: HERE IS THE NEXT MOVE!!!! (damn)Yello Paradisers! Enjoy the video!
And Paradisers! Keep in mind to trade only with a proper professional trading strategy. Wait for confirmations. Play with tactics. This is the only way you can be long-term profitable.
Remember, don’t trade without confirmations. Wait for them before creating a trade. Be disciplined, patient, and emotionally controlled. Only trade the highest probability setups with the greatest risk to reward ratio. This will ensure that you become a long-term profitable professional trader.
Don't be a gambler. Don't try to get rich quick. Make sure that your trading is professionally based on proper strategies and trade tactics.

BITCOIN Has this huge Bearish Divergence started the Bear Cycle?Bitcoin (BTCUSD) continues to be under heavy pressure in the past 4 weeks since the October 06 All Time High (ATH) and finds itself battling to hold the 1W MA50 (blue trend-line) as Support. That trend-line has been basically the Support of this Bull Cycle since March 2023, and acted as the most optimal long-term buy level.
** Has the Bull Cycle ended? **
However this Bull Cycle may have very well come to an end already as the 1W RSI has been long exhibiting the same kind of bearish pattern (Lower Highs trend-line), while also having completed the 4-year Cycle, that all previous Bull Cycles formed on their respective tops. This is a huge Bearish Divergence formation as it goes against the price's Higher Highs, indicating trend exhaustion.
As you can see that 1 RSI Lower Highs trend-line formed the November 2021, December 2017 and December 2013 Cycle Tops. Even worse, the current Lower Highs trend-line has been going on since the March 11 2024 High. If BTC closes a 1W candle below its 1W MA50, it has greater probabilities to confirm the start of the new Bear Cycle as all previous ones did on such break-out.
** If yes, how much can it drop? **
Now, it might not be too relevant at this time yet, but as far as how low the Bear Cycle can go to before it bottoms, there are three potential levels of interest where long-term investors can Dollar Cost Average (DCA).
The January 2015 Bear Cycle bottom was formed on the 1W MA200 (orange trend-line). Then the December 2018 Bear Cycle bottom was formed on the 1W MA200 and the 0.382 Fibonacci retracement level from the previous bottom. The last Bear Cycle has its bottom below the 1W MA200 and on the next Fib in line, the 0.5 level. The decline on each Bear Cycle that followed decelerated and was less than the previous (-86.70% to -84.19% to -77.22%).
If the new Bear Cycle has already started then the first level for a potential bottom is again the 0.382 Fib around $58000 where contact may potentially be made with the 1W MA200 as well. If it follows the previous Bear Cycle and bottoms on the 0.5 Fib, it will also be below the 1W MA200 around $45000. If on the other hand it goes a Fib level further, as the last two Cycles did, we are looking at the 0.618 Fib as a potential strong bottom candidate around $35000. That will also be a -70.76% decline from the Top, which will be -7% less than the previous Bear Cycle, which is also the difference that the 2022 Bear Cycle had from the 2018 one.
So what do you think? Has the Bull Cycle ended already and if yes, how low can the new Bear Cycle go? Feel free to let us know in the comments section below!
-------------------------------------------------------------------------------
** Please LIKE 👍, FOLLOW ✅, SHARE 🙌 and COMMENT ✍ if you enjoy this idea! Also share your ideas and charts in the comments section below! This is best way to keep it relevant, support us, keep the content here free and allow the idea to reach as many people as possible. **
-------------------------------------------------------------------------------
💸💸💸💸💸💸
👇 👇 👇 👇 👇 👇

Bitcoin strong, Dominance weak.Bitcoin maintained its strength above the major uptrend and support zone, while BTC Dominance broke below the major uptrend and also received confirmation of a retest of the major resistance and major uptrend for the downside.
For altcoins, this is a trend towards the beginning of a new momentum.

BITCOIN SIGNAL: SECRET PATTERN ABOUT TO BREAKOUT (massive)!!!!!!Yello Paradisers! Enjoy the video!
And Paradisers! Keep in mind to trade only with a proper professional trading strategy. Wait for confirmations. Play with tactics. This is the only way you can be long-term profitable.
Remember, don’t trade without confirmations. Wait for them before creating a trade. Be disciplined, patient, and emotionally controlled. Only trade the highest probability setups with the greatest risk to reward ratio. This will ensure that you become a long-term profitable professional trader.
Don't be a gambler. Don't try to get rich quick. Make sure that your trading is professionally based on proper strategies and trade tactics .

BTCUSD — Mind Games at the Range Low Pre Ny Session
🧭 Context
Bitcoin is testing the range low at 112.885, holding just above despite multiple wicks below.
Price hasn’t closed beneath structure — and until the 4H confirms, it’s still a game of perception, not breakdown.
Don’t mistake volatility for intent.
Price can sweep liquidity behind higher-timeframe wicks without flipping bias.
As long as the 4H structure holds, the map remains bullish within the 112.885–116.077 range.
🔹Technical Frame
Range intact: 112.885–116.077
4H close below 112.800 = structural shift
Volume stable, delta neutral — no confirmation of breakdown
Possible liquidity sweep event around macro news
Focus zone: 113.200–114.000 for reactive setups
💡Macro Note
With today’s data on deck, short-term volatility spikes are expected.
Let the reaction confirm direction — not emotion.
This phase is designed to shake conviction, not reward it.
Institutional Logic. Modern Technology. Real Freedom.

No Rise in Sight — 107K Might Be RightAt the moment, I don’t see any technical reasons for Bitcoin to continue its rally.
For now, I’d like to see Bitcoin move down toward the 107K area or even lower.
The invalidation level of this scenario is marked in red on the chart

Bitcoin Breakout or a Deeper Rest Ahead ?👋🏻 Hey everyone! Hope you’re doing great! Welcome to SatoshiFrame channel.
✨ Today we’re diving into the 4-Hour Bitcoin analysis. Stay tuned and follow along!
👀 We’re looking at Bitcoin on the 4-hour timeframe. Bitcoin is currently in a bullish correction and awaiting tomorrow’s news. It’s worth noting that this upward correction is happening below the key resistance level at $115,555. A breakout above this zone could allow Bitcoin to continue the bullish leg it has already started.
🧮 Looking at the RSI oscillator, Bitcoin’s momentum previously entered the overbought area but has now exited and is oscillating below the 70 zone, which now acts as the current resistance level.
✔️ Let’s pay closer attention to Bitcoin’s trading volume — as price approached its major resistance, volume increased. However, given the upcoming news, this wasn’t enough to break resistance, and Bitcoin was rejected from that zone, pulling slightly downward. This downward move isn’t very strong and is accompanied by weak corrective momentum.
✍️ The current Bitcoin scenarios have been updated — you can now focus more closely on these scenarios in the next part of the analysis.
🟢 Long position scenario: A breakout above the key resistance level at $115,555, combined with rising buy volume and an RSI swing above the 70 zone, could mark the end of the correction and continuation of the bullish move.
❤️ Disclaimer : This analysis is purely based on my personal opinion and I only trade if the stated triggers are activated .

BITCOIN CLEAR REJECTION|SHORT|
✅BTCUSD made a liquidity grab above the previous high, price sharply rejected from the 4H supply area, confirming a fakeout and shift in order flow. The market structure suggests redistribution, with inefficiency below acting as the draw on liquidity. Expect short-term delivery toward $114,000. Time Frame 4H.
SHORT🔥
✅Like and subscribe to never miss a new idea!✅
