Bitcoin Daily Analysis – The Trend Is Our FriendGood morning, Guys,
I’ve prepared a fresh Bitcoin analysis for you.
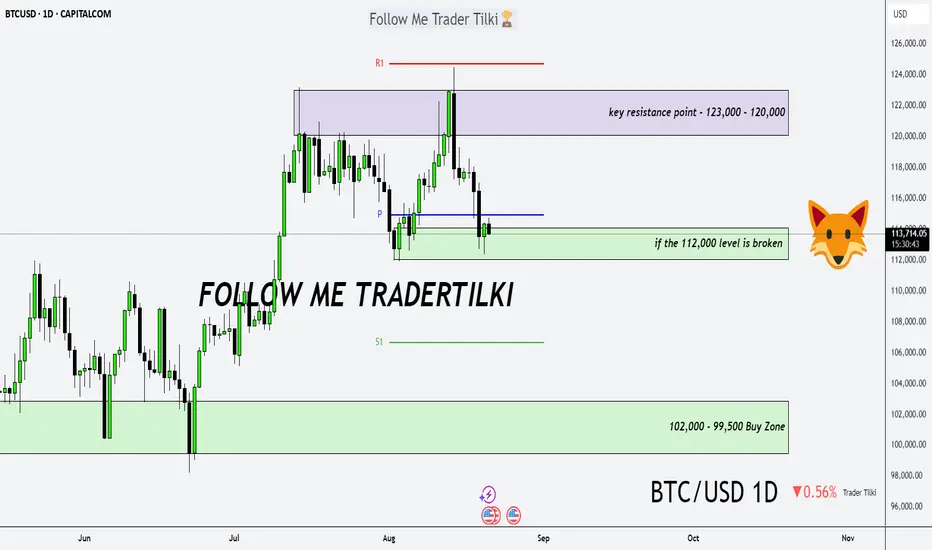
🔹 First off, I stand firmly behind my long-term targets of **127,000 – 137,000 – 146,000**. I previously shared these levels with you in a weekly analysis.
🔍 Now let’s shift to the 1-day chart:
What is Bitcoin telling us right now?
📉 If the **112,000 level breaks downward**, we could enter a correction phase toward **102,000** or even **99,500**. I expect strong buying interest to return from those zones.
📈 After that, we’re facing a key resistance structure between **123,000 – 120,000**.
But I believe this zone will also be broken—because we’re in an **uptrend**, and…
💬 **The trend is our friend. Never forget that.**
BITCOIN-SMC
Bitcoin - Power of 3 in play!The chart illustrates a classic application of the ICT concept known as the "Power of 3," a theory that outlines a common market behavior pattern consisting of three phases: consolidation, manipulation, and distribution. This model is often used by smart money traders to identify points where institutional players may be accumulating or offloading positions, typically by targeting retail liquidity.
Consolidation
In this scenario, Bitcoin has exhibited a prolonged period of consolidation, where price fluctuated within a defined range throughout most of June and into early July. This range-bound movement, highlighted in blue, represents the market gathering orders from both buyers and sellers, creating a liquidity pool on either side of the range. During this phase, market participants become uncertain about the next direction, while smart money positions itself for the next move.
Manipulation/sweeping liquidity
Recently, Bitcoin has broken out of this consolidation range in an upward move, which is now being interpreted as the manipulation phase. This move served to sweep the liquidity resting just above the established highs of the range. These highs were prime areas for stop-losses of short sellers and breakout entries of longs, making them attractive targets for institutional manipulation. The price push above this level, marked in green, appears to be a false breakout designed to trap breakout traders and trigger stops before a likely reversal.
Possible distribution phase
Following this manipulation phase, the chart suggests we are entering or have just begun the distribution phase, marked in red. Distribution in the context of the Power of 3 refers to the process where smart money offloads their positions onto unsuspecting buyers who entered during the manipulation. The anticipated outcome is a sustained move to the downside, aligning with the forecasted bearish structure shown on the right side of the chart.
Conclusion
In conclusion, the chart reflects a textbook ICT Power of 3 pattern in play on Bitcoin. After a lengthy period of sideways consolidation that built liquidity on both sides, Bitcoin executed an upward manipulation to capture liquidity above the range. Now, with the highs swept and buy-side liquidity taken, the market looks poised for distribution, signaling a probable downward move in the near term. Traders familiar with smart money concepts would view this as a high-probability reversal zone.
Disclosure: I am part of Trade Nation's Influencer program and receive a monthly fee for using their TradingView charts in my analysis.
Thanks for your support.
- Make sure to follow me so you don't miss out on the next analysis!
- Drop a like and leave a comment!

BTCUSDT Fresh Short Setup: Targeting Key Support Zones with SMC Description:
This trade setup presents a Bitcoin short opportunity on the 4H timeframe using the Smart Money Concepts (SMC) framework. After a significant reaction from the supply zone, Bitcoin's price structure aligns with bearish confluences, signaling potential downside. Additionally, external events, such as the recent announcement of China's AI application "DeepSeek," may have amplified market volatility, further supporting the setup.
Trade Setup:
Entry:
Between 103,300 and 104,500
Take-Profit Levels (TP):
101,897
99,825
97,565
95,208
Stop Loss (SL):
Above 105,975
Analysis and Confluences:
Market Structure:
Bitcoin remains in a bearish trend on the 4H timeframe, with consistent lower highs and lower lows.
Supply Zone:
The price is entering the 103.3k–104.5k supply zone, a key resistance area where sellers are expected to dominate.
Fibonacci Confluence:
This zone overlaps with the 0.618–0.786 Fibonacci retracement levels, a high-probability reversal area.
Liquidity Sweeps:
Liquidity above previous highs has been swept, leaving the path clear for potential downside.
Bearish Targets:
The targets align with previous demand zones and liquidity pools at 101,897, 99,825, 97,565, and 95,208.
Trade Plan:
Confirmation: Wait for bearish price action signals or smaller timeframe BOS (Break of Structure) within the supply zone before entering.
Risk Management: Adjust position size to keep risk within acceptable levels. After reaching TP1, move your stop loss to breakeven and secure partial profits.
Final Note: While bearish bias dominates, unexpected macroeconomic events can cause reversals, so use tight risk management.

What do you know about Bitcoin?Dea Gents,
Agrresive bearish displacement portraying potential Draw On Liquidity to the breaker block with confluence :
1) BB
2) DOL
3) BISI
4) PD Array
Let me know your thoughts, and good day to you all.

BTC LONG FOR SUNDAY/MONDAYBTC marked Market Structure Break after touching the imbalance, below last long price wicks, that's a bullish sign. I try to look for long trades, these are my spots.
Entry 1 (RR 1:4.5) : Filling/touching multiple timeframes imbalances.
Entry 2 (RR 1:10.8): Touching order block and grabing some liq down there
SL: below actual low, but becouse there is imbalance i prefer not to rush with deposit
TP min: 70 715$
TP main: new ATH :)

A Look at the Potential Trade of Bitcoin This WeekPotential move DOWN to the DEMAND zone starting tomorrow (Sunday, Dec 18) followed by a 5-move up to the SUPPLY zone.

[SMC] Bitcoin Simple Liquidity Trading ConceptThe following is NFA and risk trading at your own will. Please share your comments or questions regarding the analysis,

The Future of Bitcoin?! - 11th May 2022 - Smart Money AnalysisHere is a smart money technical analysis breakdown for BTC. What does the future hold?

BTC TestimonyWell if you followed my last trade and you didn't get stopped out or you re entered the trade after the stop, then that's like a 135% on a 10x leverage. Congrats to those who took it.
I got stopped out too though. Just few pips away from the reversal.. We go again..
135% today... Let's work towards a 3000%

10 Minute Bitcoin SMC Analysis (10th January 2022)10 Minute Bitcoin SMC Analysis (10th January 2022)
This is just a quick 10 min video of what we can see now on Bitcoin coming into the next few weeks/months and in 2022

BTC Possible Long Trade IdeaLike if you agree with my idea, comment for your thoughts or questions in the comments section below. I appreciate you guys

BTC SHORT w8ing for break of stracture and confirmation, short trade maybe few hour, till open of rest
