Has Bitcoin already priced in its next move ? | Day 56☃️ Welcome to the cryptos winter , I hope you’ve started your day well.
⏰ We’re analyzing BTC on the 1-Day timeframe .
👀 Bitcoin on the daily timeframe. After the flash crash it experienced, Bitcoin is almost building a box with a top at $114,559 and a bottom at $106,431, which by breaking these areas, it can get out of this trading range and give us a position.
The noteworthy point in the recent days is the Monday meeting between Trump and the President of China, which can determine the destiny of the market and give it a good direction.
🧮 The RSI oscillator, two key zones have formed for us in the areas of 54.5 and 36, and by the fluctuation limit crossing these areas, the next move of Bitcoin can begin.
🕯 Bitcoin’s volume on the daily timeframe has increased sharply after recording a new all-time high, and this has been a tendency toward increasing selling pressure. In the image, it is completely clear that you can see exactly what happened to the market after the flash crash it experienced.
📈 To take a position with this structural style that we currently have, you can refer to the multi-timeframe analysis of Bitcoin and extract the long and short position triggers, and if Bitcoin gives you an entry, enter the position around the anticipated top or bottom with low risk so that later you can add more volume to your position at higher or lower levels.
❤️ Disclaimer : This analysis is purely based on my personal opinion and I only trade if the stated triggers are activated .
Bitcoin (Cryptocurrency)

BTC Retracement Setup After Liquidity Sweep at Key Resistance📊 Bitcoin 4H Analysis – Bullish Momentum Meets Key Liquidity Zone
Bitcoin continues to trade within a strong bullish trend on the 4-hour timeframe. Price has now tapped into a major resistance zone — the liquidity sitting above a previous external range high. This reaction suggests we may see a corrective move before the next leg higher. 🔁💡
I’ll be waiting for price to retrace back into equilibrium of the current bullish price swing, where premium turns to discount, to look for a high-probability long setup. ✅🎯
⚠️ Not financial advice — for educational purposes only.

Has Bitcoin entered the distribution phase yet?👋🏻 Hey everyone! Hope you’re doing great! Welcome to SatoshiFrame channel.
✨ Today we’re diving into the 4-Hour Bitcoin analysis. Stay tuned and follow along!
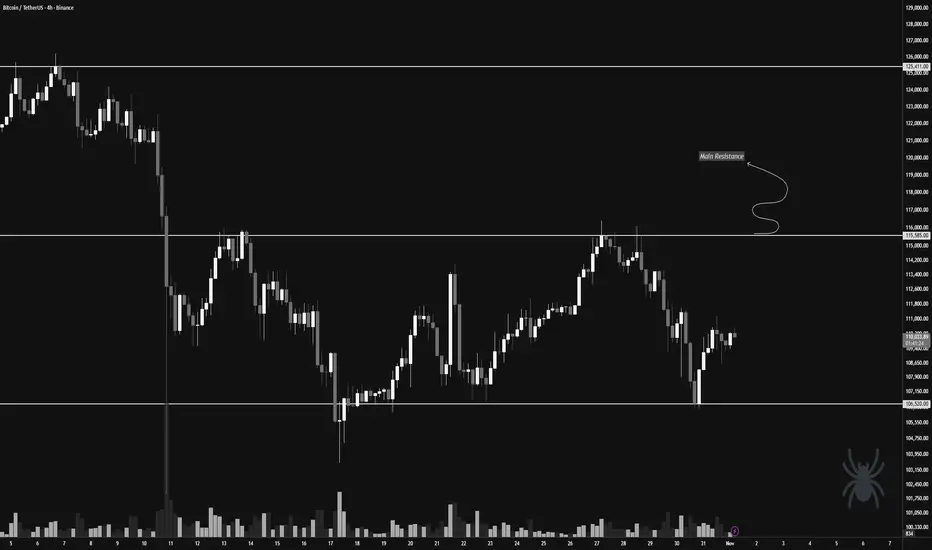
👀 On the 4-hour timeframe, we can see that Bitcoin recently dropped due to the impact of the FOMC news but then rebounded from the key support level at $106,520 and is now facing its multi-timeframe resistances. Looking at the chart more broadly, we notice equal highs and lows around the $115,585 and $106,520 zones. With a breakout of either of these levels, Bitcoin could experience a sharp and significant move.
🧲 Bitcoin’s selling volume has slightly increased, and if the supports break, this selling could turn into pressure — collectively applying downward force on the market price. Then, buyers may re-enter and start buying Bitcoin again. The hypothesis of a possible distribution phase could turn into a valid theory; however, we must be cautious — if Bitcoin decides to move upward after Monday’s session, it could confirm a new all-time high and continue its upward trend.
✍️ The main scenario for Bitcoin lies around the $115,585 price zone. If this level breaks, we could enter a long position and stay with it for a potentially extended upward move. It’s worth noting that an increase in buying volume along this path could serve as a strong confirmation for our long position.
On the other hand, the short position scenario would become valid if the price breaks below the support and selling pressure intensifies, giving us a high-momentum short setup.
❤️ Disclaimer : This analysis is purely based on my personal opinion and I only trade if the stated triggers are activated .
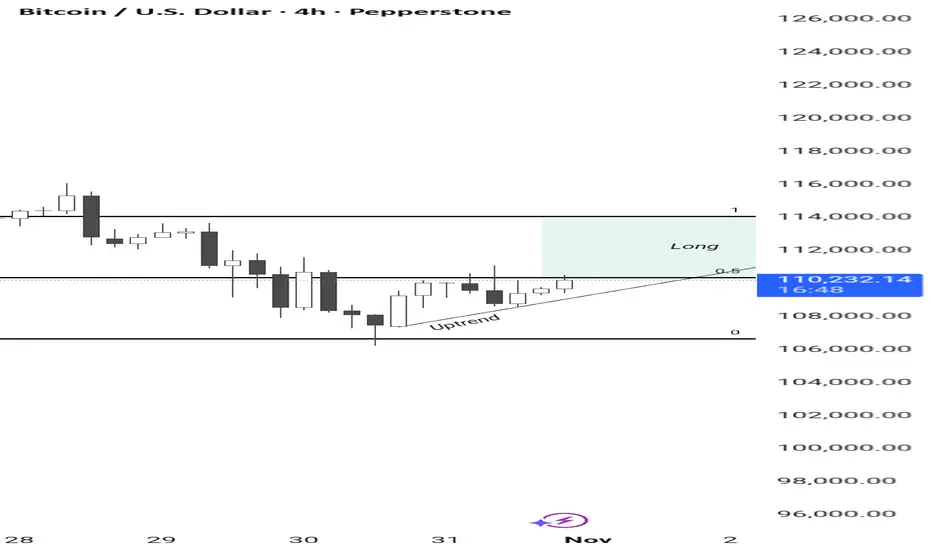
Bitcoin Bitcoin rejected the price at the support level of 107000, now in an uptrend at the 0.5 Fibonacci level, favoring a continuation of the long movement to the resistance at 114000.
Bigly's Bangers vs. BitcoinJoecoin * ZCASH / Bitcoin
Get in now!
Memecoins+ Privacy will outperform the King in 2025

Bitcoin Weekend Volume Could Exceed 116K as Smart Money Accumula📊 Market Update
Bitcoin has been building strength since the 106K–107K level, showing signs of a new uptrend. Both the lower time frames and the main trend are currently positive. There’s a strong possibility that BTC will target 112K as the first level, with 116K+ also possible depending on the weekend trading volume.
🔹 Market Structure
The market structure is gradually building, suggesting smart money inflows into BTC over the last 10 hours. We’ll continue tracking this development closely further

My expectations for November and December.According to my possible wave counts the first week of November may be a sell-off, then the direction may be upwards, and declines may occur with the Christmas holiday.
Note: It's shown on a 1-hour chart, but waves will form over longer timeframes. So, disregard the date chart you see at the bottom of the page.
* The purpose of my graphic drawings is purely educational.
* What i write here is not an investment advice. Please do your own research before investing in any asset.
* Never take my personal opinions as investment advice, you may lose your money.

BTC/USDT | Bitcoin Bounces Back — Bulls Eyeing $112K Next!By analyzing the #BTC chart on the 12-hour timeframe, we can see that after a healthy correction down to $106,350, Bitcoin has regained its footing and is once again trading near the $110,000 zone. This recovery shows that buyers are still stepping in aggressively to defend key supports and maintain bullish momentum.
As long as BTC stays above $108,600, the bullish outlook remains valid. The next upside target sits around $112,000, where we might see some short-term reaction before another potential correction — likely a setup before the next major bullish wave.

Did you Know ?!!!Did you really think that profiting from the current bull run (a comprehensive upward market) would be easy? Don't be naive. Do you think they will let you buy, hold, and sell at low levels without any struggle? If it were that simple, everyone would be rich. But the truth is: 90% of you will lose. Why? Because the crypto market is not designed for everyone to win. They will shake you. They will make you doubt everything. They will panic you and sell at the worst possible moment. Do you know what happens next? The best players in this game buy when there is fear, not sell; because your panic gives them cheap assets. This is how the game goes: strong hands feed off weak hands. They exaggerate every dip, every correction, every sale. They make it look like the end of the world so that you abandon everything, and when the market starts up again, you'll sit there saying, "What the heck just happened?" This is not an accident. It's a system. The market rewards patience and punishes weak emotions. The big players already know your thoughts. They know exactly when and how to stir fear to make you give up. Because when you panic, they profit. They don't play the market. They play you. That's why most people never succeed. Because they fall into the same traps over and over again. People don't realize that dips, FUD (fear, uncertainty, doubt), and panic are all part of the plan. But the winners? They digest the noise. They know that fear is temporary, but smart decisions last forever. We've seen this hundreds of times. They pump the market after you sell. They take your assets, hold them, and sell them to you at the top, leaving you with nothing, wondering how it happened. Don't play their game. Play your own.
REMEMBER

HYPEUSDT – Watching a Key Support Zone for Long SetupHYPEUSDT is currently pulling back and heading toward a major support area at $42–$43. This zone has historically provided strong buying interest and could act as a platform for a reversal. We’re closely watching this level for a potential long swing trade opportunity.
🛠 Trade Setup
Entry Zone: $42 – $43 (Support Area)
Take Profit Levels:
• TP1: $53
• TP2: $59
Stop Loss: $38 (Just below structure)

ETH/USDT | Ethereum Rebounds Strongly – Eyes on $5K Next!By analyzing the #Ethereum chart on the weekly timeframe, we can see that after our previous analysis, price continued to rise and reached as high as $4,200. It is currently trading around $3,800, and if it can hold above this level, we could expect further upside movement.
The next potential bullish targets are $4,300, $4,500, $5,000, and $5,500.
Please support me with your likes and comments to motivate me to share more analysis with you and share your opinion about the possible trend of this chart with me !
Best Regards , Arman Shaban

BITCOIN SIGNAL: HERE IS THE NEXT MOVE!!!! (damn)Yello Paradisers! Enjoy the video!
And Paradisers! Keep in mind to trade only with a proper professional trading strategy. Wait for confirmations. Play with tactics. This is the only way you can be long-term profitable.
Remember, don’t trade without confirmations. Wait for them before creating a trade. Be disciplined, patient, and emotionally controlled. Only trade the highest probability setups with the greatest risk to reward ratio. This will ensure that you become a long-term profitable professional trader.
Don't be a gambler. Don't try to get rich quick. Make sure that your trading is professionally based on proper strategies and trade tactics.

BTCUSDT.P - October 31, 2025BTCUSDT.P on the 15-minute chart shows a short-term bullish reversal after forming higher lows following a prior downtrend. Price has broken above minor resistance and is now retesting it as potential support, indicating possible continuation toward the 111.3K zone. Momentum and structure favor the upside, but given intraday volatility and proximity to the recent swing low, it’s a medium-risk setup.
Note: If price reaches 111,313.6 or the immediate resistance before retracing to the buy limit area, consider the trade invalid.

BITCOIN BULLS WILL DOMINATE THE MARKET|LONG
BITCOIN SIGNAL
Trade Direction: long
Entry Level: 106,482.62
Target Level: 113,901.05
Stop Loss: 101,549.96
RISK PROFILE
Risk level: medium
Suggested risk: 1%
Timeframe: 1D
Disclosure: I am part of Trade Nation's Influencer program and receive a monthly fee for using their TradingView charts in my analysis.
✅LIKE AND COMMENT MY IDEAS✅

BITCOIN RALLY STARTEDI believe now after bitcoin re-tested the trendline which is a great support, the rally for November & December is on the way

BTCUSDT — Full Report (Oct 31, 2025 09:30 UTC)1. Macro and Fundamental Facts
- US Fed (Oct 30): Rate cut by 25 bps to 3.75–4.00%. This policy easing supports risk assets.
- Quantitative Tightening: From Dec 1 the balance sheet runoff stops; the Fed will reinvest, increasing dollar liquidity.
- US GDP Q3 (preliminary): +3.1% QoQ, confirming a soft landing.
- PCE Inflation (Oct 31, 12:30 UTC): Expected moderate growth; may cause short-term volatility.
- BTC ETFs (US): Mixed flows; after mid-month outflows, moderate inflows observed (Farside). Institutional demand remains stable.
2. Market Statistics (CoinGecko, weekly)
- 7-day range: $108,604–$115,957
- Today's 24h range: $108,201–$113,567
- Mid-point: $112,280
- Range / mid ≈ 6.55%
- October ATH: $126,080 (Oct 6)
- Market has stabilized after the early-October peak around 125‑126k.
3. Sentiment & Forecasts
- Fear & Greed Index: 37 (Fear) → cautious mood.
- Polymarket probabilities for 2025: ≥$130k ≈53%, ≥$150k ≈15%, ≤$80k ≈10%; market volume ≈$38M.
- Social tone: discussion of Fed easing and a possible retest of the ATH.
4. Key Levels This Week
- Support S1: $108.0–$108.6k (lower bound of the 7-day range)
- Support S2: $106–$107k (October accumulation zones)
- Resistance R1: $113–$116k (upper bound of the 7-day range)
- Resistance R2: $118–$120k (gateway to retest $125k).
5. Microstructure (SSE, Binance BTCUSDT)
Snapshot time: 2025-10-31 08:57:51 UTC (real-time SSE feed; delay ~80 ms).
- Last price (LTP): $110,043.82
- Bid / Ask: $110,043.81 / $110,043.82 → balanced.
- Spread: $0.01 ≈ 0.91 m-bps (ultra tight).
- Bid sum (top-20): 0.46 BTC → thin support below.
- Ask sum (top-20): 11.55 BTC → dense overhead layer.
- Imbalance: −0.923 → seller dominance.
- Orders per second: 46 orders/s → active flow.
- Net flow: +0.58 → orders coming into the market; buyers active.
- Micro-price: $110,043.81 ≈ mid → neutral.
- Health score: 80/100 → good liquidity.
Observation: there is instant dominance in the ask side. Order flow is positive, but for price to rise, the cluster at $110,043–110,045 (~5 BTC) must be absorbed. The book below is thin; a downward spike could drop $30–50 without much resistance.
6. Probability Assessment (1-week horizon)
Model: normal distribution around the mid ($112,280) with σ ≈1.64%.
- Range scenario ($109–$114k): ≈60%
- Upward scenario (> $116k; requires inflows): ≈12%
- Downward scenario (< $108.5k; reaction to inflation or ETF outflows): ≈12%
- Tail events (<$106k or >$120k): ≈4–6% each.
Microstructure indicates ask-side dominance, so a short-term pullback within the range is slightly more likely than an immediate breakout.
7. Practical Observations (no advice)
- Spread <1 m-bps → optimal conditions for limit orders.
- Rise in orders/sec above 50 with imbalance moving toward zero → market ready for an impulse.
- Spread >3 m-bps → decreasing depth and higher liquidity risk premium.
- Monitor FGI and ETF flows: FGI >40 and two days of ETF inflows often coincide with a break out of the range.
- Watch Polymarket: an increase in the ≥$150k probability above 20% signals stronger long-term optimism.
8. TL;DR
- The Fed eased policy (−25 bps; QT stop from Dec 1).
- BTC trades between $108.6k and $116k; mid ≈$112k.
- Sentiment is cautious (Fear 37).
- Microstructure: LTP $110,043.82; spread $0.01; ask dominance (imbalance −0.92); 46 orders/s; net flow +0.58.
- Probabilities for the next week: range 60%, upside 12%, downside 12%, tails 4–6%.
- Conclusion: the market is stable within the range; the macro backdrop is softening. A breakout requires absorption of ask clusters and confirmation from ETF inflows.

Are you ready for a $BTC next leg?Bitcoin is preparing for a new upward wave towards the resistance zone, reacting to the rising wedge-on-uptrend formation.
This structure often signals a decisive moment after recent momentum.
The reaction to the resistance line will determine the next trend direction.
Staying on top of the trend is crucial during this period.

Real Estate vs Gold, Bitcoin, Stock MarketThis chart illustrates relative performance of Real Estate, Stock Market, Gold & Bitcoin through the critical Covid timeline up to recent time

Bitcoin is at key resistanceBitcoin is at key resistance
i`ll take SHORT ONLY in a case of clear trap

BTC Building Momentum — 112K+ Zone ON WAY.Bitcoin has held strong within the recent volume area, showing solid support and renewed buying pressure.
After rebounding from the lower levels near $106K–$108K, BTC is now pushing upward and appears on track toward the first target zone around $112K–$114K.
📈 Market Outlook:
Strong recovery from the volume area confirms short-term buyer control.
Resistance lies between $111.6K and $113.3K, marking the first target zone for this upward move.
Sustained momentum above $109.8K could trigger acceleration toward $114K+ in the next sessions.
📊 Observation:
Volume has started to align with bullish movement — if this continues, BTC could retest upper resistance and possibly extend toward $116K.
However, a pullback below $108.6K would suggest consolidation before another attempt higher.
💬 Summary:
BTC is on its way toward the first target zone above $112K, showing growing strength after reclaiming key volume support. Momentum remains positive as long as price holds above the mid-range.

BTC GOLDEN CYCLE CAN START ANY MOMENT WITH BREAKOUT 112K AFTER..BTC Breakdown Completed — Potential Rebound Toward $112K 🔁
Bitcoin has successfully tested the 106K zone, completing the expected breakdown move.
Price action now shows early signs of stabilization, suggesting that a recovery toward $112K–$113K could follow in the short term.
📊 Market Outlook:
Support was confirmed near $106K, halting further downside pressure.
Short-term resistance sits around $111.6K–$113.5K, the next likely retracement target.
Momentum remains weak but improving — volume shows early buyer re-entry.
📈 Scenario:
If BTC maintains support above $107K, a technical bounce toward the mid-range near $112K becomes likely before facing renewed resistance.
However, failure to sustain current levels could risk a retest of $106K.
💬 Summary:
BTC completed its breakdown to the 106K area and is now forming a possible relief rebound setup targeting $112K–$113K range.
With the same data, we did expect before the breakdown from 115K to 106K zone

BTC 4H ENGLISHBearish divergence forming. We're about to break the previous high. What's next? A pullback continues to rise, as the daily chart holds a bullish pattern. I'm not shorting that trade. I'm waiting for my next bullish entry to complete the daily chart's move.

ETH/USDT: Price Decline Warning, Caution for Buy Opportunities!The ETH/USDT pair is currently facing clear downward pressure after failing to break through the strong resistance at 4,150.00. The 4-hour chart shows that Ethereum is moving in a short-term downtrend, with prices heading towards the important support level of 3,780.00. The strong rejection from this area indicates that the current market sentiment is leaning towards selling.
The market's cash flow also reflects short-term distribution, and the RSI indicator shows that ETH has previously entered overbought territory, and may continue to correct downward. These factors suggest that Ethereum could continue to face selling pressure, especially if the support levels are not strong enough to hold the price.
Impact of Recent News:
1. Australia's Core Inflation Data Rises Sharply: Australia's core inflation index increased by 1.0% in Q3, exceeding the forecast of 0.8%. This reduces expectations of a near-term rate cut and could affect ETH/USDT if the USD strengthens.
2. Expectations on U.S. Federal Reserve's Monetary Policy: The market expects the Fed to maintain high interest rates, which could strengthen the USD and put downward pressure on ETH/USDT.
Conclusion: Given the current downtrend and pressure from technical indicators, ETH/USDT is likely to continue decreasing over the next 48 hours. However, traders need to be cautious and closely monitor the support level at 3,780.00. If the price shows strong signs of recovery from here, it could present a good opportunity to enter the market.
