Bitcoin (BTC/USD) Update: Multiple Scenarios Still in PlayI am providing an update on my Bitcoin analysis as the cryptocurrency navigates a critical phase in its price development. Bitcoin is currently trading at 89,412 USD, and the technical scenarios I previously outlined remain relevant as the market continues to choose its path forward.
Current Market Position:
Since my last analysis, Bitcoin has experienced notable volatility and is currently in a consolidation phase. The price has pulled back from higher levels and is now testing important support zones. This price action is healthy and typical of Bitcoin's cyclical nature, where periods of rapid appreciation are followed by consolidation or correction phases.
The market is at a decision point where the next major move will likely determine the trajectory for the coming months. The technical levels I identified in my previous analysis continue to serve as key reference points for understanding potential future price action.
Scenario One: Direct Path Higher
The first scenario involves Bitcoin finding support at current levels and resuming its upward trajectory. In this path, the cryptocurrency would work its way through the resistance zones around 98,124 and potentially extend toward 111,119. This scenario assumes that current support levels hold firm and that buying interest emerges at these prices.
This more conservative scenario would represent a measured advance where Bitcoin respects key resistance levels and builds a solid foundation at each stage. The consolidation at current levels would serve as an accumulation phase before the next leg higher. If this scenario unfolds, traders can expect a gradual climb with intermittent pullbacks to retest support before continuing upward.
Scenario Two: Deeper Correction Before Major Rally
The second scenario, illustrated with dashed lines on the chart, presents a more volatile path. This alternative suggests that Bitcoin could experience a deeper correction toward the 53,312 level, marked as point C on the chart. Such a move would represent a significant retracement that tests major support structures and likely shakes out leveraged positions and weak holders.
However, this scenario is not bearish in the long-term context. Following this deeper correction, the projection shows a powerful recovery rally that could ultimately reach much higher levels, potentially toward the 150,000+ area indicated by the upward arrow. This path would create a classic shakeout pattern where the market tests resolve before embarking on the next major bull phase.
Key Technical Levels:
Several critical zones have been identified on the chart that will determine which scenario unfolds. The resistance areas around 98,124 and 111,119 represent supply zones from previous price action where sellers have historically emerged. Breaking above these levels with conviction would confirm strength and support the first scenario.
On the support side, the current price area around 89,000 is important for maintaining the bullish structure of the first scenario. Below that, the order blocks marked on the chart represent institutional interest zones. The most significant support in the second scenario sits at 53,312, which aligns with major historical levels and would represent a substantial discount from current prices.
The "BUY LEVEL for ever!!" notation on the left side of the chart highlights a long-term accumulation zone that has historically provided excellent entry points for patient investors. This area represents a floor where strong hands have consistently stepped in to purchase Bitcoin.
What Could Trigger Each Scenario:
Multiple factors could influence which path Bitcoin takes. Macroeconomic conditions, particularly interest rate policies from major central banks, significantly impact risk asset valuations including Bitcoin. Regulatory developments, either positive or negative, can create volatility and influence medium-term direction.
Market sentiment and leverage levels also play crucial roles. High leverage in the system increases the probability of the second scenario, as cascading liquidations can drive sharp moves. Conversely, strong institutional buying interest and positive news flow could support the first scenario's more gradual appreciation.
Fundamental Considerations:
Bitcoin's long-term value proposition remains intact regardless of short-term price fluctuations. The fixed supply of 21 million coins, increasing institutional adoption, and growing recognition as a store of value and inflation hedge provide fundamental support. The halving cycles continue to reduce new supply entering the market, creating favorable supply-demand dynamics over time.
Additionally, Bitcoin's role in the global financial system continues to evolve. More institutions are incorporating Bitcoin into their treasury strategies, and infrastructure supporting Bitcoin adoption continues to expand. These fundamental developments support higher valuations over extended time horizons.
Risk Management Approach:
Given the uncertainty between these two scenarios, proper risk management becomes paramount. Traders and investors should consider their time horizons and risk tolerance when positioning. For long-term holders, both scenarios ultimately point toward higher prices, making the timing of entry less critical than maintaining exposure.
For more active traders, identifying key invalidation levels for each scenario can help manage risk. A decisive break below major support would favor the second scenario, while sustained strength above resistance zones would confirm the first path.
Market Psychology:
Understanding market psychology helps contextualize these scenarios. Bitcoin markets are known for maximum pain trades where price moves in the direction that causes the most discomfort to the largest number of participants. The deeper correction in scenario two would certainly qualify as such a move, flushing out recent buyers and creating fear before the eventual recovery.
Conversely, a steady grind higher in scenario one would frustrate bears waiting for lower entry points. Both paths are psychologically challenging in different ways, which is typical of cryptocurrency markets.
Conclusion:
This updated analysis reaffirms that Bitcoin remains at a critical juncture with multiple viable paths forward. The technical framework provides clear levels to monitor, while fundamental factors support long-term appreciation regardless of near-term volatility. Patience, discipline, and adherence to a well-defined trading plan will be essential as this phase develops.
Whether Bitcoin takes the more direct path higher or experiences a deeper correction before rallying, the long-term outlook remains constructive for those with appropriate time horizons and risk management. The key is to remain flexible, monitor the identified levels closely, and adjust positioning as the market reveals its chosen path.
This analysis represents my personal technical assessment and interpretation of potential scenarios based on chart patterns and market structure. It does not constitute financial advice. Cryptocurrency investments carry substantial risk, and you should never invest more than you can afford to lose. Always conduct your own research and consider consulting with a financial advisor.
Bitcoin (Cryptocurrency)

Bitcoin’s Head & Shoulders Has Played Out - Market Is ResettingOn the BTC H1 chart, the market has already completed a clean Head & Shoulders distribution, followed by a decisive breakdown and textbook retest, confirming bearish control in the prior structure. The impulsive sell-off after the retest flushed liquidity aggressively, signaling that weak longs were fully cleared. However, the key shift now is context: price is no longer trending impulsively lower. Instead, BTC has transitioned into a post-distribution accumulation range, marked by compressed, overlapping candles and diminishing downside momentum. This behavior suggests bearish momentum exhaustion, not trend continuation.
The current structure shows price stabilizing after the sell-off, with higher lows forming inside the range — a classic rebalancing phase where smart money absorbs liquidity rather than pushing price immediately. As long as BTC holds above the recent swing low, the probability favors a range expansion to the upside, with the first objective being a move back toward the upper boundary of the accumulation zone. That move would represent a corrective recovery, not a full trend reversal yet.
The Head & Shoulders has already done its job. What follows is not immediate downside continuation, but structural digestion. Bitcoin is rebuilding a base. A confirmed breakout and acceptance above the range would open the door for a controlled bullish leg until then, this remains a range-first, patience-required environment, not a chase market.

Detaching Emotions from Wins & LossesWelcome back everyone to another educational article, it makes me happy to see these posts are benefiting a lot of you! Make sure to share them!
Today we will look into one of the leading but overlooked skills in the trading environment:
“Detaching Emotions, from wins & losses”
Just this skill alone, separates consistent and disciplined traders, from emotional traders.
Emotions in Trading: ( What are they, really? )
In Trading, emotions are the psychological responses, as well as mindset shifts that take place, during different stages of the trading process.
These stages include:
- Winning
- Losing
- Consolidation
- Learning
- Earning
The emotions that are commonly experienced among traders are:
- Fear
- Greed
- Anger
- Frustration
- Impatience
- Revenge Trading
- Overconfidence (Ego)
Emotions are natural right.
The problem though, is not having emotions, but it is allowing them to control the decisions during a probability based environment
The Effects of winning and losing:
What a win in Trading really is:
A win in trading is not just about being able to make that $100.
A win includes:
- Following your trading system
- Respecting your risk management
- Accepting a stoploss without emotions
- Staying out of the market, even when there is no setup showing
- Journaling and assessing previous trades
- Backtesting and refining your system (edge)
These actions can and will lead to long-term profitability.
Money is just one outcome, but discipline is the real win.
What a loss really is:
A loss is more than just losing money.
Losses occur when traders:
- Break their trading rules
- Give into fear or greed (I made a post regarding Fear vs Greed)
- Overtrading
- Revenge trading (usually because they might lose 3x trades in a row)
- Ignore risk management
- Chase the market emotionally
A financial loss can still remain as a psychological win, if the system rules were followed.
A profitable trade can still remain as a psychological loss, if discipline was broken.
Traders Emotional Responses to Wins x Losses
When a trader experiences a win:
When a trader makes money, the brain releases dopamine.
A dopamine hit can:
- Increase confidence
- Increase risk-taking
- Encourage overtrading
- Lead to greed if unmanaged
This is why wins are often more dangerous than losses.
Positive wins vs negative wins
A positive win:
- Making money while following the plan
- Hitting a target and stopping for the day
A negative win:
- Hitting stop loss
- Accepting it
- Closing the platform
- Being done for the day
It may feel frustrating, but discipline is strengthened.
That frustration is growth.
When a Trader faces a loss
There is no such thing as a “ positive loss ” when rules are broken.
Losses caused by emotional decisions reinforce bad habits and increase weak discipline.
These losses:
- Trigger revenge trading
- Create anger
- Damage confidence
- Snowball into larger drawdowns
This is why emotional losses are far more expensive than financial ones.
Recommended steps to detach emotion from wins & losses
Accepting wins
When you hit your target:
- Log off for the day
- Do not chanse more
- Do not increase risk
- Do not let greed take control
If you targeted, $500 and you scored $612, that is a win. Not a reason to continue on.
Greed starts after the win. Not before it.
Accepting losses
When you lose:
- Stop trading
- log the trade
- Review it honestly
- Walk away
Losses are tuition, they are not punishment.
“Log, Learn, Earn Repeat”
This is a process I like to use and follow. It focuses on keeping emotions of the equation.
1) Log the trade honestly.
2) Learn from the execution, not the outcome & results
3) Earn by applying lessons over time.
4) Repeat the process consistently in your system
Wins and losses become data, not emotional events
My Final thoughts:
You do not level up as a trader by winning more trades.
You level up by reacting the same way to wins and losses.
You also level up with experience. You can not “ Pay to win ” to get skills.
Emotions fade when:
- Risk is controlled
- Rules are followed
- Process is trusted
Detach emotions from outcomes, and consistency will follow.
I hope this article is and will be beneficial to you all.
Thank you for reading.

BTC Panic: Why This Flush Out Is a MONSTER Trade OpportunityWe are revisiting our BTC Bitcoin "Monster Trade" strategy following the recent volatility spikes triggered by Donald Trump’s tariff rhetoric at the World Economic Forum. While the market panicked, we saw a significant liquidity flush.
💰 The "Monster Trade" Strategy In this video, I break down exactly how we are capitalizing on any deep retrace and more importantly, this current pullback. We are executing a systematic position-building strategy.
The main thing with this is we MUST lock in 50% profit on existing positions before opening new ones. This allows us to ride the entire trend while banking realized gains along the journey.
Because we have already banked profits, this deep retracement isn't a threat or a risk.
🚀 The Macro View Looking at the Higher Time Frame (HTF), the technicals suggest the corrective trend is exhausting and potentially reversing. This structural shift indicates we are staring at a potentially once-in-a-lifetime opportunity to load the boat before the next parabolic Bitcoin rally.
Watch now to see the exact price levels I'm watching! 👇

BITCOIN / GOLD ratio's mind-blowing revelation.Bitcoin (BTCUSD) remains under heavy pressure since its October 2025 All Time High (ATH) but the BTC/GOLD ratio reveals that the real selling pressure in terms of the precious yellow metal has been boiling up for some time before that date.
In fact the ratio's last High was in August 2025, which technically was a Lower High as the true Top for BTC/GOLD's Cycle was in December 2024. Mind-blowing revelation indeed and that undoubtedly draws similarities with the previous Cycle, which also had a Double Top in 2021.
The key indicator here is the 1M RSI of the ratio. It has a Lower Lows trend-line, which has priced all Cycle bottoms since 2015. More recently (since January 2019) there is a diverging Lower Lows trend-line (dashed) also. The tight zone within those two trend-lines may be holding the key for this Cycle's bottom.
This shows that the bottom may be closer than we may expect but the last Bear Cycle showed a slowing down behavior once it approached the RSI Lower Lows and turned sideways before it finally made contact with it 6 months later. For the real BTC/GOLD price action though, the downtrend didn't slow down as much, first breaking violently below the 1M MA50 (blue trend-line) and finding bottom 6 months later as mentioned just above the 1M MA100 (green trend-line).
If we have a decreasing rate on the MA bottoms, we can expect the current Cycle to bottom below the 1M MA100 this time, closer to the 1M MA150 (red trend-line).
So closer than it looks or not in terms of bottom, the Bear Cycle is entering its 2nd and final Phase.
So what do you think about the BTC/GOLD approach? Feel free to let us know in the comments section below!
---
** Please LIKE 👍, FOLLOW ✅, SHARE 🙌 and COMMENT ✍ if you enjoy this idea! Also share your ideas and charts in the comments section below! This is best way to keep it relevant, support us, keep the content here free and allow the idea to reach as many people as possible. **
---
💸💸💸💸💸💸
👇 👇 👇 👇 👇 👇

Is Bitcoin about to crash? Read in full...Bitcoin is very slow lately and the same price range has been holding for months, no change truly. Normally, even while we recognize all of the signals and keep a bullish bias, it is still normal to wonder if Bitcoin will continue growing.
The active price range is the same since late November. Bitcoin has been moving between $84,000 to $92,000.
Now, think of this. Do you remember after the higher low 18-December how sellers couldn't produce a price below $86,000?
Regardless of all the fluctuations and the sideways range, the lowest possible was $86,400, never below, and this development is still true today.
The lowest Bitcoin has gone was $87,277, yesterday, and you can see how easily this is the final low. Last month it was $86,400, 24-Dec, this month it is ~$87,000.
We have a trading range but still, there is a clear and undeniable bullish bias. The most recent move is a higher high that peaked at a perfect level based on Fibonacci retracement; all the action is composed of higher highs and higher lows.
So, we have a bullish consolidation period, we can even say an uptrend if we consider only the short-term. This will lead to a higher high next.
The last target at $98,000 matches the 0.382 Fib. retracement level (inverted correction) on this chart. The next target is 0.618 which sits around $108,800... And that's all I have to say.
While the doubt is in the air, it is not in the chart. Trust the chart and all will be good.
The truth is that the next move has already being revealed. Bitcoin is going higher, at this point you can open LONG with any amount of leverage below 20X.
Any trading below $90,000 is a very strong buy opportunity right now. Do whatever you have to do to make the most out of this situation. It will soon be gone.
As soon as the relief rally is over Bitcoin will start to crash for months.
I've been mentioning Ethereum decoupling from Bitcoin but I don't really think so. I do believe Ether will produce massive growth before a major correction shows up, but when Bitcoin crashes everything crashes. Don't wait for the hype, greed and euphoria to take action. Now it is the time to go LONG.
Bitcoin is perfect right now, all the altcoins as well. The market is going up, but we have some reckoning to do after this bullish wave.
It is always the same; up and down, up and down, up and down... We can profit from both the bearish and bullish cycles.
Thank you for reading.
Namaste.

Bitcoin’s Next Big Move: Relief Rally or Extended C Toward 50k?Hello everyone.
BTCUSD on the weekly chart, I read the advance from the 2023 lows as a completed 1–5 impulse. After the top, price action clearly transitioned into an A-B-C corrective structure.
Price is currently trading around 89,091, below 0.236 (91,330), suggesting that upside attempts have not yet gained structural acceptance and the market remains in correction mode.
My primary roadmap:
A appears completed with an initial defense.
The rebound that follows can be interpreted as B, typically a relief move rather than trend continuation.
The key risk is that if B remains weak, the structure may shift into an extended C wave, leading to a deeper rebalancing phase.
Key weekly zones:
91,330 (0.236): First threshold. Reclaiming it supports a developing B rebound.
98,008 (0.382): Major test for rebound strength.
103,405 – 108,801 (0.50 – 0.618): A high-probability exhaustion/supply zone for B. As long as price stays below this band, upside is treated as corrective.
Downside risk:
Weekly acceptance below 80,537 confirms the transition into C.
If C extends, the 50,000 area emerges as a meaningful medium-to-long-term balance / target zone on the weekly timeframe.
Bottom line: The dominant weekly structure remains an ABC correction. Upside is possible within B, but a weak B increases the risk of an extended C toward the 50k region.

Bitcoin to 61,382$ we go! Hi, All
just here to warn you again of the next set of drops that will take place over the next two months.
Remember, we told you that price would be going down to the 80k support level once price was trading at 120,000$ and now were telling you the same thing again - albeit, there was a lot of nay sayers in the comments before saying that it was impossible for bitcoin to drop and it happened.
key level of support is at 80,934$ but I think this should be broken easily.
price discovery to the downside should take us to 69,675$, which is another key support.
none the less, over the coming two months neither of these supports will hold and price will break them eventually.
let me know in the comments what you think.
I've linked some previous ideas in the comments for you to see how accurate our analysis always is and with time it always comes to fruition.

Long Dimon, Short Corn: $XLF vs. $BTC🏛️🏛️🏛️🏛️🏛️
🌽🌽🌽🌽🌽
Banks make profits
Banks can innovate and adopt new technologies
Bitcoin core devs can't.
Goal: Capture the capital flight from the meme of decentralised money and the central bank disruptor, back to the money centers of the US empire.
I believe a retest of December 2017 is on deck.
#XLF #BTC #Bitcoin #Corn #MacroTrade

EURUSD to fall!EURUSD fell end of the day yesterday and did a pullback in LONDON session. Waiting for confirmation to go SHORT.

USDCHF will rise!USDCHF waiting for confirmation to pull UP. Dropped in London session and few important news on the way.

Bitcoin Short Term Sell Trading Opportunity SpottedH1 - Bearish trend in play
Two Solid Resistance Levels
Trend continuation very likely after pullback.
👉 If you enjoy this analysis, please Like, Follow, and Support the profile! Your engagement motivates us to share more quality setups.

Bitcoin - Looking To Sell Pullbacks In The Short TermH1 - Strong bearish move.
No opposite signs.
Currently it looks like a pullback is happening.
Expecting bearish continuation until the two strong resistance zones hold.
If you enjoy this idea, don’t forget to LIKE 👍, FOLLOW ✅, SHARE 🙌, and COMMENT ✍! Drop your thoughts and charts below to keep the discussion going. Your support helps keep this content free and reach more people! 🚀
--------------------------------------------------------------------------------------------------------

BTC - The Last Standing Checkpoint!This blue zone is the line in the sand.
Right now, BTC is sitting at a critical checkpoint, where multiple reactions already took place. As long as this blue demand zone holds, the plan remains simple:
👉 Look for longs, in line with a potential continuation toward the upper bound of the structure.
However, this level matters a lot.
If price loses this blue zone and breaks down, that would signal a clear shift in control, and the bears would take over entirely, opening the door for much deeper downside.
⚠️ Disclaimer: This is not financial advice. Always do your own research and manage risk properly.
📚 Stick to your trading plan regarding entries, risk, and management.
Good luck! 🍀
All Strategies Are Good; If Managed Properly!
~Richard Nasr

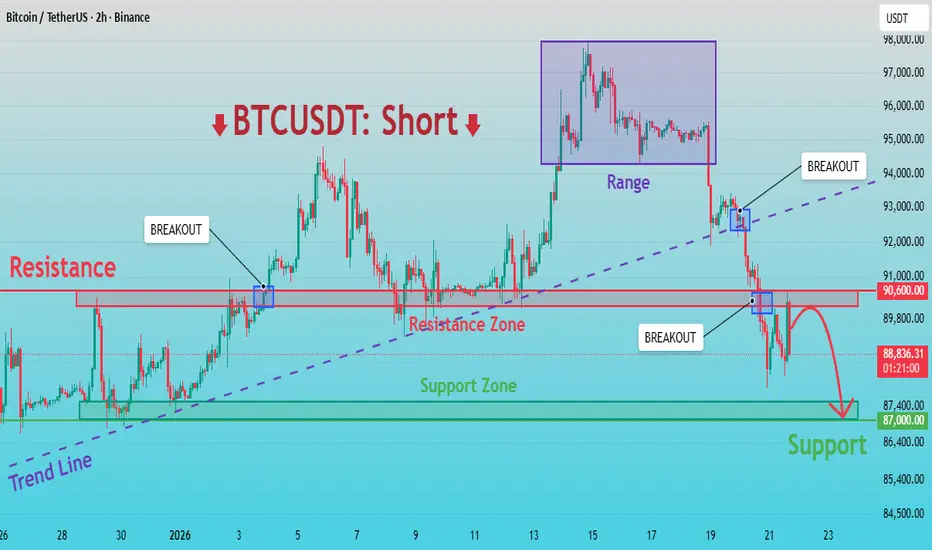
BTCUSDT: Breakdown Confirmed – Sellers in Control, Target to 87KHello everyone, here is my breakdown of the current BTCUSDT setup.
Market Analysis
BTCUSDT previously traded within a bullish structure, supported by a well-defined ascending trend line that reflected strong buyer control. After an impulsive upward move, price formed a consolidation range near the highs, indicating a temporary balance between buyers and sellers. Eventually, BTC failed to continue higher and broke down from the range, which became the first sign of weakening bullish momentum. This was followed by a decisive break below the ascending trend line, confirming a structural shift in favor of sellers. Subsequent recovery attempts were capped by a clearly defined Resistance Zone around 90,600, where multiple breakout attempts failed, signaling strong selling pressure.
Currently, BTCUSDT is trading below the resistance zone, forming lower highs and maintaining a bearish market structure. Upward moves appear corrective rather than impulsive, reinforcing seller dominance. Below the current price, a Support Zone near 87,000 stands as the next key area where buyers may attempt to slow the decline.
My Scenario & Strategy
My primary scenario remains bearish as long as BTCUSDT stays below the 90,600 resistance zone and does not reclaim the broken trend line. Any pullbacks into resistance that show rejection may be considered potential short opportunities. The main downside target is the 87,000 support zone, where price could react or temporarily consolidate.
However, a clean break and sustained acceptance above 90,600 would invalidate the bearish bias and suggest a possible transition back into consolidation or recovery. For now, market structure and momentum clearly favor sellers.
That's the setup I'm tracking. Thank you for your attention, and always manage your risk.
SUI – Long Spot Setup at Key SupportSUI has retraced into a major support zone that has historically provided strong bullish reactions. We're watching the $1.45–$1.50 range as a key accumulation area for a laddered long spot position.
📈 Trade Plan:
Entry Zone: $1.45 – $1.50
Take Profit Targets:
• TP1: $1.65 – $1.95
• TP2: $2.20 – $2.50
Stop Loss: Below $1.30 (invalidates support structure)
This setup offers a favorable risk-reward profile as long as the $1.30 level holds. Watching closely for volume confirmation and potential bullish divergence before fully sizing in.

EVERYTHING WITH THE PLANMorning folks,
Last time we in details explained why our view is bearish and that we should be prepared for collapse. But the recent leg is just a beginning. Although we keep mid term bearish context intact, in a nearest few sessions we count on upside bounce. Because it fits to our plan of 4H H&S Shape .
On 1H chart we see reversal pattern, that suggest reaching of 92.5-93K level. We doesn't call you to buy, although this is not forbidden. But our major context is bearish, so we mostly watch for this pattern as a chance to get good short entry later...
I mark this update as "bullish", since the next one comes on Monday. But you've got an idea...

Coinranger| BTCUSDT: Uncertainty after the drop🔥News
🔹The International Economic Forum continues. Trump's speech is at 16:30 (UTC+3)
🔥BTC
🔹We've clearly followed the forecast. Now:
1️⃣ It's still hard to say for sure about the levels above. Preliminary figures are 91600 and 92855. But we could fall into a flat for a while.
2️⃣ The price may reach 87550 before continuing the pullback. I haven't marked any lower levels yet, because we're unlikely to go there without a pullback.
The priority is a pullback; reaching the lower level is also possible.

BTC BitCoin (A bullish pinbar)BTC 22 1 2026
We’re seeing a strong bullish pin bar on the daily chart around the 87k–90k zone.
This suggests buyers are stepping back in with conviction.I’ll be keeping a close eye on the 91K level.
A decisive break and close back above 91K would likely reignite bullish momentum.
Always do your own research (DYOR).
@Tradwithsonic

BTC at a Decision Point — Relief Bounce or Lower High?On the BTCUSD H1 chart, price remains firmly in a short-term bearish structure following the sharp impulsive sell off from the 95,000 region. The breakdown from the prior consolidation occurred with strong momentum, slicing cleanly below the EMA and confirming a shift from balance to markdown. Since then, Bitcoin has been trading beneath a well-defined resistance zone around 93,200–93,500, where previous support has now flipped into supply a classic bearish market behavior.
The recent reaction from the support zone near 88,000–88,500 is technically a relief bounce, not a reversal. Structurally, the bounce is corrective: price is forming overlapping candles and shallow pullbacks, suggesting short covering rather than aggressive new demand. As long as BTC remains capped below 89,900–91,200, the probability favors a lower high forming before sellers reassert control.
If buyers can hold above the support zone and reclaim 89,900, a deeper corrective move toward 91,200–91,500 is possible, where the EMA and prior intraday structure align. However, this zone is expected to act as sell side re entry, not a breakout level. Failure to build acceptance above that area would likely trigger another leg down, reopening downside liquidity toward the lower 88,000 region and potentially below if support weakens.
Bitcoin is currently in a bearish retracement phase inside a broader intraday downtrend. The support zone is holding for now, but without a strong structural reclaim, upside moves should be treated as corrective pullbacks into resistance. Until BTC decisively breaks and holds above the resistance zone, risk remains skewed to the downside, with sellers still controlling market structure.

Accumulation Phase at Demand, Breakout Setup FormingBitcoin has just completed a sharp impulsive sell-off, driving price directly into a higher-timeframe demand zone (≈ 88,000 – 88,500). The rejection from this area was immediate and aggressive, signaling strong passive buying interest absorbing sell pressure. Since that reaction, price has transitioned from impulsive behavior into compressed, overlapping candles, a classic shift from markdown to accumulation. This is no longer a trending environment it is a pre-expansion phase.
📦 Accumulation Structure
Inside the marked grey box, price is:
- Respecting range highs and lows
- Printing equal highs / equal lows
- Showing liquidity sweeps within the range, but no follow-through
This behavior strongly suggests composite operators accumulating positions, not distribution. The market is spending time, not distance, which is exactly what we expect after a fast sell off into demand.
Importantly, downside continuation attempts are failing, and sellers are unable to reclaim control below the demand zone.
🔑 Key Levels to Watch
Range High / Breakout Level: ~90,000
Range Mid / Acceptance Area: ~89,200
Demand Zone Support: ~88,000 – 88,500
A clean H1 close above the range high, followed by acceptance, is the trigger that confirms markup initiation.
🚀 Breakout & Expansion Scenario
If price breaks and holds above the accumulation high:
First upside objective: 91,200
Secondary target: 92,600 – 92,800
Extended target: 93,200 – 93,300 (EMA / prior structure)
The projected green path aligns with range expansion logic, not prediction — the market will expand once liquidity is fully absorbed.
⚠️ Invalidation Scenario
The bullish thesis weakens if:
- Price loses 88,000 with strong momentum
- Demand fails to hold on retest
- Structure shifts back to impulsive downside
Until then, the path of least resistance is up, but only after confirmation.
🧠 Professional Takeaway
This is a textbook transition:
Impulse → Demand Reaction → Accumulation → Expansion
Patience is critical here. The opportunity is not in the middle of the box it is in the break and acceptance above it.
Let the market show its hand.

Lower Highs Under Trendline — Any Bounce Is Still a Sell SetupBTC remains firmly in a short-term downtrend after a sharp impulsive sell-off that broke prior structure and pushed price decisively below the EMA cluster. The recent rebound from the local low is reactive, not impulsive, and is currently stalling directly beneath a descending trendline resistance, reinforcing the bearish market context.
Structurally, the sequence is clear: lower highs, lower lows, with price consistently failing to reclaim key dynamic resistance. The descending trendline aligns closely with the falling EMA, forming a confluence resistance zone where sellers have repeatedly stepped in. As long as BTC trades below this zone, any upside movement should be treated as a corrective pullback, not trend reversal.
The current price action shows hesitation and overlap near resistance, suggesting seller absorption of late longs rather than aggressive buying. This behavior typically precedes either another rejection from the trendline or a brief fake breakout before continuation lower.
From a scenario perspective:
- Primary (higher probability): rejection at trendline → rollover → continuation toward the 86,900–87,200 liquidity zone.
- Alternate: a clean break and acceptance above the trendline opens room for a deeper corrective rally toward ~91,200, but this would still be a counter-trend move unless structure fully flips.
Bottom line:
BTC is still trading below descending resistance in a bearish structure. Until the trendline and EMA zone are decisively reclaimed, the market favors sell-the-rally behavior, with downside continuation remaining the dominant bias.

Why Does Bitcoin Often Top When Everyone Is Bullish?In the Bitcoin market, there is a familiar paradox:
The more people believe price will keep going up, the closer the market often is to a top.
This isn’t superstition or coincidence.
It’s the result of capital flow, crowd psychology, and how markets truly work.
1. When Everyone Is Bullish, New Buyers Are Running Out
Price can only continue to rise if there are new buyers willing to pay higher prices.
But when:
- Positive news is everywhere
- Social media is full of higher price targets
- “Buy the dip” becomes automatic
→ Most of the available capital is already in the market.
At this stage:
- Those who wanted to buy → already bought
- Those who haven’t → either lack capital or are unwilling to chase price
Demand weakens, while supply quietly starts to appear.
2. Smart Money Doesn’t Buy When Optimism Is Extreme
Large institutions don’t accumulate Bitcoin when:
- News is overwhelmingly positive
- Retail traders are FOMOing
- Price is far from its accumulation zone
Instead, they tend to:
- Buy during doubt
- Dustribute during certainty
When the crowd turns aggressively bullish, it often signals:
Smart money is reducing exposure, not adding to it.
3. Extreme Bullishness Creates Psychological Imbalance
Near market tops, you often see:
- No bearish scenarios considered
- Anyone questioning the trend labeled as “FUD”
- Stop losses ignored in the name of “conviction”
This is a psychological imbalance:
- Expectations are stretched
- Risk is underestimated
At this point, the market doesn’t need bad news.
A lack of new buyers is enough to trigger a correction.
4. Tops Form Quietly, Not in Panic
Many believe a top must come with a violent crash.
In reality:
- Tops often form through choppy price action and slowing momentum
- Volume fades
- Breakouts repeatedly fail
This is when:
Confidence remains high, but underlying strength is already weakening.
5. The Key Lesson for Traders
- Tops don’t form when the market is fearful
- They form when risk is ignored and confidence becomes one-sided
Understanding this helps you:
- Avoid FOMO when everyone is bullish
- Stay cautious when “everyone is right”
- Realize that market psychology matters as much as technical analysis
Final Thoughts
Bitcoin doesn’t top because too many people are bullish.
It tops because when everyone is bullish, the market runs out of fuel.
In trading:
The crowd is usually right in the middle of a trend — and wrong at turning points.
Keeping a calm, rational mindset while others are euphoric
is the true edge of a mature trader.
