BTCUSDT.P - November 22, 2025Bitcoin is in a pronounced downtrend, with price action consistently making lower highs under the descending trendline and currently trading below both resistance levels at 86,313 and 88,214. Recent momentum remains bearish, with sellers actively defending rallies and price targeting the marked support band near 78,800–79,000; unless price recovers above 86,313 resistance, expect further weakness and trend continuation.
Bitcoin (Cryptocurrency)

Will this date come true?This is not fundamentally unbelievable, especially with the manipulation of governments in the crypto market
What is completely clear to us activists is the manipulation of absurd markets with great temptation by the yellow-haired doll and the child politicians and child killers around him.
Although I am not active in this market, I feel sorry for you, despite this cesspool soaked in the blood and hearts of the people of the world!
These numbers may not be realized, but the much blood that has been spilled on the ground will rise and the consequences will drown it.
The freedmen will definitely win.
And I must say, this analysis may expire after a while:
Good luck
MJ.REZAEI

185kthis is the last post i will ever make on this account. after today, i will be discontinuing the usage of this account in perpetuity. it will remain a relic of sorts.
---
gm,
many of you remember me as eloquent trades, or elo. i come today with one final post for you before i disappear onto the dark side of the moon.
---
i predict the bitcoin rally is not yet finished,
i believe we have one final leg up to go
my upside target sits at $185k this cycle.
---
once 185k has been attained, i predict a crash like we've never seen before, one that defies logic, one that takes everything away, from anyone associated with this market.
---
ps. this is not financial advice, this is merely a theory-craft, the final one on this account.
farewell
🌙

BTCUSDTHi
CRYPTOCAP:BTC is correction from ATH but if couldn't keep level (110.000$) we see more downtrend and I think deep bear-trend to 80.000$.

Bitcoin Hits the Target Zone — What Comes Next?Bitcoin finally hit the level we were waiting for — so what’s next?
I expect a short move up toward $90K, followed by another drop toward $70K…
unless the market gets “surprised” by a major bullish catalyst or strong news event.
Not financial advice.

Bitcoin’s Drop From $125K: A Healthy Correction?The recent decline is largely a correction after BTC’s massive rally from $17K (Oct 2023).
Based on Fibonacci levels, the next key supports sit at $85K, $70K, and $60K — with $70K looking especially strong to me.
And yes… Bitcoin is officially 4-digit again.
#Bitcoin #BTC #CryptoAnalysis #Fibonacci #CryptoMarket

BTC Bitcoin Bear Market If you haven`t bought BTC before the recent rally:
Historically, Bitcoin has shown a tendency to retrace in December before starting a recovery around March. This pattern could repeat this season, with BTC facing selling pressure as year-end portfolio rebalancing and macro uncertainties weigh on the market.
While a brief Santa Claus rally might provide temporary relief, the bearish trend is expected to dominate until March. By then, BTC could trade below $84K before regaining momentum, aligning with its historical recovery trend as market conditions stabilize in spring.

A 30% Crash: Bitcoin Falls Deeper Into Macro RealityThat’s a 30% drop from the top — a serious correction.
Fears of a U.S. stock market decline, especially in high-tech, along with expectations of further rate cuts, have pushed heavy risk-off sentiment into crypto.
The truth is clear:
Crypto has never been fully independent from central banks, governments, or macroeconomic cycles — despite all the slogans.

Bitcoin Below Weekly EMA-55 After 188 Weeks🔴 The last time Bitcoin closed below the 55-EMA on the weekly timeframe, it crashed more than 60%.
It’s been 188 weeks since that happened — is history about to repeat itself?
Bitcoin Bearish Below 87.3K as ETF Outflows IntensifyCrypto Selloff Accelerates Amid ETF Outflows
The cryptocurrency market downturn has intensified as spot Bitcoin ETFs recorded nearly $900 million in outflows, led by the iShares Bitcoin Trust. This wave of selling has added significant pressure across the market.
Bitcoin has fallen about 26% this month, dropping from the 110.3K area and now trading below 87K, reflecting sustained bearish sentiment.
Technical Outlook
Bitcoin continues to look weak in the short term under current conditions.
As long as price remains below the 87.3K pivot, downside pressure is expected to continue toward 76.68K, and a break lower may extend the decline to 72.6K.
In the case of a bullish recovery, Bitcoin would need to close a daily candle above 87.3K to signal a corrective move toward 95.5K and potentially higher.
Pivot Line: 87.3K
Support: 76.68K, 72.6K, 66.4K
Resistance: 95.5K, 100K

Potential Downside Short-term - Long Term EntriesCOINBASE:BTCUSD has broken below the ascending channel that has held for several months, indicating a possible shift in momentum from bullish to bearish. BITSTAMP:BTCUSD is overbought on the RSI and broke below it's 200-day EMA as well. I'll certainly be adding to my long-term position on the way down and will likely grab a long position at some point- will post an update then. Until then, some RSI-based supply and demand zones to keep an eye on, watching closely

TradeCityPro | Bitcoin Daily Analysis #227👋 Welcome to TradeCity Pro!
Let’s dive into the Bitcoin analysis. The market is still very bearish and moving down rapidly.
⏳ 1-Hour Timeframe
Yesterday, the market continued its downward movement, and after breaking the 88,825 support, it made a very brief correction before breaking even the 83,333 level.
⭐ The support level we had for the RSI was 21.53. As you can see, RSI reacted to this level, and after its correction, it has now reached this area again.
🧮 From a momentum perspective, the market is highly bearish, and the movement has been very sharp. Volume is fully confirming the downtrend, and I believe after this sharp decline, we could see the start of a correction phase.
💥 We have a very important support zone at 80,000, where the price could move towards and potentially enter a corrective phase. However, in any case, I think the market has made its move, and for the downtrend to remain healthy, a correction is needed.
✅ At the moment, we can’t provide a trigger for a new position since the market has moved so sharply, like a speeding train. It’s better to wait and then hop on once the correction has started.
📊 For long positions, it’s clear that the market is still in a downtrend, and there is no structure supporting a long position. We’ll consider opening a long position only once the trend changes.
❌ Disclaimer ❌
Trading futures is highly risky and dangerous. If you're not an expert, these triggers may not be suitable for you. You should first learn risk and capital management. You can also use the educational content from this channel.
Finally, these triggers reflect my personal opinions on price action, and the market may move completely against this analysis. So, do your own research before opening any position.

BTCUSD Short: Descending Channel Targets $89,000 Demand ZoneHello traders! BTCUSD continues to trade within a clear descending channel, maintaining a strong bearish structure characterized by consecutive lower highs and lower lows. The price action repeatedly respected the channel boundaries, confirming solid seller control throughout the recent decline. Each time Bitcoin reached the upper boundary of the channel, it formed a pivot point, initiating another downward wave. Before the latest drop, BTCUSD spent some time moving sideways inside a Range Zone, showing temporary accumulation before sellers regained dominance. The bearish continuation led to another pivot formation near the channel’s resistance, triggering a fresh leg to the downside.
Currently, price has now approached the $89,000 Demand Zone, which aligns with the lower boundary of the descending channel. This level has acted as a significant reaction point, generating short-term bounces in previous price swings. The current positioning suggests that buyers may once again attempt to defend this zone. While below the $96,000 Supply Zone and the channel resistance, the broader trend remains bearish. BTCUSD is likely to experience a short-term corrective rebound from the demand area, aiming toward the $92,000–$93,500 region — a previous reaction cluster and local resistance.
My scenario is targeting the $89,000 level. However, if Bitcoin breaks below the $89,000 Demand Zone, it may trigger a deeper bearish continuation toward the lower liquidity areas around $88,000 or even lower. A confirmed breakout above $96,000 would be required to invalidate the bearish structure and signal a potential shift in momentum. For now, BTCUSD remains bearish, with a potential short-term correction from demand before further direction becomes clearer. Manage your risk!

Bitcoin is approaching an important support level (1D)Bitcoin has entered a strong bearish structure.
It is currently near an important origin zone that has broken significant highs (BOS). It is expected to make an upward reversal from this area.
It’s natural for this momentum to require some base-building, and since the movement is on the daily timeframe, the upward reversal may take some time.
The target range is 95K to 96K.
A daily candle closing below the invalidation level will invalidate this analysis
Do not enter the position without capital management and stop setting
Comment if you have any questions
thank you

BTCUSD: Bearish Momentum Aiming for New LowsHello everyone, here is my breakdown of the current Bitcoin setup.
Market Analysis
BTCUSD continues to follow a strong bearish market structure, consistently moving inside a well-defined Downward Channel. The chart clearly shows that after a prolonged consolidation phase inside the large Range, Bitcoin attempted both a fake breakout to the downside and a bullish breakout above the upper boundary — but neither attempt resulted in a sustained trend shift. This indicates that buyers lacked the strength to reverse the broader trend. Once price broke down from the range, BTCUSD established a clean sequence of lower highs and lower lows, forming two consecutive downward channels. Each retest of the channel’s upper boundary resulted in a strong bearish rejection, confirming heavy selling pressure at every corrective move upward.
Currently, the recent breakout below the minor support line inside the second downward channel once again demonstrates that sellers remain fully in control. Price is currently trading just above the major Support Zone around $90,400–$91,000, which has acted as a short-term demand area. However, the repeated bearish impulses and weak buyer reactions suggest decreasing bullish interest at these levels. BTCUSD is now hovering around support but forming a continuation pattern that leans toward further decline. Failure to break above the $96,000 Resistance Zone, aligned with previous structure and the former trendline, reinforces the bearish outlook.
My Scenario & Strategy
I expect that Bitcoin will likely attempt a minor corrective push to retest the broken support or the lower boundary of the channel — but any such move is expected to be short-lived unless strong buying pressure appears. After this corrective phase, BTCUSD may continue its decline toward the lower part of the channel and deeper support areas.
A confirmed breakdown below the current Support Zone ($90,400–$91,000) would strengthen the bearish scenario and open the path toward the next downside targets. Only a strong breakout above $96,000 — with clear bullish confirmation — would weaken the bearish bias and signal that buyers are stepping back into the market. For now, short positions remain more favorable, especially after corrective pullbacks into resistance zones within the downward channel structure.
That's the setup I'm tracking. Thank you for your attention, and always manage your risk.

BTC: Black Friday Crash & The Road to 74k. H&S in the making?We are seeing a true Black Friday on Bitcoin today 😵😱🤬—price is diving below 82k, and the 126k top feels like jusst history.
Looking at the 1D structure, the market is clearly aiming for a "hard reset," magnetically pulled toward the 1.0 Fibonacci level around 74,600 USDT. We’ve already smashed through key supports, including the 0.786 Fib, which usually opens up a highway for a full retracement.
In my view, this drop is setting the stage to build the Right Shoulder of a massive Head and Shoulders pattern. If t he 74k zone holds—and it’s a major technical support—I expect a demand reaction there (marked with the green arrow). The target for this relief rally would be a return to the 100k area (0.5 Fib), completing the shoulder structure before any potential further downside.
The situation is confirmed by Trading Cipher X. Money Flow is flashing thick red, signaling that big capital is still exiting the market, while the wide momentum waves at the bottom indicate heavy selling pressure. There are no reversal signals yet; the daily candles (basically bearish Marubozu) and rising bars on the cumulative volume (WWV) confirm that the bears are in total control right now.
Game Plan: I’m not catching falling knives here. I’m patiently waiting for the price to hit the "kill zone" at 74,600 USD. Only there, upon confirmation (I’m looking for a bullish divergence on TCX), will I look for a Long entry to play the bounce. On the flip side, mid-term Shorts will only become attractive if we revisit the 98k-100k zone. Keep your eyes on 74k—it’s make or break for the bulls in the coming weeks.

BITCOIN (BTCUSD): When to Buy?!
Bearish rally continues on Bitcoin.
The market already lost more than 34% from a current ATH.
Analyzing a historic price action, I see an important structure cluster to focus on.
65000 - 76000 is a significant support area.
That will be a good zone for buying Bitcoin, expecting a resumption
of a long-term bullish trend after its test.
❤️Please, support my work with like, thank you!❤️

Strong Support Holding - BTCUSD Buy OpportunityHello Followers, I am going to share you my opinion on BTCUSD next move.
BTCUSD is currently respecting the 89,000-90,000 support zone, indicating strong buying interest. A breakout and hold above support zone presents a high-probability buying opportunity towards the next move targets. As long as price remains above support, bullish continuation toward targets 93,600 and then 96,000 remains likely. If BTCUSD break the support zone then protect downside risk with a stop loss at 87,500.
KEYPOINTS:
Entry-level 90600
Target Area 93600
Target Area 96000
Stop loss point 87500
Support area 89000/90000

Bitcoin dropped as planned. Wait for a new range to take SHORTBitcoin dropped as planned. Wait for a new range to take SHORT
global trnedi si still down
at this moment big liqudation had happend that's why price could create a range before new down move

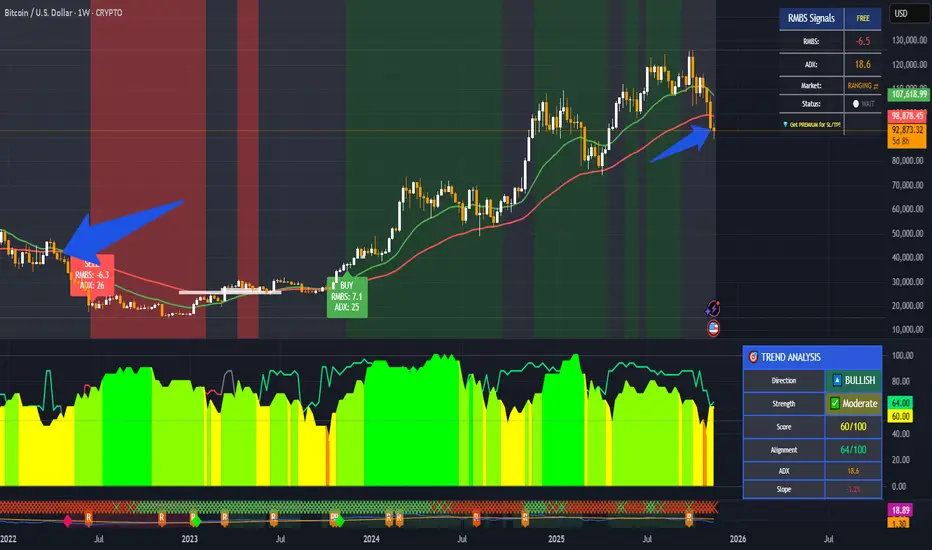
BTCUSD - Bear Run Began Looking at this indicator on chart price shows the red area which is normally hit during bull runs
however this time it was not hit, and price is just trending over the curve in the middle of this indicator.
I believe the bear run for bitcoin has begun and what we will see is sideways movement and downward movement.
Look to enter in the lower green zone when it hits there on this timeframe, Daily.
The price action in white is just an example of what movement downward could look like.

Bitcoin Next Move ? 108KWhy BTC Could Push Toward / Above $108K
Technical Setup
BTC is trading in a relatively tight range below the $107,500–$108,000 resistance.
Cycle & On-Chain Dynamics
Historically, Bitcoin bull cycles don’t peak immediately after a halving — this could mean room to run. Some analysts think we haven’t hit the top yet.
Some bullish chartists (e.g., “Titan of Crypto”) project a parabolic run if BTC clears $108K.
Is $108K A Realistic Next Move? Yes,

BITCOIN Next Weve Hello everyone, I hope you are all well
Today I will share with you my prediction for the next price movement of Bitcoin. I predict that the price has reached its all-time high. I previously shared an idea illustrating this; please review it below. I predict that we will see a final price rebound, as shown in the analysis, followed by a sharp drop to the targets outlined above.
This is not investment advice; please take full responsibility for your buying and selling decisions.
Warning: Be careful not to use this idea with leverage, as you could lose all your money

Bitcoin VS bearish crossAfter the bearish cross on the daily chart for Bitcoin, 75% of the time it has led to a bounce lasting 3–5 months, which triggers a rally in altcoins. This time we will probably see a nice altcoin rally until March 2026, IMO.
