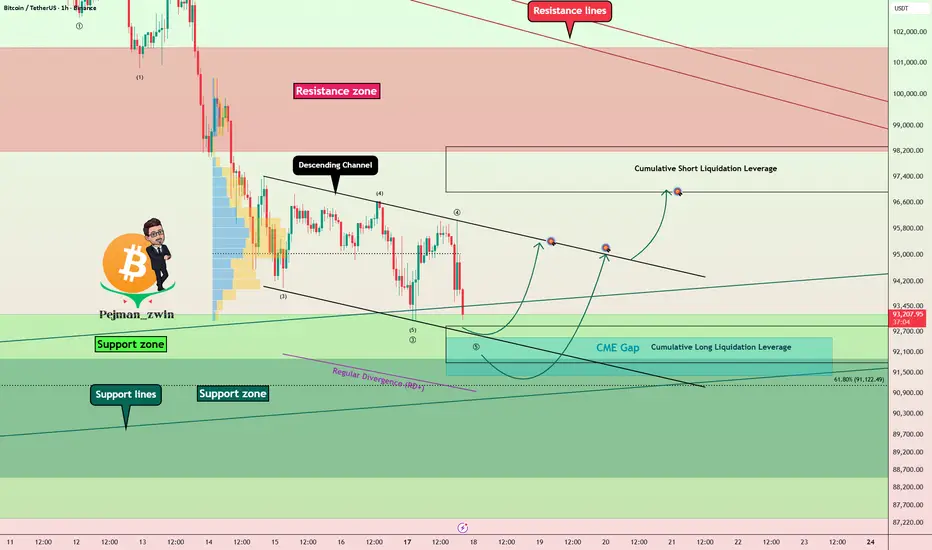
Bitcoin Roadmap: Major Support Ahead — Bounce or Breakdown?As expected in the previous idea , Bitcoin ( BINANCE:BTCUSDT ) has dropped to $93,040(Target done) .
The question now is whether Bitcoin will continue its downward trend or not.
Currently, Bitcoin is moving near the Support zone($93,200-$87,340) and key Support lines .
From the perspective of Elliott Wave Theory , Bitcoin seems to be completing Wave 5 , with the Wave 3 being extended .
I expect Bitcoin to start rising again by entering the Cumulative Short Liquidation Leverage($92,869-$91,763) and possibly from the lower line of the descending channel.
There is a possibility of a fake breakout , but be careful of the momentum of the decline.
First Target: $95,297(near the upper line of descending channel)
Second Target: $96,831
Stop Loss(SL): $90,727
Points may shift as the market evolves
Cumulative Long Liquidation Leverage: $98,338-$96,913
CME Gap: $92,525-$91,415
Note: Since Bitcoin has had a high correlation with the S&P 500( SP:SPX ) recently, and if the S&P 500 continues to decline, we can expect Bitcoin to follow suit.
Another important note is that rising tensions between the U.S. and Venezuela could also impact the crypto market, so we should keep that in mind.
Where do you think Bitcoin’s correction will go?
Please respect each other's ideas and express them politely if you agree or disagree.
Bitcoin Analysis (BTCUSDT), 1-hour time frame.
Be sure to follow the updated ideas.
Do not forget to put a Stop loss for your positions (For every position you want to open).
Please follow your strategy and updates; this is just my Idea, and I will gladly see your ideas in this post.
Please do not forget the ✅' like '✅ button 🙏😊 & Share it with your friends; thanks, and Trade safe.
Bitcoinanalysis
BTC/USD: Sell Pressure Building AgainBTC/USD: Sell Pressure Building Again
Market Summary
BTC/USD continues to operate within a declining market environment where sell-side pressure remains dominant. The recent recovery attempt has shown limited strength, forming only a temporary corrective phase within a broader downward cycle. Current conditions indicate that the market is preparing for another bearish continuation as liquidity builds on the upper side.
Market Behavior
The chart highlights a consistent pattern of declining impulses followed by shallow recoveries. Each upward phase has been met with swift rejection, reinforcing the dominance of bearish sentiment. The mid-range compression visible in the current structure reflects a controlled environment where market participants are redistributing positions rather than initiating larger upward transitions.
Momentum remains weak on the upside, and overall flow continues to align with the prevailing sell-side direction. Repeated structure shifts earlier in the sequence indicate that sellers are maintaining control of directional movement.
Current Setup
BTC/USD is now approaching a zone historically associated with short-term manipulation and liquidity grabs. Price appears to be forming a tight consolidation while climbing into this region. Such behavior often precedes a sell-side continuation, especially when rallies fail to show progressive expansion.
The chart projection suggests a likely formation of a distribution-style sequence before a renewed downward movement. This scenario aligns with the market’s broader behavior over recent sessions

Is BITCOIN in a DIP OF DOOM or Are the Bears having Fun ?
This is a Crunch time for Bitcoin and Many people Are running scared.
Me, I am sitting tight, NOT selling.
In Fact, I am BUYING
Why ?
Because we are Still in Channel and Above a long Term line of support.
Lets have a Look.
There are two major lines we need to pay attention to...The BLUE ARC that has rejected Every Bitcoin ATH since the beginning and the Line of support that was created in 2011.
And the problem we have right now, is that PA is getting Squeezed between the Two.
PA MUST React.
You can see how tight it is getting and PA is nearly on the lower trendline.
Lets look closer
Same chart as a Weekly chart
See how that Blue Arc has rejected PA and how the White long term support has supported PA>
And it is THIS image of this chart that Give me Hope.
A number of things to note here.
Most importantly is that the Bulls DID break over that Blue Arc once. This shows intent to do so. That was the First time that line of resistance has ever been broken.
And PA was Overbought when it did so and so we did not have the strength to remain above.
PA has retreated and as a consequence, PA is now Oversold.....and with in striking distance.
PA has the strength to attack that Blue Arc again and WIN
PA is currently on the 0.5 Fib Retracement
Should this support fail, we will Visit 89700 on the 0.618 retrancement. But that will only happen if we fall through a line of Support that HAS NEVER BEEN CROSSED
For Me, I remain VERY BULLISH
This is a Dip of Doom and has scared people but we are near the end....So long as we remain above that line of support, I remain positive.
As I mentioned at the beginning of the month, I am expecting this month to close RED but then we Rise....Have a look at the Month Candle Colout chart post.....all will be explained.
Stay safe

Bitcoin: Liquidity Void Signals Potential DeclineFenzoFx—Bitcoin dipped below $99,000.00 as expected and now trades near $95,630.00. Friday’s selloff created a bearish fair value gap, viewed as a liquidity void.
Technically, price is expected to revisit resistance between $96,700.00 and $99,000.00. If the gap remains partially unfilled, especially in its upper half, further downside is likely. In this scenario, Bitcoin’s next bearish target could be $90,000.00. The bearish outlook remains valid while price stays below $108,800.00.

Support and resistance key guide (Volume, Trendlines, FVG, MA)Support and resistance key guide (Volume, Trendlines, FVG, MA)
1️⃣ Importance of Support and Resistance in Highly Volatile Crypto Markets
The cryptocurrency market operates 24/7/365, exhibiting far greater volatility than traditional financial markets. This volatility presents substantial profit opportunities, but it also triggers intense fear and greed among investors, creating significant psychological stress.
Support and resistance serve as key milestones in this chaos, signaling zones where price reactions are likely. Beyond mere technical analysis, they reflect the collective psychology of countless traders. Understanding them is essential for success in crypto trading.
2️⃣ The Nature of Support and Resistance and Their Psychological Basis
Support and resistance occur where buying and selling pressures strongly collide, slowing or halting price movement.
Support:
At this level, buyers see the asset as "cheap enough!" and stand ready, forming a psychological and physical barrier against further decline. Additionally, traders previously trapped in losing positions may sell at breakeven, adding resistance against further drops.
Resistance:
At this level, sellers perceive the asset as "expensive enough!" and offload positions, while traders previously trapped at highs may sell with a "better late than never" mindset, limiting upward movement.
※ Meaning of Support/Resistance Breakouts and “Fakeouts”:
When a support level is breached, existing buyers may panic and trigger stop-loss selling. Conversely, breaking resistance may prompt buyers to enter, accelerating the trend.
However, some breakouts can be “fakeouts,” designed to exploit trader psychology. Premature chasing of such moves should be avoided.
3️⃣ Key Support and Resistance Pattern Analysis
📈 Trendlines and Consolidation Zones: The Psychology Behind Market Order
Trendlines: Trendlines visually represent the shared expectation among traders that price will move in a certain direction. Touching an upward trendline triggers “buy at a bargain” psychology, while touching a downward trendline triggers “it can’t go higher” sentiment.
Consolidation Zones (Boxes): These are zones where buying and selling pressures balance each other. Traders plan trades around these zones, dominated by the “waiting for breakout” psychology to capture significant moves.
📈 FVG (Fair Value Gap): Market Inefficiency and Smart Money Footprints
FVGs occur when the market moves too rapidly through a price range, leaving a “price gap.” They often reflect sudden activity by smart money (institutions, whales).
Gap Filling:
Markets instinctively avoid leaving incomplete states (FVGs) unaddressed. When price re-enters an FVG zone, the players who drove the prior rapid move may close or re-enter positions, forming support/resistance. Beginners can treat FVGs as smart money footprints and follow their activity strategically.
📈 Moving Averages (MA): Collective Psychology and Trend Direction
Moving averages reflect the average price perceived by the market over a period. Being widely monitored, they act as psychological support/resistance levels.
Short-term MA (e.g., 50MA): Reflects short-term trader sentiment. Price below it can trigger “short-term trend broken?” anxiety, while above it fosters optimism.
Long-term MA (e.g., 200MA): Represents long-term trader psychology and trend direction. Price below 200MA creates fear of a long-term downtrend, while above inspires hope of a sustained uptrend. When acting as support/resistance, MAs carry strong psychological consensus as a widely observed benchmark.
📈 POC (Point Of Control) Volume Profile: Market Consensus and the Power of Volume
POC is the price level with the highest traded volume over a period. It indicates market agreement on price, with substantial volume concentrated there.
Price below POC: POC becomes strong resistance. Buyers trapped in losing positions may sell at breakeven, and sellers actively resist upward moves.
Price above POC: POC acts as strong support. Buyers believe “price won’t fall below this level,” and prior sellers may switch to buying.
POC represents the market’s “expected price” and the zone where loss-aversion psychology is strongest.
📈 Fibonacci: Natural Order and Human Expectation
Fibonacci retracements apply golden ratio mathematics to charts, reflecting the expectation that price will reverse at certain levels, forming support/resistance.
These levels are not coincidental; many traders plan trades around them, causing real market reactions.
Levels like 0.5 (50%) and 0.618 (61.8%) are psychologically significant, viewed by traders as buying or selling opportunities. Support/resistance forms through “herd psychology,” as many act in unison.
📈 CME Gap: Institutional Moves and Market Regression Instinct
CME gaps occur in Bitcoin futures dominated by institutional investors. They happen when the spot market moves over weekends while futures are closed, and the market tends to “fill the gap.”
Gap Filling: CME gaps represent periods without institutional activity, prompting the market to normalize these “abnormal” price zones.
Traders anticipate “the gap will eventually be filled,” making these zones potential strong support/resistance, reflecting future-oriented market psychology.
4️⃣ Managing Trading Psychology Using Support and Resistance
Even the best tools are ineffective without psychological discipline.
Confirmation bias and stop-loss discipline: Ignoring losses due to selective perception leads to ruin. When support breaks, acknowledge your prediction was wrong and act decisively to exit.
Overbought/oversold psychology and FOMO:
Avoid chasing price surges out of fear of missing out (“everyone else is profiting, why not me?”).
During crashes, resist panic selling at the bottom. Base trades on your rules derived from support and resistance.
Partial trading for risk management:
Avoid buying all at support or selling all at resistance at once. Splitting trades across multiple support/resistance levels provides psychological stability and reduces the impact of wrong predictions.
5️⃣ Comprehensive Strategy Formation and Practical Application Tips
Multi-level Support/Resistance Confluence: Overlapping zones (e.g., Fibonacci 0.618 + 200MA + POC + FVG bottom) create very strong support/resistance. These reflect collective trader agreement and can be traded with higher confidence.
Volume Analysis and Support/Resistance Strength: High volume at a zone confirms its significance. Reliable breakouts require strong volume, showing market participation and intent.
Develop Your Own Trading Plan: Don’t blindly follow all patterns. Choose indicators and methods that suit you to establish personal trading rules. Adhering to these rules maintains psychological stability and long-term success.
If you found this content helpful, please show your support with a Boost (🚀) and a comment (💬)! Your encouragement is a great motivation for us to create better analyses and content. You can also follow us to receive notifications about new posts.
Bitcoin Faces the Death Cross — More Pain Ahead?Considering Bitcoin ( BINANCE:BTCUSDT )’s recent movements over the past few days and the Death Cross will happen to BTC, I’ve decided to focus on a daily time frame for today’s analysis. Given the recent events in the U.S. market, especially the sharp decline in the S&P 500 ( SP:SPX ), it’s likely that this downward trend will continue .
What is a Death Cross?
A Death Cross occurs when the 50-day moving average crosses below the 200-day moving average, often signaling a potential bearish trend.
At present, Bitcoin broke the important weekly Support lines and is now breaking a critical Support zone($101,500-$98,200) .
Moreover, considering the correlation with the S&P 500 index, and the fact that the U.S. indices are beginning to recover, it’s unlikely that Bitcoin will decouple from this trend. Therefore, we can anticipate further decline in Bitcoin as well .
Additionally, the rising USDT.D% ( CRYPTOCAP:USDT.D ) is breaking through resistance levels, which can lead to further selling pressure in the crypto market .
In summary, I expect Bitcoin to lose its current Support zone($101,500-$98,200) soon and move towards the Cumulative Long Liquidation Leverage($93,300-$91,300) .
Note: In these times, it’s crucial to maintain strict risk management, as Bitcoin’s volatility has increased. It might also be wise to consider higher time frames for trading to better navigate this complexity.
First Target: $95,720
Second Target: $93,040
Stop Loss(SL): $106,000
Cumulative Short Liquidation Leverage: $112,590-$111,459
Please respect each other's ideas and express them politely if you agree or disagree.
Bitcoin Analysis (BTCUSDT), Daily time frame.
Be sure to follow the updated ideas.
Do not forget to put a Stop loss for your positions (For every position you want to open).
Please follow your strategy and updates; this is just my Idea, and I will gladly see your ideas in this post.
Please do not forget the ✅' like'✅ button 🙏😊 & Share it with your friends; thanks, and Trade safe.

A Revivisit to the 2017 ATH BITCOIN Fractal and current PA.
With the possibility that we HAVE Topped this cycle, I thought I would go back to an old chart I was posting for most of 2023, 2024 and early parts of 2025
The way Bitcoin was following the 2013 - 2017 ATH Fractal was uncanny.
True that PA dived deeper than the Fractal in 2022 but it still followed the same angle of decent, despite pressure from Institutional banking systems to crash it.
And in Early 2025, Bitcoin PA decoupled from the Trajectory of the Fractal and has pretty well Ranged horizontal in a Range of 80K to 120K ever since.
But what I just saw was this.
The Current ATH was set on the same week as the projected Fractal ATH Date
THAT is very interesting to me.
What does it signify ?
No idea but it may be worth knowing this.
One other thing to add to this is simply how PA has dropped below the 50 week SMA ( RED ) for the first time this run and it has usually been support.
This week is not over and we may see PA push higher and make this push down just a Wick on a weekly candle But I feel this is not going to happen.
For now, I am remaining neutral as to the next steps to take.
I am remaining Bullish that Bitcoin Will push a lot higher in December and January because I currently believe the traditional cycles are broken
BUT this may be just wishful thinking.
Statistically, We HAVE past the date for Cycle Top on many charts using day counts
But it just does not feel right
So I wait. Time Will Always tell

BITCOIN is still bearish (4H)After accumulating a large liquidity pool, as shown on the left side of the chart, the price has entered a bearish trend.
Within the supply zone, we expect the price to move downward again after collecting liquidity from the order blocks.
The targets are marked on the chart.
A daily candle closing above the invalidation level will invalidate this outlook.
Do not enter the position without capital management and stop setting
Comment if you have any questions
thank you

Technical analysis of bitcoin key levels and wedge chart pattern1. Trend Structure
The descending trendline (Resistance line) at the top of the chart remains valid.
The price has repeatedly faced rejection at this level, indicating that the medium-term downtrend is still intact.
2. Key Price Levels and Indicators
50-week EMA
The price has recently recorded its third downward break below the 50-week EMA.
From a traditional technical perspective, this is viewed as a signal that strengthens the possibility of a medium- to long-term bearish shift.
POC (Point of Control)
The mid-range POC is acting as a strong supply zone,
and recent rebound attempts have also failed to break above this level decisively.
3. Liquidity Zones
Two major liquidity zones are marked in the upper and mid sections of the chart.
Liquidity zone near 112k (upper zone)
A cluster of large liquidity pockets and liquidation points
If a short-term rebound occurs, this is the first upside target likely to be tested
Liquidity zone near 102k (mid zone)
Overlaps with the 4h FVG, making it a level closely watched by both buyers and sellers
4. FVG (Fair Value Gap)
Multiple FVGs are present on the 4-hour timeframe, with some already filled.
Unfilled FVGs have a high probability of being revisited as the market corrects in the future.
5. CME Gap
All weekday CME gaps have already been filled and may act as short-term resistance.
A weekend gap forms when Monday’s CME opening price starts above 95.4K.
6. Current Market Structure Interpretation
The price is currently attempting a rebound from the lower boundary of the downtrend.
However, several resistance layers overlap—POC, FVG zones, and trendline resistance—raising the likelihood of heavy selling pressure on any upward move.
In the short term, volatility consolidation is expected within the 96k–100k range.
7. Potential Formation of a Lower Wedge Pattern
The price has broken below the lower boundary of the wedge pattern, accompanied by rising volume.
A short-term rebound is likely, and if the price re-enters the wedge, further upside momentum may follow.
If the lower trendline is not reclaimed, the structure may shift into a range after a retest.
8. USDT.D Chart Analysis
The price has once again touched the upper boundary of a downtrend line that has persisted for over a year.
Downward pressure on the USDT dominance chart suggests potential upward momentum for Bitcoin.
Technically, this zone offers conditions supportive of a short-term rebound.
9. Summary
The medium-term trend remains bearish, with the ongoing breakdown below the 50-week EMA reinforcing a sustained bearish outlook.
A short-term bottoming attempt is visible, but dense supply overhead limits the strength of any rebound.
FVGs, POC, and liquidity zones overlap near the current price region, increasing the probability of heightened volatility.
If you found this content helpful, feel free to support with a boost (🚀) and a comment (💬).
Your encouragement helps drive better analysis and more valuable content.
Follow the page to receive notifications (🔔) for future posts.

Very Simple BITCOIN Daily - Hope for the weekend existsThis is a chart I posted some weeks ago, showing the possiblr results of the classic W pattern printed by Bitcoin
We seem to be playing this out and so a Low, ultimate low of around 88K exists and I will not do anything till we pass that point, IF we pass that point.
And the MACD gives us hope that we may not do so
MACD has reached the lower trendline of its descending channel and at the same time, has reached the LOW in Oversold, that Bitcoin bounced off previously
This is not a Guarantee but it does certainly offer hope for some recovery....and we would have to wait and see if that is sustained or not.
But this IS playing out Exactly to plan and has confluence with what I said may happen at the beginning of the month
For me, this is NOT the END.... but near the beginning of the next push
BUY BITCOIN

Bitcoin Roadmap => Short-termOver the past few days, Bitcoin ( BINANCE:BTCUSDT ) has been reacting quite sharply to recent news, showing some unexpectedly strong moves. So, first and foremost, it's a good idea to keep risk management in mind and be prepared for various scenarios .
At the moment, Bitcoin is approaching a Support zone($102,000,980-$96,880) , a Potential Reversal Zone (PRZ) , and a Cumulative Long Liquidation Leverage($99,900-$98,188) .
From an Elliott Wave standpoint, it appears that Bitcoin is completing a Zigzag correction(ABC/5-3-5) .
I expect that from this Potential Reversal Zone (PRZ) and the Cumulative Long Liquidation Leverage($99,900-$98,188) , Bitcoin might start rising again and could potentially reach around $105,171(First Target) .
Second Target: $107,291
Stop Loss(SL): $98,797
Cumulative Short Liquidation Leverage: $108,582-$106,850
Cumulative Short Liquidation Leverage: $112,590-$111,459
Please respect each other's ideas and express them politely if you agree or disagree.
Bitcoin Analysis (BTCUSDT), 1-hour time frame.
Be sure to follow the updated ideas.
Do not forget to put a Stop loss for your positions (For every position you want to open).
Please follow your strategy and updates; this is just my Idea, and I will gladly see your ideas in this post.
Please do not forget the ✅' like '✅ button 🙏😊 & Share it with your friends; thanks, and Trade safe.

Bitcoin is Still Bearish (12H)Bitcoin still looks bearish | it seems to be inside wave C, and this upward move could be aimed at collecting sell orders and liquidating part of the short positions held by retail traders.
From the yellow circle, the price could get rejected toward TP1 and TP2.
Let’s wait and see what happens.
For risk management, please don't forget stop loss and capital management
When we reach the first target, save some profit and then change the stop to entry
Comment if you have any questions
Thank You

BTC Sell/Short Setup (1H)Bitcoin appears to be forming a bearish triangle, which is considered a continuation pattern in this timeframe.
We have identified two potential entry zones for a sell/short position.
We are looking to enter within these two areas.
The invalidation level serves as our stop; if it’s hit, this setup will be invalidated.
Targets are marked on the chart.
For risk management, please don't forget stop loss and capital management
When we reach the first target, save some profit and then change the stop to entry
Comment if you have any questions
Thank You

BTC/USD: Testing Key Support (M/FVG) After Strong DowntrendKey Observations
Downtrend: The price has been moving lower, defined by the downward-sloping black trendline, indicating a period of bearish momentum.
Break of Structure (BOS): A "BOS" (Break of Structure) label is placed below a recent low, confirming the continuation of the bearish structure as the price moved lower.
Current Support Zone: The price is currently testing a significant support zone (the grey rectangular box) around the $96,000 - $98,500 area. This level appears to be a historical reaction zone.
Market Structure/Fair Value Gap (M/FVG): The support zone is also labeled as "M / FVG" (Likely Mitigation or Market Structure combined with a Fair Value Gap), suggesting this area holds significance for potential institutional/smart-money activity.
Future Scenarios (Projected Paths):
Scenario 1 (Black Arrow): The main projected path shows a potential bounce/reversal from the current support zone, aiming to push the price higher. This suggests a buy/long opportunity might be imminent if the support holds.
Scenario 2 (Curved Arrow): The alternative (and often less-likely, as it's secondary) projection suggests a continuation of the downtrend after a potential minor bounce or consolidation, indicating a break below the support zone and further declines.

Bitcoin Daily back in a Squeeze - WILL react by Nov 25th but....
And there we have it, A Working chart
"Oh No, Lots of lines" I hear you cry
But every one has relevance.
The Lines descending from left to Right are Fib Circles, Nearly Always resistance and the RED ones are 236 Fib circles....Normal rejection almost guaranteed.
You can see the current ATH got rejected off the 6.768 Fib extension and a 236 Fib circle.
So far, we have fallen through a number of Fib Circles and have found support on the 5.236 Fib extension
This has also put us under pressure from the next Fib circle and so, we are in a Squeeze that has an apex on 25th this month.
This is likely rejection
This all adds confluence to what I said at beginning of the month in my Monthly Candle colour report, that does point towards a stronger likelihood of a RED close for November,
But a Green December should Follow.
Back to this month
The Arrow points towards where I think we will land and find support IF we loose the current level.
That would be around 95K on the 5 Fib extension. It also happens to be just above the next 236 Fib circle,
Bur more importantly, that dashed line is a long Term support that has support PA previously.
see below
I removed the Fib circles for clarity
You can see how that dashed line was support, as has the 5 Fib extension.
While we are here, Take Note of the horizontal 3 & 6 Fib extensions ( bold )
And see the earlier version here.
See how the 3 rejected the 2021 ATH line, the 1 supported the bounce in 2021 and the 0.236 rejected the 2017 ATH
On this cycle, that 3 fib line was the 2024 line of rejection ( PA went over and below but always in that field )
The 2025 Run has been around the 6.
I think we could reach up to the 9 over the course of the next 12 months.
"WHAT ???" "End of 4 year cycle means we fall into a BEAR doesn't it?"
I have a feeling that this may not happen. Things are VERY different this time......and there are plenty of reasons why we simply CANNOT pull back 80% from here...all mentioned in previous posts
But I do believe November WILL close RED....But DO NOT PANIC -> BUY
The Bull Run will start again in December

TIME TO LONG BITCOIN (READ BELOW) Hey traders!
Here again. Since my last analysis a lot of things happened in $BTC. I've been shorting Bitcoin since 110 - 115K as you saw on my last analysis and now I think it's time to shift to a more bullish idea.
The last tho months were tricky. USA shutdown, liquidity contraction.. all the indicators led me to the bearish way. I'm not gonna lie, I thought all those liquidity tensions could blow up the entire markets on a mid term ( 1 - 5 months).
However, since the government is about to reopen again ( liquidity incoming) and the REPO MARKET seems to be healed from those FED massive injections, I decided to take the risk and try to profit from a bullish momentum.
What am I expecting?
One of my first targets are 110K on short term ( incoming days). Then I will close 10 - 20 % of my longs. After that, if martkets allows, another 30% will be closed above 116k level. The rest... ATH?
1st target - > 110K
2nd - > 116K
3rd -> ATH
Don't overtrade and staf saye. Momentum could shift anytime soon.

Bitcoin price forecast, short-term BTC chart analysisResistance line: Represented by a red diagonal line indicating a downtrend, suggesting that the price may struggle to break above this level.
Support line: A green horizontal line at the bottom of the chart, marking the support area where a recent W pattern formed, currently around 99K.
CME gap: Highlighted in yellow at the center of the chart, representing a short-term resistance area.
Parallel channel: Formed by two gray diagonal lines, illustrating the range within which the price is likely to move.
POC (Point of Control) line: A red line cutting across the center of the chart, representing the price level with the highest trading volume. Currently around 110,000 USDT, it can serve as a key support or resistance level.
Liquidity zone: The area where the POC line near 110,000 USDT overlaps with the upper boundary of the parallel channel, indicating a zone of highest expected liquidity. This is where short stop losses and long take profits are likely to cluster.
Predicted path: Shown in green, suggesting the price may bounce off the support line, rise along the parallel channel, break through the CME gap, and move toward the liquidity zone. If it breaks the red resistance line, the ascent toward the liquidity zone could accelerate.
Conclusion: Bitcoin is expected to gradually rise as it overcomes resistance levels, ultimately reaching the high-liquidity zone around 110K–112K. This analysis is based on current market conditions, and actual price movements may differ due to various market factors.

Big Catalysts Behind Bitcoin’s Pump – Can BTC Hit $110K?Bitcoin ( BINANCE:BTCUSDT ) started pumping yesterday as I expected in my previous idea . Let's take a look at the fundamental reasons for Bitcoin .
Why the sudden BTC pump? Here are the 3 BIG catalysts hitting at once:
1-US Government Shutdown officially ending tomorrow (Nov 12)
Senate finally reached a budget deal. Treasury General Account (TGA) will start draining → hundreds of billions in fresh liquidity flooding markets. Same thing that ignited the 2020-2021 bull run.
2-Trump’s “Tariff Dividend”
President promised every American adult at least $2,000 from tariff revenue (potentially $400B+ total). Last time we got $1,200 stimulus checks, BTC went from $7K → $69K. Do the math.
3-Short squeeze + ETF flow reversal
Despite last week’s $1.22B ETF outflows, today we’re seeing fresh bids stacking. Bears who shorted the dip are now fuel for the rocket.
------------------------------------------------------------------------------
Let's take a look at Bitcoin’s technical analysis on the 1-hour timeframe .
Right now, Bitcoin is trading around a Resistance zone($107,600,980-$106,100) , and it looks like it might be forming a potential ascending channel , though the second top of that channel isn’t confirmed yet.
My expectation is that after a brief pullback to the Support zone($104,840-$103,600) —where there’s also Cumulative Long Liquidation Leverage($105,311-$104,111) —Bitcoin could start rising again and attempt to break through the Resistance lines. If BTC manages to break above those Resistance lines, then the next target could be around $110,000 .
Cumulative Long Liquidation Leverage: $99,865-$98,168
Cumulative Short Liquidation Leverage: $112,590-$111,459
New CME Gap: $104,565-$104,160
So what do you think? Can Bitcoin push up to $110,000, or will it turn back down again?
Note: These days, the market can be pretty volatile and unpredictable, so always remember to manage your risk and stick to your risk management strategy.
Please respect each other's ideas and express them politely if you agree or disagree.
Bitcoin Analysis (BTCUSDT), 1-hour time frame.
Be sure to follow the updated ideas.
Do not forget to put a Stop loss for your positions (For every position you want to open).
Please follow your strategy and updates; this is just my Idea, and I will gladly see your ideas in this post.
Please do not forget the ✅' like '✅ button 🙏😊 & Share it with your friends; thanks, and Trade safe.

What is bitcoin CME Gap? How to use BTC gap IndicatorWhat is bitcoin CME Gap? How to use BTC gap Indicator
The 'Gap' in the CME (Chicago Mercantile Exchange) futures market, which offers a glimpse into the movements of institutional investors, is one of the key indicators many professional traders watch closely.
1️⃣ What is the Bitcoin CME Gap?
CME is one of the primary avenues for institutional investors to access Bitcoin. However, the CME Bitcoin futures market closes over the weekend (from Friday afternoon to Sunday afternoon, Chicago time, USA). Additionally, there is a one-hour trading break after market close on weekdays.
Conversely, spot exchanges like Binance and OKX, which we commonly see, operate 24 hours a day.
This difference is where a 'Gap' occurs. Especially during weekends, when the break is longer, gaps tend to be larger.
Bearish Gap: Occurs when the opening price after the CME market closes is lower than the closing price. This means that the Bitcoin price fell in the spot market during the off-hours.
Bullish Gap: Occurs when the opening price after the CME market closes is higher than the closing price. This means that the Bitcoin price rose significantly in the spot market during the off-hours.
Abrupt Psychological Shift: This implies that investor sentiment leaned heavily towards one side during the weekend.
Unfilled Order Blocks: The gap area is interpreted as a region where potential unfilled orders (buy/sell pressure) may exist.
Gap Fill Phenomenon: Many traders believe in the adage "gaps get filled" and use it as a trading strategy. This suggests a tendency for the price to move in the opposite direction of the gap, eventually attempting to cover the gap area. However, this phenomenon is not 'mandatory', and whether a gap will be filled immediately or much later must be judged through various analyses.
2️⃣ Easily Find CME Gaps
The Bitcoin CME gaps multi-timeframe auto finder indicator automates CME candle analysis and displays it intuitively on the chart.
⚡Indicator Features and Usage
Multi-Timeframe Gap Detection: 5-minute, 15-minute, 30-minute, 1-hour, 4-hour, and even 1-day candles! It simultaneously detects and displays CME gaps occurring across various timeframes. Whether you're a short-term trader or a long-term investor, you can check gaps according to your trading style.
Automatic Box and Label Display: The detected gap areas are drawn as rectangular boxes on the chart. Bullish gaps are displayed in green tones, and bearish gaps in red tones, making them easy to identify at a glance. The size of each gap (%) is displayed as a label above its respective box.
Highlight Function: Large gaps above a set threshold (e.g., 0.5%) are highlighted with an emphasized color. 'Big gaps' can have a greater impact on the market, so they should be noted.
Chart Price Synchronization: The price of spot charts from other exchanges may differ from the CME futures price. This indicator adjusts the price of the gap boxes to the price level of the chart you are currently viewing via the "Chart_price" mode. By using the "Chart_price" mode, you can more intuitively grasp the price level of the gap box on the spot chart and make direct trading plans on the chart of another exchange you are viewing.
Real-time Alerts: You can receive real-time alerts when a new CME gap is detected. You can also set alerts to notify you only about gaps from a specific timeframe. This is extremely useful when you can't continuously watch the chart during weekends or specific times on weekdays.
3️⃣ Trading Strategies
💡Gap Fill Strategy:
When a Bullish Gap Occurs: If the price breaks above a bullish gap but then falls back into the gap area attempting to fill it, one might consider a long position near the bottom of the gap, or a short position if the price fails to rebound from the top of the gap. Alternatively, a strategy of considering a short position in a resistance zone before the gap is filled is also possible.
When a Bearish Gap Occurs: If the price breaks below a bearish gap but then rises back into the gap area attempting to fill it, one might consider a short position near the top of the gap, or a long position if the price fails to fall from the bottom of the gap. Alternatively, a strategy of considering a long position in a lower support zone before the gap is filled is also possible.
💡Utilizing as Support/Resistance Areas:
Old CME gap areas can act as strong support or resistance lines when the price retests those levels in the future.
Observe whether the price encounters resistance and falls again when it reaches the top of a bearish gap, or if it finds support and rises again when it reaches the bottom of a bullish gap. Gaps that overlap across multiple timeframes can hold even stronger significance.
💡Trend Confirmation and Reversal Signals:
If a strong bearish gap occurs and is not immediately filled, but the price continues to fall, this could indicate the start or continuation of a strong downtrend.
If a strong bullish gap occurs and is not immediately filled, but the price continues to rise, this could indicate the start or continuation of a strong uptrend.
You can use the price movement after a gap occurs to gauge market momentum and apply trend-following or trend-reversal strategies.
For example, if a bearish gap occurs but is quickly filled within a few days and breaks above the top of the gap, this could be interpreted as an early sign that the bearish market has ended.
💡Multi-Timeframe Analysis:
When looking for key support/resistance levels, check not only the gaps of the current timeframe you are viewing but also gaps from higher timeframes (e.g., 4-hour or daily gaps on a 1-hour chart).
Gaps from larger timeframes are areas of stronger market interest. When making trading decisions in smaller timeframes, consider the location of important gaps from higher timeframes for risk management or to set entry/exit targets.
Short-term Gaps (5m, 15m): Most gaps occur within 1% and can be utilized for short-term volatility, high-leverage scalping, or day trading. They are suitable for quick entry/exit strategies, with caution against whipsaws. They tend to be filled before the 4-hour candle closes after the market opens.
Medium-term Gaps (1h, 4h): Can be referenced for swing trading or position trading. They can become significant support/resistance areas depending on price movement after the gap occurs.
Long-term Gaps (1d): Can act as major turning points in market trends or as important support/resistance levels from a long-term perspective. If a 'big gap' occurs, the possibility of a shift in the market's overall direction should also be considered. They usually occur during the weekend off-hours, and sometimes large gaps of over 3% occur.
A weekday short-term gap that was filled 4 hours ago.
A weekend long-term gap that saw a trend increase after a 4% big gap occurred.
4️⃣ Conclusion
The 'Bitcoin CME Gap Multi-Timeframe Auto Detector' indicator is a powerful tool that helps you not miss crucial price fluctuation points in the market.
However, no indicator should be blindly trusted. Gaps may not be fully filled, or the price may immediately break out in the opposite direction after surpassing a gap. Instead of relying solely on gap filling, it is crucial to analyze it in conjunction with other indicators to increase your win rate.
We hope you utilize the information gained from this indicator and combine it with your existing analysis methods (chart patterns, auxiliary indicators, macroeconomic analysis, etc.) to build more sophisticated trading strategies.
📌If this content was useful, please support us with a boost and comments. Your small encouragement is a great strength for creating better analyses and content. By following, you can also receive notifications about our postings

Bitcoin Correction Eyes $108,800FenzoFx—Bitcoin rebounded from $99,300.00 and is now trading near $106,000.00. This upward move is likely a corrective phase, with potential to fill the liquidity void up to $108,800.00.
The equal lows at $99,326.00 remain vulnerable after repeated tests. We expect the downtrend to resume once BTC reaches the bearish fair value gap near $108,000.00. If confirmed, the next bearish targets are $100,000.00 and $90,000.00. The bearish outlook remains intact as long as the price stays below $116,576.00.

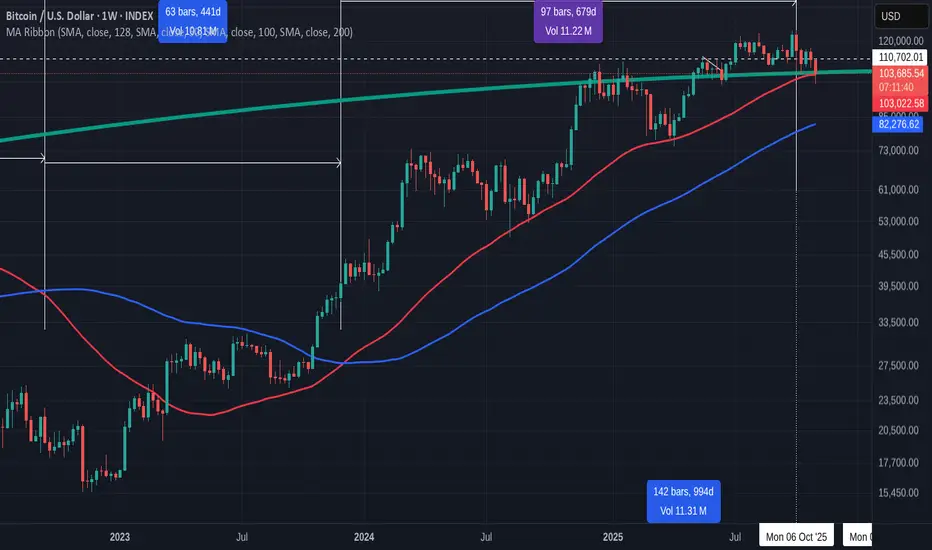
How important is This Weekly Candle close today ? VERY
Really simple to see.
On 2 previous occasions this cycle, were the PA has reached down and touched the 50 Week SMA (Red), it started the next week with a Push and followed with a Green week Candle.
Yesterday, PA dropped below that 50 SMA and today, it has risetn o sit on it, leaving a wick lower, like on the other occasions.
Zoomed in is easier to see
WE NEED TI KEEP THIS
This chart shows us two other things we should pay attentin to.
First is that the day count above is the expected point where the ATH is reached on a cycle, using the average of previous cycles, from when the 50 SMA rises above the 100 ( blue) and goes to ATH.
We had the current ATH Ver near this point.
Secondly, That Blue Arc is the Arc f resistance that has rejected EVERY ATH since BTC started.
We need to rise above this this cycle or PA will be driven down into Negativity, as shown below
I have NO DOUBT we can do this
But we need to start by keeping the PA above that 50 week SMA
All eyes on BITCOIN
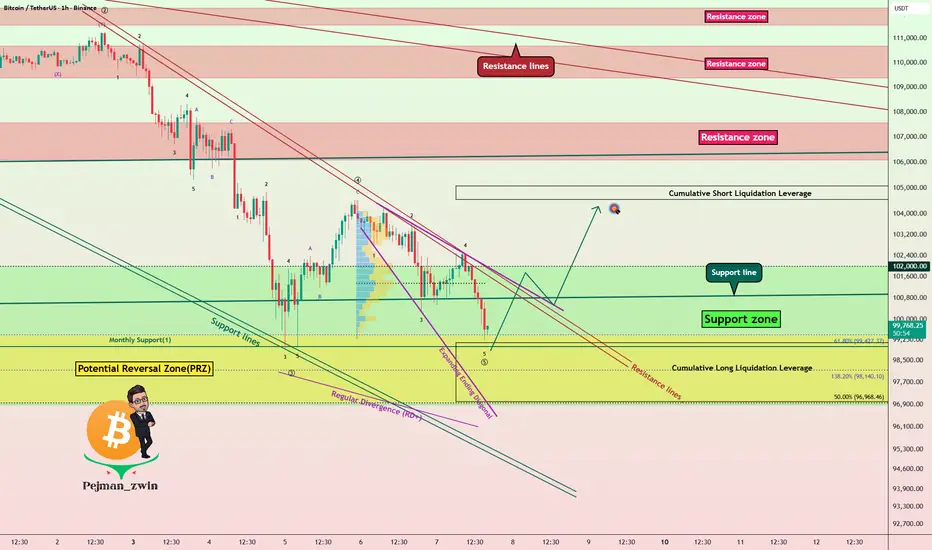
Bitcoin Bulls Defending $97K – Reversal Loading!Before diving into the Bitcoin analysis , it’s worth noting that Bitcoin has had a strong correlation with the SPX500 index ( SP:SPX ) in recent weeks. So, alongside analyzing Bitcoin, it’s a good idea to keep an eye on the SPX500 chart these days.
Currently, Bitcoin( BINANCE:BTCUSDT ) is moving in a Support zone($10200,980-$96,880) near a Potential Reversal Zone(PRZ) and a Cumulative Long Liquidation Leverage($99,145-$97,208) .
From an Elliott Wave perspective, it looks like Bitcoin is forming an Expanding Ending Diagonal to complete the microwave 5 of the main wave 5 .
Also, we can see a Regular Divergence(RD+) , which is a good sign of a potential reversal.
Given my expectation that the SPX500 Index will start to rise again, I also expect that Bitcoin will follow suit and could climb at least to around $104,200 .
Cumulative Short Liquidation Leverage: $105,074-$104,551
Stop Loss: $96,178
Please respect each other's ideas and express them politely if you agree or disagree.
Bitcoin Analysis (BTCUSDT), 1-hour time frame.
Be sure to follow the updated ideas.
Do not forget to put a Stop loss for your positions (For every position you want to open).
Please follow your strategy and updates; this is just my Idea, and I will gladly see your ideas in this post.
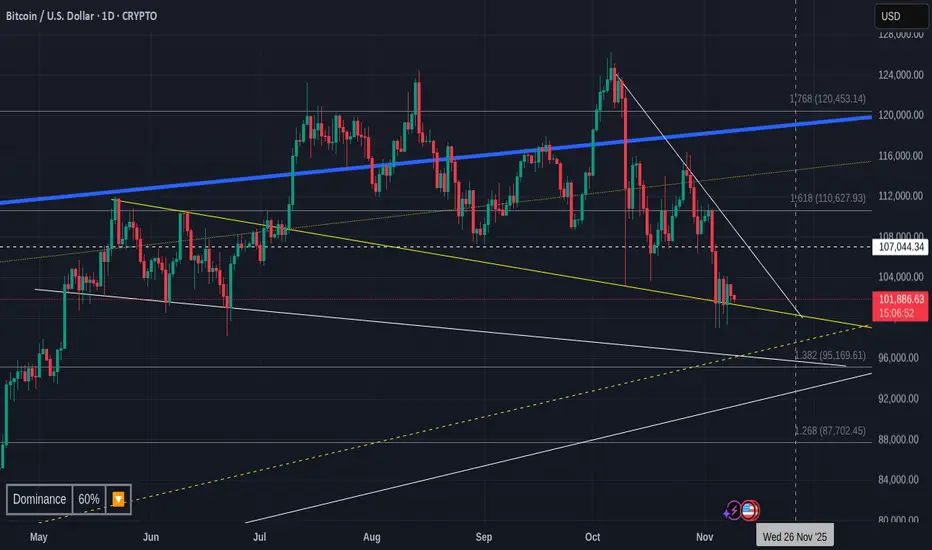
Bitcoin Trend lines tell same story as all the complicated TA
There are things to be said for complicated and highly technical TA using in dicators that read all the online data available.
But at the end of the day, Trend lines can very often tell you exactly the same thing.
The Chart above simply shows the lines of support and Resistance.
The Current line of support comes off a line made in May / June this year
The line of resistance comes from a line created in October this year
These 2 lines meet towards the end of the month and if PA remains between these 2 till then, that will create the expected RED month candle.
If we drop below this area, we arrive at 2 other trend lines that habe an intersection around 96K.
This is a Zone quoted by any analysts including myself, as an area of Make or Break.
But also nothe the line of support below that too....around 88K - 90K
This is also an area quoted by highlt technical indicators.
And just a quick Zoom out to see the whole picture.