Various things point to a Bitcoin Move higher within next 9 days
There are a number of simple things, basic YA, that points towards A Move from Bitcoin.
The Pennant being printed Right now, with PA squeezed between the 2.618 Fib and a Long Term line of rising Support, could be seen as Bearish
The rising line of support is Strong however and we last touched it back in April 2025 and bounced well.
We arrived there after a long sustained Drive by the Bears to push us down, as is the case right now.
If we zoom into the 4 hour, we see more detail
There is a sustained Ceiling (2.618 fib ) and each time PA gets rejected the Bulls step in and we now are working with in a decreasing Range.
But the Bears ARE in control right now and this is why we are were we are now.
PA being Squeezed and heading to an Apex.
PA Always reacts BEFORE the Apex and I expect the latest this could happen to be around the 17Th November.
But the MACD Always shows us another side, a trend formation.
Lets look at the Weekly first
So we see how the Weekly MACD is falling Bearish still and will likely do so until it meets its first line of support around.....17 November. See the Vertical blue cashed line on the PA 4 hour chart and then look where that is on this MACD chart
Then see the rising dashed line that previous MACD Lows seem to have bounced off.
NOTE, there is a possible inaccuracy here as trends require 3 touches to be Valid....This has had 2. So, we wait to see..........
Otherwise, the projected MACD arriving at Neutral is around 22 December......
The Daily MACD
The Fact that Naily MACD has not been this low for a Long time, also points towards a Move in the near future.
In fact, the last time MACD was this low, was March 2025, just beofre PA hit long Term Support and bounced....
Bitcoin Dominance is approaching a local line of support
Conclusion
While there are Bullish signs, it should be remembered, we can still drop lower while sentiment fall and the Rotation of Money towards ALTS gains momentum. But as had happened so many times this cycle, Things can turn VERY quick and if you are selling to Buy ALTS< Remain Very cautious
As mentioned in my monthly Candle colour report, I mentioned that November could close Red......But it may not.....it is honestly a very difficult market right now....
But one thing is Certain.. BTC PA will make a bigger move soon......We just do not know for sure, in which direction but for me, the odds are that it will go higher.
Time will tell
Bitcoinanalysis
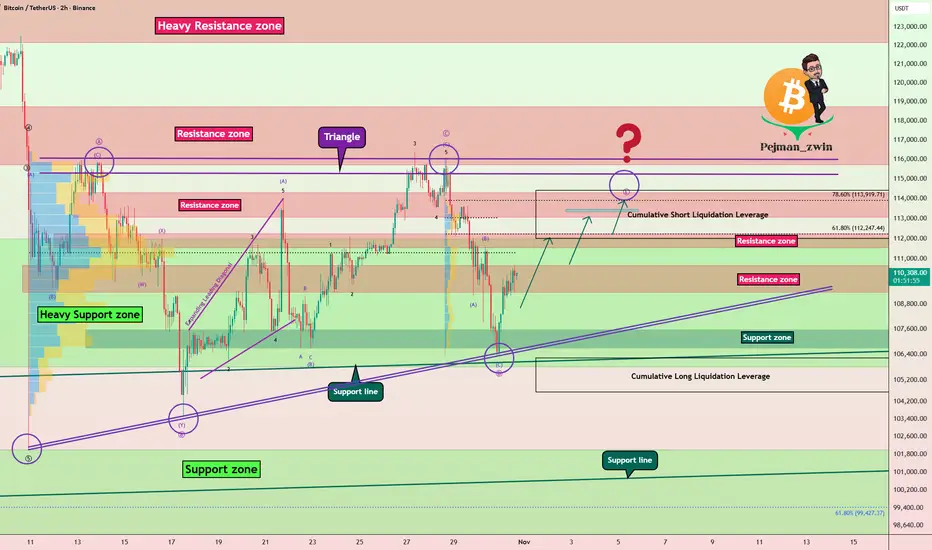
Bitcoin At Make-or-Break Zone – Long Setup Ahead?Bitcoin ( BINANCE:BTCUSDT ) is currently moving near a Heavy Support zone($111,980-$105,820) , Support lines , Potential Reversal Zone(PRZ) , and Cumulative Long Liquidation Leverage($106,432-$104,513) .
From an Elliott Wave perspective , it seems that Bitcoin might be completing the microwave 5 of the main wave C .
As long as Bitcoin does not break below that Heavy Support zone($111,980-$105,820) , we can still be hopeful about long positions . There's a chance of a fake break of the support lines, and then Bitcoin might bounce back from the PRZ and start rising again.
I expect that after touching the PRZ , Bitcoin could rise back up and move toward the Resistance zone($110,700-$109,380) .
Note: If the support lines break with high momentum, please do not enter a long position.
Cumulative Short Liquidation Leverage: $113,085-$111,444
Stop Loss: $104,420
Please respect each other's ideas and express them politely if you agree or disagree.
Bitcoin Analysis (BTCUSDT), 1-hour time frame.
Be sure to follow the updated ideas.
Do not forget to put a Stop loss for your positions (For every position you want to open).
Please follow your strategy and updates; this is just my Idea, and I will gladly see your ideas in this post.
Please do not forget the ✅' like '✅ button 🙏😊 & Share it with your friends; thanks, and Trade safe.

Market analysis using bitcoin dominance & usdt dominance chartsWe aim to conduct an in-depth analysis of the correlations among four key indicators used to interpret the complex dynamics and investor sentiment in the cryptocurrency market — Bitcoin Dominance, USDT Dominance, TOTAL3, and the Coinbase Premium — and to share insights on how these can be effectively utilized in real trading strategies.
By analyzing these four indicators together, traders can identify the overall market trend, gauge the vitality of the altcoin market, and assess institutional participation, which provides a foundation for developing mid- to long-term trading strategies.
First, please click Boost (🚀) so that more people can see this post.
💡Understanding the Key Indicators
Bitcoin Dominance: CRYPTOCAP:BTC.D
The ratio of Bitcoin’s market capitalization to the total cryptocurrency market capitalization.
It represents Bitcoin’s market strength relative to altcoins.
USDT Dominance: CRYPTOCAP:USDT.D
The ratio of Tether (USDT) market capitalization to the total cryptocurrency market capitalization.
It helps identify risk-on/risk-off sentiment among investors and assess the level of market liquidity.
TOTAL3: CRYPTOCAP:TOTAL3
The total market capitalization of all altcoins excluding Bitcoin (BTC) and Ethereum (ETH).
It directly reflects the overall momentum of the altcoin market.
Coinbase Premium Index: TradingView Indicator
An indicator showing the price difference of BTC between Coinbase and other major exchanges (e.g., Binance).
It is used to indirectly gauge institutional buying pressure (positive premium) or selling pressure (negative premium) in the U.S. market.
⚙️Interaction of Indicators and Trading Strategies
These four indicators exhibit specific patterns under different market conditions.
By analyzing them comprehensively, traders can identify medium- and long-term trading opportunities.
Correlation between BTC price and indicators:
BTC price vs BTC.D: Complex correlation.
BTC price vs USDT.D: Mostly inverse correlation (USDT.D rising = market uncertainty and BTC decline)
BTC price vs TOTAL3: Mostly Positive correlation (BTC rise = TOTAL3 rise)
BTC price vs Coinbase Premium: Mostly Positive correlation (sustained positive premium = continued BTC uptrend)
✔️Scenario 1: Bullish Phase📈 (Bitcoin-led Rally)
BTC.D rises: Capital concentrates into Bitcoin
USDT.D falls: Increased risk appetite, cash inflows grow
TOTAL3 moves sideways or slightly upward: Altcoins remain weak or unresponsive
Coinbase Premium rises and stays positive: Institutional buying inflow
Interpretation:
Strong institutional buying of Bitcoin drives the market, with capital shifting from stablecoins into BTC.
Altcoins may lag behind this movement initially.
Strategy:
If the Coinbase Premium remains positive even during minor BTC corrections, it favors building long BTC positions.
When the positive premium persists and BTC breaks key resistance levels, it can be interpreted as a strong buy signal.
During early stages, focus primarily on Bitcoin rather than altcoins.
✔️Scenario 2: Strong Bull Market📈 (Altcoins Join the Rally)
BTC.D declines: Capital rotates from Bitcoin to altcoins
USDT.D declines: Ongoing risk appetite and continuous inflows
TOTAL3 rises: Peak momentum in the altcoin market
Coinbase Premium remains positive: Continuous liquidity inflow
Interpretation:
As Bitcoin stabilizes or trends upward, capital starts flowing aggressively into altcoins.
The rise in TOTAL3 reflects broad-based strength across the altcoin market.
Strategy:
Select fundamentally strong altcoins and build positions gradually.
During this phase, large-cap and small-cap thematic groups may experience rotational pumps — monitoring related narratives is crucial.
✔️Scenario 3: Bearish Market📉
BTC.D rises: Altcoins fall more sharply as BTC declines
USDT.D rises: Strengthened risk aversion and increased cash positions
TOTAL3 declines: Deepening weakness in the altcoin market
Coinbase Premium drops and stays negative: Institutional selling or halted buying
Interpretation:
Heightened market anxiety leads investors to liquidate risk assets and move into stable holdings such as USDT.
Institutional selling pressure pushes the Coinbase Premium negative or maintains it in a downward trend.
Altcoins are likely to experience the greatest losses in this phase.
Strategy:
Reduce crypto exposure or convert positions to stable assets (USDT) for risk management.
During technical rebounds, consider trimming positions or cautiously taking short opportunities (with higher risk).
✔️Scenario 4: Sideways or Correction Phase
BTC.D moves sideways: Range-bound consolidation
USDT.D moves sideways: Persistent risk aversion and lower market volume
TOTAL3 moves sideways: Altcoin market remains flat or slightly weak
Coinbase Premium stable: Fluctuates between positive and negative values
Interpretation:
The market enters a wait-and-see phase with sideways movement or mild correction.
The Coinbase Premium’s neutrality reflects uncertainty in institutional capital flows.
Strategy:
Monitor BTC and TOTAL3 reactions at major support levels before re-entering positions.
It may be prudent to stay on the sidelines until clear institutional accumulation or positive catalysts emerge to restore sentiment.
🎯TradingView Chart Setup and Usage Tips
Multi-Chart Layout: Use TradingView’s multi-chart feature to display BTCUSDT, BTC.D, USDT.D, and TOTAL3 simultaneously for comparative analysis. (Apply Coinbase Premium as an additional indicator.)
Timeframes: For short-term analysis, use 1H, 4H, or 1D; for medium- to long-term, use 1W or 1M charts. Confidence increases when multiple indicators align across the same timeframe.
Trendlines and Support/Resistance: Draw trendlines, support, and resistance on each indicator chart to identify key inflection points. Breakouts on USDT.D or BTC.D often signal major market shifts.
Supplementary Indicators: Combine RSI, MACD, or other technical indicators to detect divergences or overbought/oversold zones for added precision.
⚡Analytical Value and Considerations
Comprehensive Market Insight: Analyzing all four indicators together enhances overall market understanding.
Leading vs Lagging Indicators: Coinbase Premium can serve as a leading signal, while dominance and market cap metrics act as coincident indicators reflecting current conditions.
Probabilistic Nature: These indicators are not predictive tools but should be interpreted within a broader context of market variables.
Risk Management: Always apply stop-loss measures and manage exposure carefully. Be prepared for deviations from expected market behavior.
🌍Conclusion
Bitcoin Dominance, USDT Dominance, TOTAL3, and the Coinbase Premium Index are fundamental components in decoding the complex structure of the cryptocurrency market.
Analyzing them in conjunction enables a deeper understanding of market sentiment, anticipation of upcoming opportunities and risks, and the development of a more intelligent and stable trading strategy.
💬 If you found this analysis insightful, share your thoughts in the comments!
🚀 Don’t forget to hit Boost to support the post!
🔔 Follow to make sure you don’t miss the next market insight!
How to use BTC Coinbase premium index indicator on tradingview1. What is the Coinbase Premium Index?
The Coinbase Premium Index is a metric that measures the price difference between a specific cryptocurrency listed on Coinbase and the price of Bitcoin on other major exchanges (especially Binance).
⌨︎ Calculation method:
(Coinbase BTC price - Other exchange BTC price) / Other exchange BTC price * 100
Positive premium: Occurs when the Coinbase price is higher than on other exchanges.
Negative premium: Occurs when the Coinbase price is lower than on other exchanges.
📌 If this content was helpful, please show your support with a boost and comments. Your encouragement is a great motivator for creating better analysis and content.
We will continue to upload various content such as chart analysis, trading strategies, and Bitcoin short-term signals, so please follow us.
2. Causes of Coinbase Premium
✔️ The main causes of Coinbase Premium are as follows:
Institutional investor demand: Coinbase is one of the largest regulated cryptocurrency exchanges in the U.S., and many institutional investors (hedge funds, asset management firms, etc.) purchase cryptocurrencies through Coinbase.
Large-scale buy orders from institutional investors can temporarily drive up prices on Coinbase, creating a premium.
Fiat currency inflow: Coinbase primarily facilitates USD-based transactions and is the most accessible platform for U.S. investors.
When new fiat currency flows into the cryptocurrency market, a strong inflow through Coinbase can lead to a premium.
Market sentiment and liquidity: If U.S. market investor sentiment is stronger than in other regions at certain times, or if liquidity on Coinbase is temporarily low, a price difference may occur.
Restrictions on fund movement: Due to anti-money laundering (AML) regulations, there may be time and cost restrictions on fund transfers between exchanges.
This limits arbitrage opportunities and helps maintain the premium.
Network congestion and fees: During cryptocurrency network congestion, transaction speeds may slow down or fees may increase, making rapid arbitrage between exchanges difficult.
3. How to Use the Coinbase Premium Index in Trading
The Coinbase Premium Index can primarily be used to predict market trends for major cryptocurrencies like Bitcoin (BTC).
📈 Bull market signal (positive premium):
Institutional buying inflow: A consistently high positive premium may indicate sustained buying pressure from institutional investors.
This can be interpreted as a signal of an overall market uptrend.
Trend reversal: If a negative premium persists in a bear market and then suddenly turns positive or its magnitude increases, it can be seen as a signal that a trend reversal is imminent, along with the inflow of institutional investors and improved market sentiment.
Bottom buying opportunity: If the Bitcoin price is falling and the Coinbase premium starts to rise above 0%, and at the same time, the daily net inflow into ETFs like BlackRock iShares Bitcoin Trust (IBIT) or Fidelity Wise Origin Bitcoin Trust (FBTC) significantly increases, this could signal a strong buying opportunity at the bottom.
📉 Bear market signal (negative premium):
Institutional selling pressure or decreased interest: A consistently low negative premium may indicate high selling pressure from institutional investors or decreasing interest in Bitcoin.
This can be interpreted as a signal of a market downtrend.
Bearish reversal signal: If a positive premium persists in a bull market and then turns negative or its magnitude sharply increases, it could be a top signal, indicating that institutional investors are taking profits or new buying inflows are decreasing.
Overbought/Correction signal: For example, if the Bitcoin price is soaring and the Coinbase premium turns negative, and at the same time, large net outflows are observed from ETFs such as BlackRock IBIT or Fidelity FBTC, it can be judged that the market is overbought or there is a possibility of correction, and a sell position can be considered.
4. Points to Note
🚨 When using the Coinbase Premium Index, pay attention to the following:
Combination with other indicators: The Coinbase Premium Index is just one auxiliary indicator.
A comprehensive judgment should be made by analyzing other technical analysis indicators such as moving averages, RSI, MACD, trading volume, as well as on-chain data and macroeconomic indicators.
Importance of ETF inflow/outflow data: Bitcoin spot ETFs from major asset managers such as BlackRock and Fidelity are one of the most direct indicators of actual institutional investor fund flows.
Analyzing these ETF's daily net inflow/outflow data along with the Coinbase premium can provide a more accurate understanding of institutional buying/selling pressure in the market.
Short-term volatility: The premium can fluctuate rapidly due to subtle changes in the market in the short term.
It is important to observe long-term trends rather than reacting too sensitively to temporary premium changes over a short period.
Changes in market conditions: The cryptocurrency market changes very rapidly.
There is no guarantee that patterns that were valid in the past will necessarily be valid in the future.
Various factors such as regulatory environments, policy changes of major exchanges, and the emergence of new market participants can affect the premium.
Limited scope of application: The Coinbase Premium Index tends to reflect the demand of institutional investors, mainly for Bitcoin. Its influence may be limited for altcoins.
5. Using the Coinbase Premium Index in TradingView
TradingView is a popular platform that provides various technical indicators and chart analysis tools. On TradingView, there are many custom indicators that can monitor the Coinbase Premium Index in real time.
These indicators usually calculate the price difference between Coinbase and Binance spot assets (e.g., BTCUSD/BTCUSDT) and display it in a separate panel at the bottom of the chart.
📊 TradingView indicator usage tips:
Search for indicators: Click the 'Indicators' button on the TradingView chart and type keywords such as 'Coinbase premium' or 'Coinbase vs Binance' in the search bar to find relevant indicators.
Real-time monitoring: These indicators retrieve real-time Bitcoin spot price data from Coinbase and Binance, calculate the premium, and visually display it on the chart. This allows investors to instantly confirm market price differences and incorporate them into their trading strategies.
Combination with other indicators: A powerful advantage of TradingView is that multiple indicators can be overlaid on one chart.
You can add the Coinbase Premium Index indicator along with the Bitcoin price chart, and if necessary, refer to BlackRock and Fidelity ETF inflow/outflow data separately to attempt multi-faceted analysis.
Alert settings: Use TradingView's alert function to set alerts when the Coinbase premium exceeds a certain level or enters/exits a certain range.
This helps to grasp market changes in real time and respond accordingly.
In conclusion, the Coinbase Premium Index is an indicator that can offer insight into the movements of institutional investors in the U.S. market, one of the major players in the cryptocurrency space.
When combined with Bitcoin spot ETF inflow/outflow data from major asset management firms such as BlackRock and Fidelity, it can significantly help to more clearly understand the actual flow of institutional funds and to judge market strength and the possibility of trend reversals.
However, rather than blindly trusting it, it is wise to use it as a supplementary tool to enhance a comprehensive understanding of the market by utilizing it with other analysis tools.

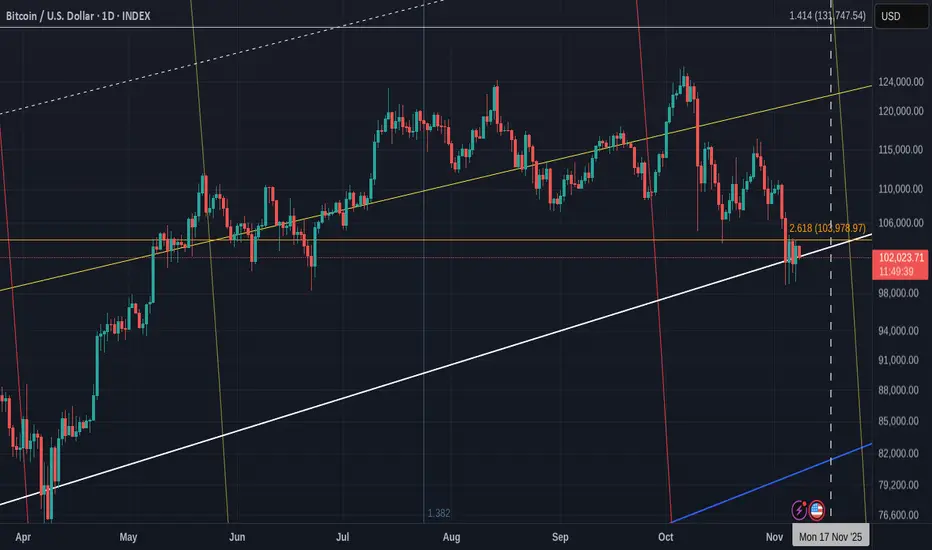
Quick Bitcoin Update - BTC entered a Squeeze. Needs to react
Simply, PA is now on a line of support that goes way back to 2017
PA Rose above it in 2019, COVID caused a Drop below but PA Recovered.
The 2022 Bear kept PA below for a Long Time but we broke back over.
And now, we test it again at te end of the 3rd Ranging period this Cycle.
There are things that Both Support and wtroy the idea that Oa can stay here and so we really do need to remain vigilant...
This Zoomed chart explains the situation clearly.
So we see, PA is now in a triangle, with the 2.618 Fib extension at around 103978, acting as resistance and the Long Term line f support mentioned above , as support.
This is a tight Squeeze. The Apex is around 17 November
PA ALWAYS REACTS BEFIRE THE APEX
This could be abytime from now till then.....
Be Ready
Bulls....We need you
BTC Correction Possible Before Further DropFenzoFx—Bitcoin continues its downtrend after dipping below the bearish fair value gap, now trading around $104,150.00. Immediate support sits at $103,400.00. A daily close below this level could trigger further downside, with thin liquidity below.
Technically, a correction may occur first, potentially pushing BTC toward $108,800.00 before resuming the decline. If $103,400.00 is breached, the next support levels are $100,000.00 and $98,000.00.

Bitcoin Correction Forming a Triangle – Which Way Next?Bitcoin ( BINANCE:BTCUSDT ), just as I expected in the previous idea , started to decline and reached its full target .
Over the past 20 days , Bitcoin has been moving in a ranging pattern that seems to be forming into a triangle shape .
From an Elliott Wave perspective , this corrective structure also appears to be a triangle , with its wave E potentially completing around the Resistance zone($114,300-$113,000) and the Cumulative Short Liquidation Leverage($114,424-$112,000) .
I expect that in the coming hours, Bitcoin can rise at least up to about $112,800 . If the upward momentum is strong enough , we might even see it reach the upper lines of the triangle .
Cumulative Long Liquidation Leverage: $106,231-$104,648
Please respect each other's ideas and express them politely if you agree or disagree.
Bitcoin Analysis (BTCUSDT), 2-hour time frame.
Be sure to follow the updated ideas.
Do not forget to put a Stop loss for your positions (For every position you want to open).
Please follow your strategy and updates; this is just my Idea, and I will gladly see your ideas in this post.
Please do not forget the ✅' like '✅ button 🙏😊 & Share it with your friends; thanks, and Trade safe.
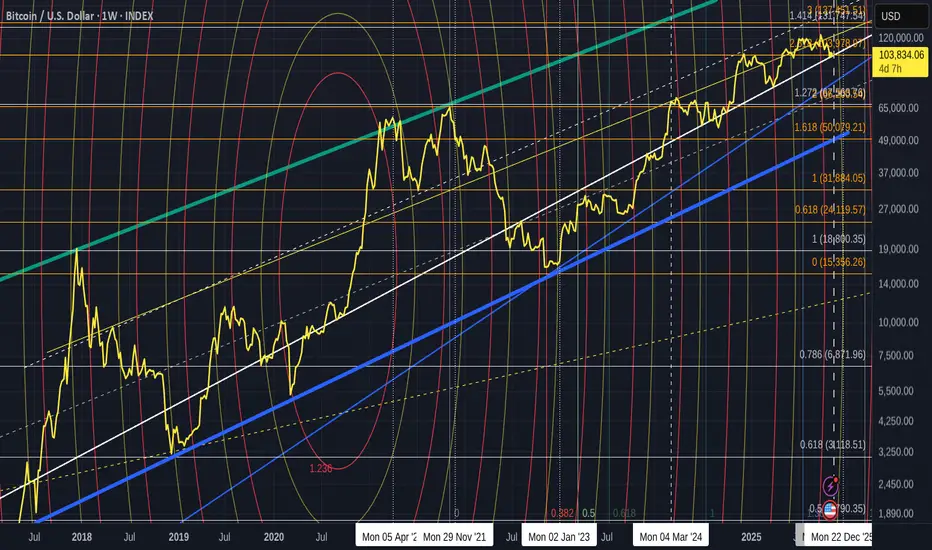
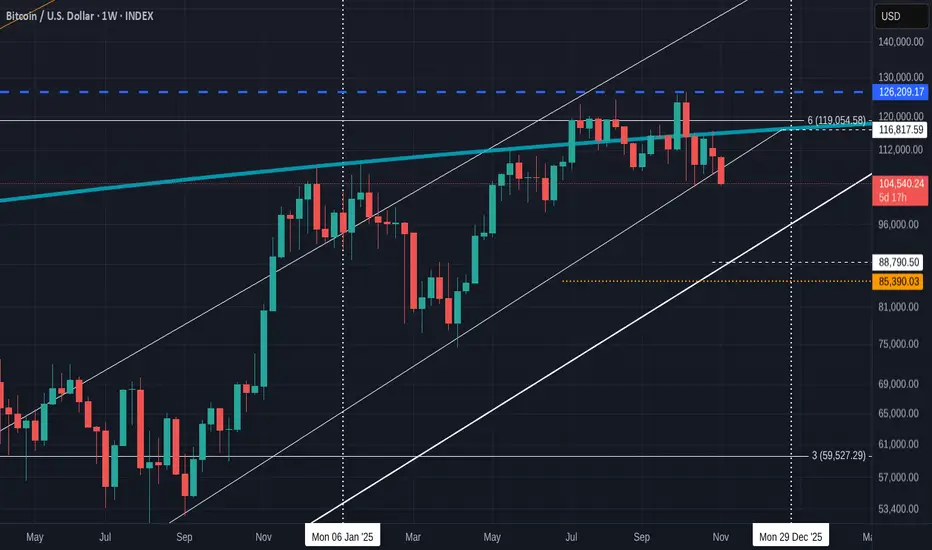
Bitcoin Weekly - Do you remember November 2022 ? It May repeat
The way things are playing out right now are beginning to make me think we are towards the end of a Mini Bear market with Bitcoin.
Nothog like previous Bear markets were we saw -80% pull backs but still painful to many.
Let us remind ourselves of what happened in November 2022
For Weeks in September and November 2022, we saw overall decline, attempted recovery and then, BANG, that -26% Dive to the Bear market Low.
That also reached sown to the Long Term line of support, a line that has NEVER been crossed.
That same line has supported this Cycle Run on a Few occasions and I think we may well get to that line again this month.
As mentioned recently in my Monthly Candle Colour post, we have just repeated many similar moves.
The Current position is this.
If we reach down to that line, it is a -20% drop if we get there next week.
This all sounds a Bit drastic maybe but if we remember that IF it is mimicking the End of a Bear market, the one from 2022, then the future does look a little more rosy.
It is also worth Zooming out and looking at the bigger picture.
That is the monthly chart and it puts everything in perspective. This -20% move is NOTHING by comparison.
The Bold white line is the line of support we may reach and the Blue Arc is the Long Term point of Resistance.
The MAIN battle PA has had since November last year is that Blue Arc.
See that here.
So, there we have it, We may Scare the pants off a few people this month and PA could reach the 88K mark..That is below Cost Basis for many and would destroy confidence.
But look what happened in 2022...............................................
This is just an idea and may not happen.
But until things turn around this is what I am seeing
What an excellent Buying opportunity.
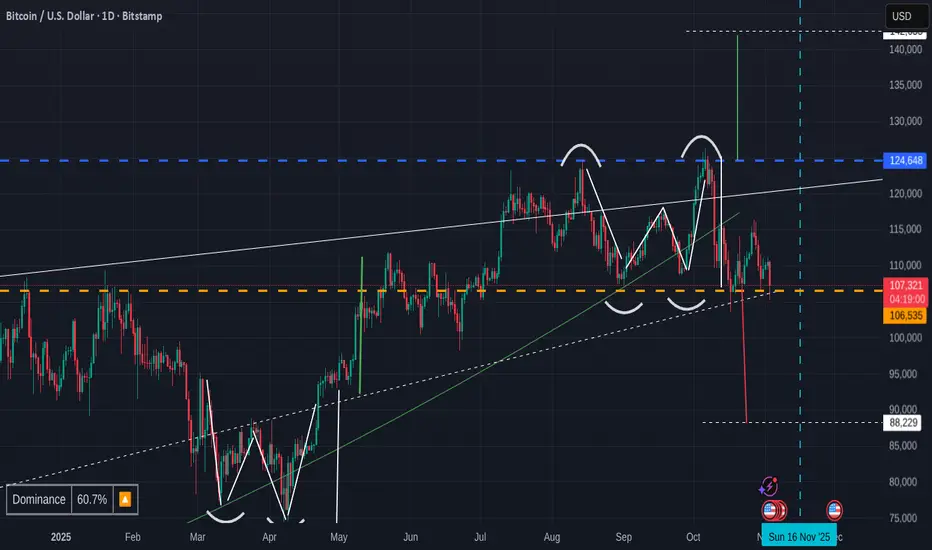
Another quick BITCOIN Daily UPDATE -old chart revisited
I posted this idea on TV at the beginning of October.
Using the W trading idea and / The use of Double Top and / or Double Bottom
We certainly got Bearish side of this idea over that weekend.
And if that support breaks that we currently sit on, then we may well see the lower side of the measured move before we begin to regain confidence.
This could see 88K on a wick down from mid 90K
Sadly, I am avle to also mention that we have printed a mini Head and shoulders and so, a measured move from that could be to around 98K
The Daily MACD
Is in a Descending channel and the lower trendline hits support 2nd week of November
WE do have the possibility of repeating the October PA moves and, as explained in the monthly Candle colout report, this is almost expected now.
Hang in there.
This could well be here to destabilise the market...Get you to run back to FIAT.
December WILL BE DIFFERENT.
But whi knows..NOVEMBER may suddenly turn up and take us all with it....
Just HODL your Bitcoin until we know thongs for Certain.
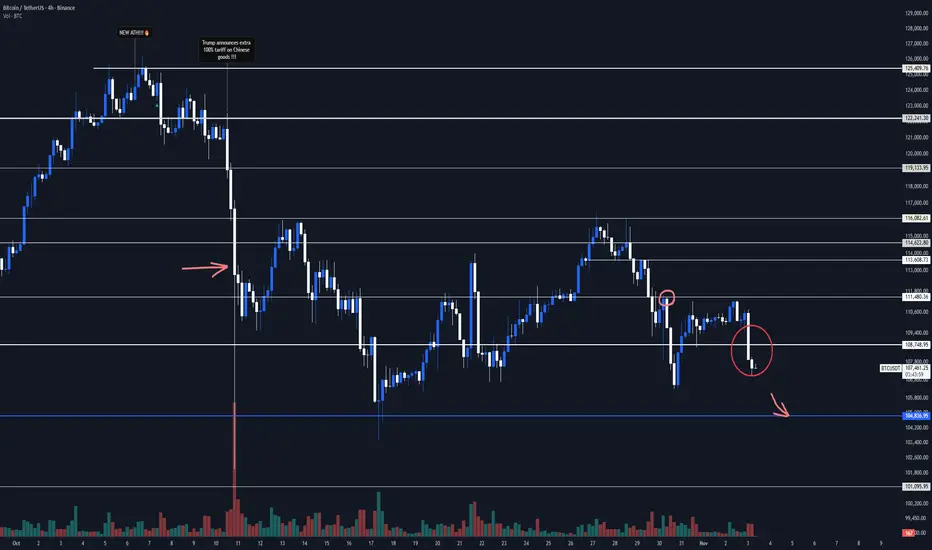
Bitcoin Daily Analysis — Why $BTC Might Rebound Soon (Nov 3)A few weeks ago, if you said you wanted to open a short position on Bitcoin, everyone would probably give you a weird look ~_~ . But after President Trump announced the 100% tariff increase, and Bitcoin alone dropped over 15%, opening shorts these days doesn't seem so strange anymore.
Buyers were hoping for interest rate cuts, but even after a sharp drop, it looks like buyers still aren't interested in jumping in, and the bearish momentum is gaining strength. Let's start with an overall view from the weekly timeframe.
Bitcoin has held its HWC uptrend for about 1,000 days now, and if you look closely, it has never really penetrated its floors, while strongly respecting this curve line—until now, when it seems to be breaking it downward.
What does this show us? There's a high probability of a short-term price correction, and if we then break the lower highs and lows, our HWC uptrend would officially change, potentially leading to a drop as low as 45k . But I see the first scenario as more likely: just a daily correction, and then we'll be back in uptrend for the next couple of months, since the interest rate news is still pending, and that's expected to cause another drop. Plus, we haven't had an altseason yet—we've seen Bitcoin's growth, and it seems like it's over (I hope I'm wrong), but altseason hasn't happened, and BTC.D is still in uptrend, sitting above 60%.
We're at a very critical point in the market, so pay close attention to these three dominance and index metrics:
And finally, pair BTC with the specific altcoin you want to buy. For example, if you're checking Ethereum, you need to look at ETH/BTC too. If it's in uptrend, that's good; if not, be sure there's a better pair where more liquidity is flowing in. This is under the condition that the market has uptrend momentum. In the current conditions, I don't recommend buying altcoins at all.
Back to Bitcoin. Today, my short trigger activated after breaking 108,748.95, but I missed it because I was asleep:) We have a lot of liquidity in the 104k to 105k area, so it's best not to miss that. If we miss it, we'll go for the first scenario I mentioned—a correction on the daily timeframe. The next support levels would be 101k, 98k, and 91k. But if we get good support at 105k, personally, I'd look for a long trigger, even with very low risk, and I'd still follow it. Probably, we'll fake out around 105k and then form resistance—definitely open a long after the break.
Another possibility is that we fake out this 108,750 support break and head back up, in which case we'd trigger with a break of resistance at 111,480.36 . I suggest you open it too, even with low risk—maybe risk 0.25% of your capital, but it's better to open because Bitcoin's uptrend rallies are usually very aggressive, and they don't give you much room for stop losses, so you get low R/R if you don't join with the first leg. So, it's better to have a position at the start of the uptrend, even with the lowest possible risk.
For shorts, there's no new trigger right now—let's wait for the market to give us a better structure.
Let's also check BTC.D:
it's in uptrend momentum, meaning as Bitcoin drops, liquidity is exiting altcoins, so altcoins are experiencing even bigger drops relative to Bitcoin. If you're looking for short triggers, altcoins are a much better option.
For longs, we need to wait and see if, with Bitcoin's rise, BTC.D also rises or not. If yes, open on Bitcoin alone; if not, split your risk between Bitcoin and an altcoin that has an uptrending BTC pair. If you think any part of what I said is unclear, raise it in the comments, and I'll explain.
Let's also take a look at Ethereum
its situation is similar to Bitcoin, with the difference that since its BTC pair(ETHBTC) is declining, it's dropped more than Bitcoin. It already passed its short trigger, but if you're really keen, if we rest a bit here for New York time, you can open a short with a break of support at 3,685.05 , but with low risk because there's a ton of buy orders below this support, and it's not certain we'll pass it easily. An increase in volume at the break could help keep you safer from fake breaks.
For longs, Bitcoin is better right now, but if the second BTC.D scenario happens—Bitcoin rises, BTC.D drops, and ETH/BTC starts printing green candles—you can split your risk between BTC and ETH. It's best to have a BTC position anyway, since it's much safer.
And again, I say we're in a crucial geographic spot in the crypto market—stay vigilant and take capital management seriously. I'm sure many got liquidated after Bitcoin's 15% drop and got wiped out of the market because they didn't manage capital and risk. I say this because the day after the drop, I lost 15 followers too :) lol :).
Alright, get outta here.
Weekend Analysis: DXY, BTC, Gold, Silver, Nas100 and SPX500In this video presentation I am expecting the dollar index to continue its uptrend on the lower time frame towards the liquidation level target of 99.500.
Bitcoin is still in a distribution range and currently correcting the sharp sell off from $126,296. I am observing an A-B-C corrective pattern potentially to targets of either $115,044 or $117,653. These are confluence of resistance level and will be expecting a sell off from these levels. If these levels gets invalidated then potentially the all time highs of $126k is in view. However that's not my expectation so a breach of the target level will invalidate the bearish analysis on Bitcoin.
I think Gold and Silver have peaked out for now and smart money is off loading to FOMO retail traders. I am expect Silver to sell off much faster than Gold.
Nas100 and SPX500 clinched to a breakout of new highs but the buying volume is fading out and seems to be a fake out. I will be watching if the breakout levels gets support or breakdown on pullback to decide a long position or short position.
This is my opinion on the market this week and I thank you for your time to visit my publications.
Have a great trading week and don't forget risk and money management is your first job as trader or investor. Cheers!!

BTC Scalp Sell/Short Setup (15M)The trend and structure are bearish, and Bitcoin is approaching a bearish origin point. If it fails to break through this origin, the low that created this bullish wave will be at risk.
With this in mind, we can prepare a position for Bitcoin with a risk-to-reward ratio of 1:2.
The last bullish wave on the lower timeframes also has a bearish CH.
Let’s see what happens.
For risk management, please don't forget stop loss and capital management
When we reach the first target, save some profit and then change the stop to entry
Comment if you have any questions
Thank You

Bitcoin Monthly Candle colour Close since 2011- Looking GOODOCTOBER CLOSED RED
October closed RED for the 5th time in Bitcoin History.
On 3 occasions, it was in a BEAR market, Once was in a Bull Run, in 2012 and the one that just closed Red,
We have to wait and see how things unfold from here.
Is this the End of this Bull run ?
Many will say so and this could be supported by the information above. The Majority of RED Octobers are in Bear markets.
Lets look closer
The left Box shows the only similar monthly Candle sequence, similar to the one we currently have. If you look closely, it is also a very similar "Curve" shape. Descent to low, rise, flatten out.
The Candle Sequence to see is Red, Green. 2 Red. 4 Green, 1 red, 1 Green
That Sequence was followed by a RED Candle, which we have just also done.
The Thin down facing arrow in the left Box, points to the equvilant candle to the one we just had.
The difference being when this happened.it was in Different months. the left box starting in September 2022.
IT WAS THE END OF THE 2022 BEAR market.....
The first Red candle in the current sequence was in December 2024
Some say we have entered a mini Bear a few months ago.......with long term holders selling coins, as is generally accepted as end of cycle action.
But these Coins all got bought right back up....Demand still exists.
The Large Green candle after the Red, Green. 2 Red at the start, in the left box , was January 2023, when we began this current "Cycle". The Bull Run.
Could we be about to see a repeat of this ?
But firstly, If we continur to follow this, we can expect a RED NOVEMBER !
But December will be Green and January would be EPIC, similar to the January 2023 Candle.......MAYBE
But this is all Hyposthosis.
The FACTS are :-
Looking ahead-->
Previous NOVEMBER Candle Closes
9 Green to 5 Red - Nearly twice as many Green as Red.
Only One Green November was in a Bear, November 2014.
The Red November in 2011 was the bottom and was the start of Bitcoins 2 year push to ATH.
The Red one in November 2022 marked the Bottom of the Bear, though December was red but a small candle.
Nearly half of the Red Novembers called the Bottom of a Bear, a turning point in market behaviour.
Some charts point to a RED start to November and the Red close fpr October certainly does not point towards a continued Bullish Sentiment.
I do not often point to TA in these month charts But the MACD will be reaching Neutral on Weekly charts by nid / late December.
To me, this points towards the time when Bitcoin has the ideal moment to push to a real New ATH. This could therefore point towards a Red November and then a Green December.... which follows the Sequence mentioned above.
But this is Bitcoin, it is its own Boss.
We have to wait..time will tell but I reman VERY Bullish

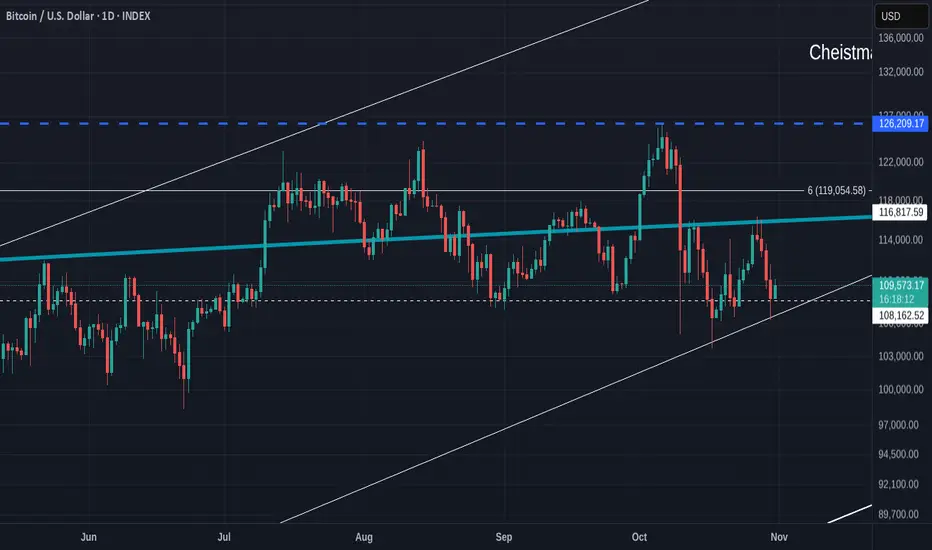
Bitcoin Daily Update - DO NOT PANIC - RED October not always Bad
This Bitcoin Daily chart should offer you hope if you are feeling a little worried about where Bitcoin is going.
See the Support offered where the Wicks touch that rising line of support.
Also note how that Horizontal dashed line offers Support.
WE ARE STILL IN RANGE
The Blue line ( Arc) is where we need to cross today to make a GREEN October.
It may not happen. But we had a Red october in 2012 in the middle of a bull Run, so I am not panicing, even if I remain cautious till we cross that line.
That 6 Fib line is a Major hurdle to cross
But the Daily MACD is Good.
Currently, the Red signal line has offered support to the Yellow MACD and while that lasts, I remain bullish.
This weekend is going to be VERY interesting.
Bitcoin Daily target hit and now, we wait for support to kick in
I drew that Circle around Late August and here we are, PA just entered it.
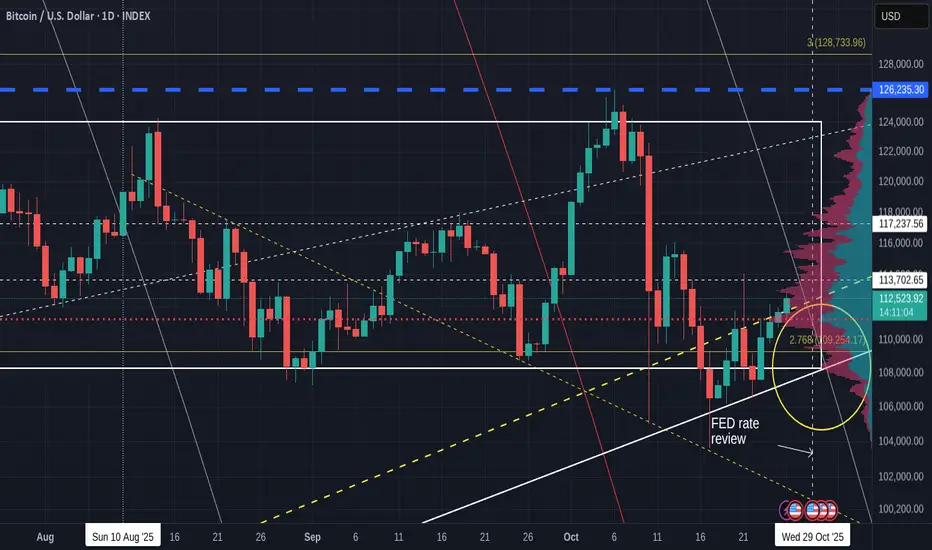
This Means that PA is now just above a Strong Long Term line of support that we bounced off well Earlier in the Year. . This line was tested a week or so ago and we bounced. This should happen again but maybe not this month.
The 2.768 Fib extension we are currently bouncing off, bumps into that rising line of support in the First week of November, around the 4th, a Tuesday.
PA is under that Local dashed line of local support.
The Daily MACD
This is in Oversold and has tried to bounce but is currently heading back towards its red signal line. We need to wait and see if this MACD bounces off it or not...But we should remember that the Weekly MACD is still falling Bearish above Neutral.
The Daily RSI
RSI is trying to bounce off its MA, testing it as support.
We did talk about a smaller bounce higher and then a turn lower a week or so ago.
This may have played out and a Move lower for Bitcoin Could happen if this support does not hold and a visit to the 95K area may occur, though I expect it to be A Wick down IF IT HAPPENS>
It does look like October will close RED and this may scare some people.
Interesting days ahead
We need to be patient and wait.
.

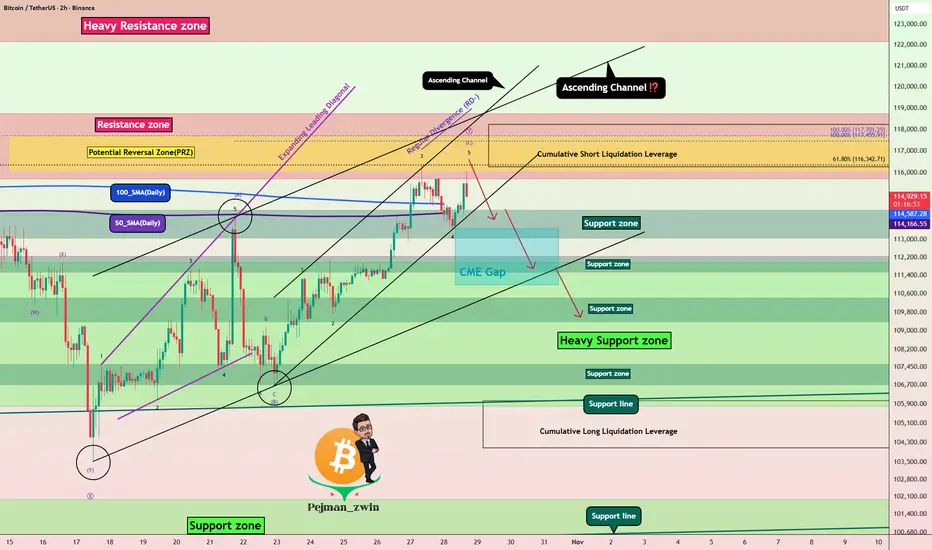
Bitcoin Hits PRZ – Time for a Correction?As I expected yesterday , Bitcoin ( BINANCE:BTCUSDT ) did drop down to the Support zone($114,300-$113,000) at the lower line of the ascending channel and then started rising again today. Both Long and Short positions basically hit their Targets .
At the moment, Bitcoin is moving near a Resistance zone($118,740-$115,740) , the Potential Reversal Zone(PRZ) , and Cumulative Short Liquidation Leverage($118,224-$116,281) .
From an Elliott Wave perspective , it seems like Bitcoin is completing the microwave 4 of the microwave C of the main wave Y . There's a noticeable Negative Regular Divergence(RD-) between the last two peaks, which suggests some weakening momentum .
I expect that Bitcoin won't break through the Resistance zone($118,740-$115,740) easily and may fall back at least to the Support zone($114,300-$113,000) . If it drops below the 100_SMA(Daily) and 50_SMA(Daily) , we could see a deeper decline and possibly the CME Gap($113,495-$110,990) being filled.
Note: Another point to mention is that although the SPX500( TVC:SPX ) has been hitting new all-time highs as the new week began, BTC has shown a bit less correlation with it in the last day. So if the S&P 500 undergoes a correction, Bitcoin might actually see a sharper pullback, which is something to watch out for as a potential negative factor for Bitcoin.
Note: Also, keep in mind that tomorrow, some important U.S. economic indices will be released, which could also influence the market. So definitely factor that into your considerations.
Note: In general, the crypto market in the past couple of weeks has been heavily influenced by news around U.S.-China tariffs. Any headline can cause Bitcoin and other tokens to swing up or down, so keep an eye on those geopolitical headlines.
Cumulative Long Liquidation Leverage: $106,033-$104,090
Please respect each other's ideas and express them politely if you agree or disagree.
Bitcoin Analysis (BTCUSDT), 2-hour time frame.
Be sure to follow the updated ideas.
Do not forget to put a Stop loss for your positions (For every position you want to open).
Please follow your strategy and updates; this is just my Idea, and I will gladly see your ideas in this post.
Please do not forget the ✅' like '✅ button 🙏😊 & Share it with your friends; thanks, and Trade safe.
Bircoin Daily update - PA just under margin for GREEN October
Bitcoin once again got rejected off that Blue Arc .
A Quick reminder about that Blue Arc - It has rejected EVERY Bitcoin ATH since the beginning.
It Is part of a Calculated Fibonacci Spiral and PA is currently getting Squeezed between that and the rising line of support that has Never been broken.
These two lines are discussed in greater detail in previous posts
A Closer View
This Blue line MUST be crossed by DECEMBER or the Spiral, as it turns down, could drag Bitcoin with it, though I so not think this will happen, But it does explain the struggle Bitcoin is having and why we have not seen the Epic surges and rises we are used to....The Spiral has rejected every attempt to cross and remain above so far.
So, back to the Daily chart
What I am finding Very interesting right now is how the Blue Arc is also the Border line between Bitcoin PA printing a Red or a Green candle this month.
Currently, with PA below, we have a RED Candle,
When PA poked above briefly yesterday, it was Just Green.
The threshold is around 114K to hold.
We have 3 days left to break over that line for Bullish sentiment to exist.
We did have a RED October in 2012 that was in a bull run. It was the ONLY occasion.
Also note the lines if support below.
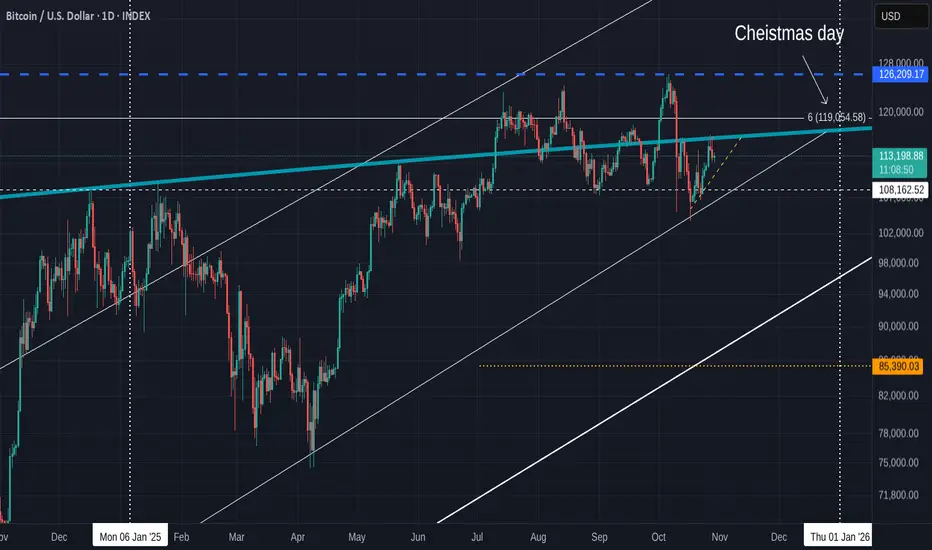
The Closet reaches a Touch on that Blue Arc on Christmas day, 25 December, Perfect timing.
The Longer term line of support below that , which is currently a price range of around 98K, reaches the Blue Arc in May 2026
So, all to play for and we now wait for the FED ( Also known as the DXY SUPPORT GROUP ) to explain its decision to us later today.
This Wil effect Markets I expect.
But let the dust settle before maling a lasting decision.
Bitcoin Rally Heating Up – Watch This Zone Carefully!As the new week kicked off, Bitcoin ( BINANCE:BTCUSDT ) started to climb, fueled by a pump in the S&P500 index ( SP:SPX ) and the creation of a gap in the S&P500 index.
It seems Bitcoin has successfully broken above the 100_SMA(Daily) and 50_SMA(Daily) , as well as a Resistance zone($114,300-$113,000) .
In fact, Bitcoin has also formed a new CME Gap($113,495-$110,990) due to this S&P500 Index -driven surge.
Right now, Bitcoin is approaching the next key Resistance zone($118,740-$115,740) , Potential Reversal Zone(PRZ) , the Cumulative Short Liquidation Leverage($117,577-$116,731) , and the upper line of an ascending channel .
From an Elliott Wave perspective , by breaking this Resistance zone($114,300-$113,000) , Bitcoin has entered a new phase of wave counting. It appears to be completing microwave 4 of the main wave C . Overall, the corrective structure seems to be a Zigzag Correction(ABC/5-3-5) with an expanding leading diagonal in main wave A .
I expect that in the coming hours, after a pullback to the broken Resistance zone($114,300-$113,000) and those moving averages , Bitcoin might rise again at least up to the Potential Reversal Zone(PRZ) . There's a possibility of forming a larger ascending channel, but since we haven't confirmed a second top, we can't rely on that channel just yet.
Note: In general, the crypto market in the past couple of weeks has been heavily influenced by news around U.S.-China tariffs. Any headline can cause Bitcoin and other tokens to swing up or down, so keep an eye on those geopolitical headlines.
Cumulative Long Liquidation Leverage: $113,625-$112,175
Cumulative Long Liquidation Leverage: $106,033-$104,090
Note: If Bitcoin falls below the moving averages and the Resistance zone($114,300-$113,000) again, we can expect further declines.
Please respect each other's ideas and express them politely if you agree or disagree.
Bitcoin Analysis (BTCUSDT), 2-hour time frame.
Be sure to follow the updated ideas.
Do not forget to put a Stop loss for your positions (For every position you want to open).
Please follow your strategy and updates; this is just my Idea, and I will gladly see your ideas in this post.
Please do not forget the ✅' like '✅ button 🙏😊 & Share it with your friends; thanks, and Trade safe.

Analytics: Market Outlook and Forecasts
📈 WHAT HAPPENED?
Last week, amid a record drop in gold on October 21, Bitcoin entered a phase of increased volatility. Initially, the asset experienced a ~5.5% increase, forming a strong volume anomaly, before returning to its initial levels.
After a sharp reversal, we anticipated a local uptrend and a short bounce from the seller's anomaly. However, we only observed a minor short movement, which was absorbed by the buyer.
💼 WHAT WILL HAPPEN: OR NOT?
We’ve reached an important level, which is now being tested. Given how easily the market passed strong resistance, the mood remains bullish.
The main expectations: break after a local retest of the $115,000-$114,300 range (buyer activity by delta) or test the next buyer zone before resuming growth. The target for the movement is the $120,000 mark.
Buy Zones:
$115,000–$114,000 (local delta activity),
$111,700–$110,000 (accumulated volumes),
$108,700–$107,500 (volume zone),
$105,600–$104,500 (volume anomalies),
$97,000–$93,000 (volume zone).
Sell Zones:
$120,900–$124,000 (volume zone).
📰 IMPORTANT DATES
Macroeconomic events this week:
• October 27, Monday, 14:00 (UTC) — publication of data on new home sales in the United States for September;
• October 28, Tuesday, 14:00 (UTC) — publication of the US Consumer Confidence Index for October;
• October 29, Wednesday, 13:45 (UTC) — announcement of the interest rate decision in Canada;
• October 29, Wednesday, 18:00 (UTC) — FOMC statement and announcement of the US Federal Reserve's interest rate decision;
• October 29, Wednesday, 18:30 (UTC) — FOMC press conference;
• October 30, Thursday, 9:00 (UTC) — release of Germany's GDP for the third quarter of 2025;
• October 30, Thursday, 12:30 (UTC) — publication of the US GDP for the third quarter of 2025;
• October 30, Thursday, 13:00 (UTC) — publication of the German Consumer Price Index (CPI) for October;
• October 30, Thursday, 13:15 (UTC) — announcement of the deposit rate and the Eurozone interest rate decision for October;
• October 30, Thursday, 13:45 (UTC) — press conference by the European Central Bank;
• October 31, Friday, 1:30 (UTC) — publication of the Chinese manufacturing sector business activity index for October;
• October 31, Friday, 10:00 (UTC) — publication of the Eurozone consumer price index for October;
• October 31, Friday, 12:30 (UTC) — publication of the US personal consumption expenditure base price index for September.
*This post is not a financial recommendation. Make decisions based on your own experience.
#analytics
Bitcoin Roadmap– Next Move Down Incoming?As I expected yesterday , Bitcoin ( BINANCE:BTCUSDT ) started rising from the Support zone($107,580-$106,700) and has now hit its Target at the Resistance zone($110,430-$109,380) .
Now the question is: will Bitcoin continue its short-term uptrend in the next few hours, or is it going to drop again? Stay with me to find out.
Bitcoin is trading near the Resistance zone($110,430-$109,380) , Potential Reversal Zone(PRZ) , and Cumulative Short Liquidation Leverage($111,613-$110,542) .
From an Elliott Wave perspective , it seems that Bitcoin is completing the wave C of an Expanding Flat Corrective Pattern(ABC/3-3-5) .
Given that the S&P 500 ( SP:SPX ) ( which has recently been correlated with Bitcoin ) is likely to drop when the U.S. market opens , I expect Bitcoin to resume its decline . This next drop might be the final push to break the Heavy Support zone($111,980-$105,820) .
What do you think? Can Bitcoin break that Heavy Support zone($111,980-$105,820) in the end or not? Let me know your thoughts!
Cumulative Long Liquidation Leverage: $106,606-$105,463
Please respect each other's ideas and express them politely if you agree or disagree.
Bitcoin Analysis (BTCUSDT), 15-minute time frame.
Be sure to follow the updated ideas.
Do not forget to put a Stop loss for your positions (For every position you want to open).
Please follow your strategy and updates; this is just my Idea, and I will gladly see your ideas in this post.
Please do not forget the ✅' like '✅ button 🙏😊 & Share it with your friends; thanks, and Trade safe.

Bitcoin Daily heading towards resistance but has strength
We can see BTC PA rolling along hte top side of that circle ( which I placed 2 weeks ago and can be seen in previous posts )
PA is now heading towards that 236 Red Fib circle ( resistance ) while sitting on that dashed line of support.
PA has the ability to push through if the Bulls continue to support.
The MACD continues to rise and has now crossed its signal line. Bullish
RSI has risen above its MA and has plenty of room to continue
The Blue dash line at Top of chart is the current ATH zone and we have a tough fight to get there and pass it but I have little doubt we will.
It just may not be this month
Monthly candle is currently RED and this may scare people but we had a red october i 2012, in the middle of a bull run
I leave that there
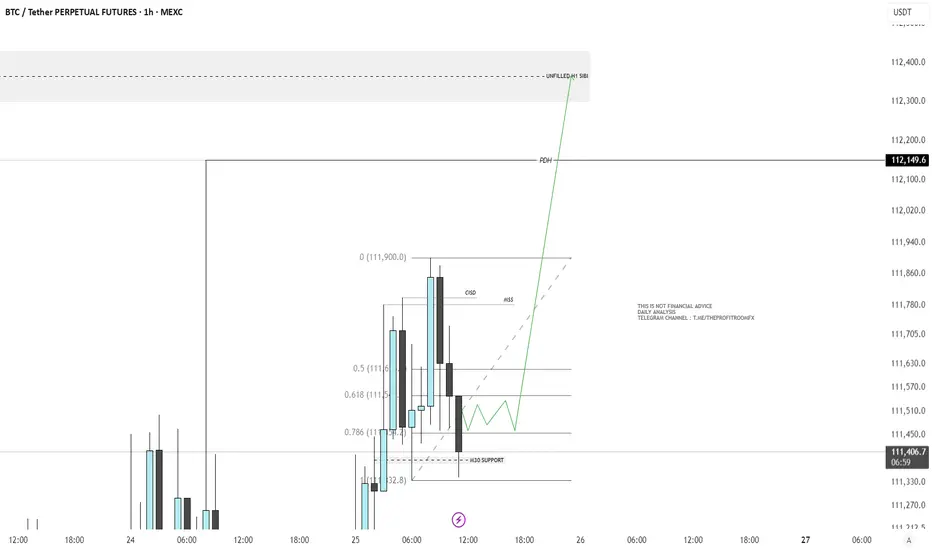
Bitcoin Weekend AnalysisIf the current H1 candle closes within the range of the previous candle, we may anticipate a potential movement toward the buy-side.
There is a notable draw on liquidity, with the Previous Daily High (PDH) and an unfilled H1 SIBI (Sell-Side Imbalance, Buy-Side Inefficiency) serving as key areas of interest.
Recently, we’ve also observed a Market Structure Shift (MSS) alongside a Change in Short-Term Direction (CISD)on the H1 timeframe.
In addition, price has shown multiple rejections from a support level formed by a M30 Fair Value Gap (FVG), reinforcing this area as a short-term accumulation zone.
Based on this structure, I expect price to accumulate between the 0.786 and 0.618 Fibonacci retracement levels, before redistributing toward our Draw On Liquidity (DOL).
Overall, my bias remains bearish, anticipating a sell opportunity after the SIBI imbalance has been filled and the PDH liquidity has been swept.
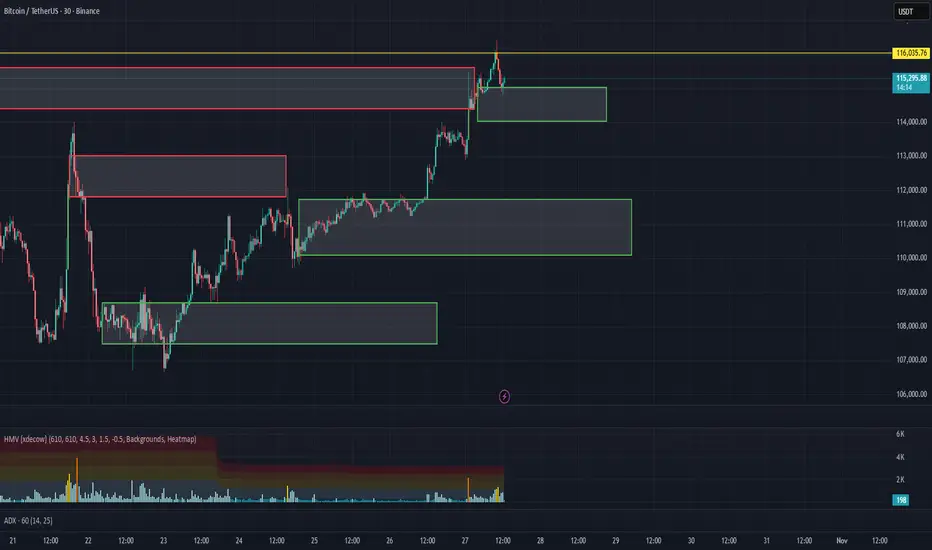
BTC/USD: Testing Key Supply Zone; Expecting Rejection1. Market Context (Prior Movement)
The chart opens shortly after a sharp, significant downtrend from levels well above $118,000.
Following the crash, the price action has been primarily sideways to slightly choppy, consolidating the large prior move.
2. Key Structure: Supply Zone
The price recently saw a sharp, bullish candle that tested a new high in the consolidation but was immediately sold off. This peak region is highlighted by the teal box, which represents a Supply Zone (or Resistance Zone) between approximately $112,000 and $113,800.
This zone signifies where sellers previously stepped in forcefully, absorbing the demand and pushing the price down.
3. Current Price Action and Prediction
The price is currently retesting the lower boundary of this key Supply Zone.
The chart includes a bearish prediction (downward arrow) originating from the Supply Zone. This suggests an expectation that the zone will hold, leading to a rejection and a move back down.
The predicted downside target is the dotted line at approximately $109,233, which aligns with a previous area of support within the recent consolidation range.
In simple terms, the price is at a critical ceiling, and the expectation is a rejection leading to a pullback.
