Bitcoin at the Top of Wedge – Bearish Reversal Coming Again?As I expected in yesterday’s idea , Bitcoin dropped to the $107,800 level, hitting its target .
In the last few hours, BTC started to pump again and is now trading near a cluster of resistances : the 100_SMA(Daily) , the 50_SMA(Daily) , and Cumulative Short Liquidation($117,517-$116,020) . This creates a strong resistance , and I don’t think Bitcoin will easily break through it. ( As of the time of writing, there’s no fresh news influencing the market .)
From an Elliott Wave perspective, it looks like Bitcoin is forming a Triple Three Correction(WXYXZ ).
On the Classical Technical side, Bitcoin is at the top of an ascending broadening wedge pattern , which is a reversal pattern . There’s also a Regular Bearish Divergence (RD-) between the two peaks in this pattern.
I expect that in the coming hours, Bitcoin will start to drop again. After breaking the important $111,000 level , it could fall at least to the lower line of the ascending broadening wedge .
Note: In these past few days, the Bitcoin and crypto market have been quite volatile and driven by news, especially related to US-China tensions. So always manage your risk carefully and avoid impulsive decisions based on sudden headlines.
New CME Gap: $107,690-$107,220
Cumulative Long Liquidation: $107,105-$104,297
Cumulative Short Liquidation: $115,241-$113,454
Stop Loss(SL): $116,200
Please respect each other's ideas and express them politely if you agree or disagree.
Bitcoin Analysis (BTCUSDT), 1-hour time frame.
Be sure to follow the updated ideas.
Do not forget to put a Stop loss for your positions (For every position you want to open).
Please follow your strategy and updates; this is just my Idea, and I will gladly see your ideas in this post.
Please do not forget the ✅' like '✅ button 🙏😊 & Share it with your friends; thanks, and Trade safe.
Bitcoinanalysis

BTCUSDT — at Edge of the Trend: Bullish or the Next Bear Trap?Main Narrative
Bitcoin is standing at a critical crossroads. After a deep correction from the 126K peak, the price is now forming a Symmetrical Triangle Pattern — a classic setup that appears when the market holds its breath before a major move.
Pressure from both sides — a descending resistance from sellers above and an ascending support from buyers below — is squeezing the price closer to the apex, the point where a decisive breakout becomes inevitable.
The next movement will decide whether the bulls regain control or the bears reclaim dominance.
---
Pattern & Structure Analysis
This triangle has formed after a strong downtrend, signaling a phase of consolidation and uncertainty.
There was one false breakout to the upside (yellow ×) — a typical liquidity trap where market makers lure buyers before pulling the price back inside the pattern.
Currently, Bitcoin remains trapped between:
Descending resistance (upper yellow line): around 110K–112K
Ascending support (lower yellow line): around 106.7K
This is a pressure zone — the longer the price stays inside, the more explosive the breakout will be once it happens.
---
Key Levels
Main Resistance: 110K – 112K (breakout zone)
Primary Support: 106.7K (bulls’ last stand)
Secondary Support: 103.6K and 102.1K (critical continuation zone)
Bullish Targets: 116K–118K (retest of previous resistance), and up to 126K if momentum expands
Bearish Targets: 103K → 102K → potential breakdown continuation below 100K if selling pressure dominates
---
Bullish Scenario — “Real Breakout or Just Another Trap?”
If the 4H candle closes above 112K with strong volume confirmation:
Buyers regain short-term control.
First target lies around 116K–118K (prior supply zone).
Sustained momentum could lift the price back toward 126K — the previous major high.
However, without volume confirmation, any breakout could turn into a second fake rally, often followed by a sharper decline.
---
Bearish Scenario — “Support Break = Bearish Continuation”
If the price breaks below 106.7K, confirmed by a strong 4H close and rising sell volume:
The breakdown could drive the price toward 103.6K, then 102.1K.
A confirmed close below 102K may trigger panic selling and open a path toward the next psychological zone below 100K.
In this case, the triangle would represent a continuation pattern, not a reversal — signaling further downside.
---
Market Psychology
This chart perfectly reflects a battle of patience between buyers and sellers.
The longer the consolidation lasts, the more energy builds up behind the next move.
Experienced traders know: long consolidations often end with violent breakouts.
---
Strategy & Key Notes
Wait for a confirmed 4H candle close beyond the triangle with strong volume.
Breakouts without volume = traps.
Keep position size small until direction is confirmed.
Enter only after a successful breakout retest to reduce risk exposure.
---
Conclusion
Bitcoin is entering a decisive phase.
A confirmed breakout above 112K could ignite a bullish run toward 116K–126K,
while a breakdown below 106K would confirm that the market is leaning back into a bearish phase.
This isn’t just another triangle — it’s a critical point that will define the medium-term trend for Bitcoin.
---
#Bitcoin #BTCUSDT #CryptoAnalysis #Breakout #TechnicalAnalysis #TrianglePattern #BTC #CryptoTrading #CryptoMarket

BTC/USDT Analysis. Is There Potential for Growth?
Hello everyone! This is your trader-analyst from CryptoRobotics, and here’s the daily market analysis.
Yesterday, as expected, after reaching the $110,000–$113,000 (accumulated volume) zone, Bitcoin showed a reaction and moved downward. Just before reaching the $107,300–$106,300 (accumulated volume) support zone, trading volume increased, and buyers are now attempting to regain control.
Currently, the structure suggests a balance forming within the $107,400–$111,700 range. A breakout above the $110,700–$111,500 local resistance could open the path toward $120,000.
Based on this, we expect continued rotation within the range, with a bullish breakout as the main scenario.
Buy Zones:
• $107,300–$106,300 (accumulated volumes)
• $105,600–$104,500 (volume anomalies)
• $97,000–$93,000 (major volume zone)
Sell Zones:
• $110,700–$111,500 (local sell zone)
• $114,400–$115,600 (local volume zone)
• $120,900–$124,000 (major volume zone)
This publication is not financial advice.

Inverse Head & Shoulders on Bitcoin – Breakout or Bull Trap?Right now, Bitcoin ( BINANCE:BTCUSDT ) is moving within its Heavy Support zone($111,980-$105,820) .
Over the past couple of days, it tried twice to break this area but couldn’t. One big reason is that recently, there was news that Japan is considering allowing banks to invest in crypto . Also, yesterday, Trump confirmed he’ll meet with China’s president on October 31st , which the market took as a positive sign that US-China tensions might ease. Previously, the market dropped on news of potential tariffs, and now it’s reacting to the possible easing of those tensions.
In the last 24-48 hours , Bitcoin has formed an inverse head and shoulders pattern , which could signal a short-term bullish reversal. However, there are still important resistance levels and cumulative short liquidation areas overhead. We need to see if Bitcoin can break through those.
From an Elliott Wave perspective, Bitcoin still seems to be in a corrective structure, and until it gets above around $116,000 , there’s still a risk of further downside. So we shouldn’t get too excited about the recent 48-hour bounce.
In short, I expect Bitcoin might push up to those Resistance lines , the Resistance zone($114,300-$113,000) , and Cumulative Short Liquidation($115,241-$113,454) , thanks to the inverse head and shoulders, but it could face resistance there and possibly drop again.
Note: It seems that we may see an increase in Bitcoin with the opening of the US market, but because the SPX500 index( SP:SPX ) is in a correction situation, we can expect Bitcoin to fall again.
Note: Crypto market conditions depend on many parameters these days, and be sure to observe capital management.
New CME Gap: $107,690-$107,220
Cumulative Long Liquidation: $107,000-$105,782
Cumulative Short Liquidation: $112,241-$111,398
Please respect each other's ideas and express them politely if you agree or disagree.
Bitcoin Analysis (BTCUSDT), 1-hour time frame.
Be sure to follow the updated ideas.
Do not forget to put a Stop loss for your positions (For every position you want to open).
Please follow your strategy and updates; this is just my Idea, and I will gladly see your ideas in this post.
Please do not forget the ✅' like '✅ button 🙏😊 & Share it with your friends; thanks, and Trade safe.

BTC Market Update: Bulls Regain ControlBitcoin has stabilized after a sharp corrective phase, forming a consolidation structure around the $111,000 area. Recent sessions indicate that sellers are losing dominance while buyers are quietly re-accumulating within the current range. This type of price action often appears before a potential short-term recovery move.
Market volume remains steady, and the structure shows compression—suggesting liquidity buildup below the current level. If this consolidation sustains without breaking lower, a breakout toward the $115,000–$116,000 region appears likely. A clean move beyond this zone could invite stronger bullish continuation as sidelined traders re-enter.
However, the broader trend remains cautious, as macro conditions and dollar strength could still limit momentum. Short-term traders may look for entries near the range lows with clear invalidation below $108,000. Proper risk management remains essential, targeting gradual exits around mid-range levels and scaling profits near projected resistance zones.

Bitcoin PA still in Range, bounced off the Low....STOP PANICING
This Daily chart VERY clearly shows us all hw BTC PA once again bounced off a Long Term support line that has existed since the beginning of this cycle higher back in Jan 2023
On this chart we can see what happened last time.. Left circle.
Is it Guaranteed ?
NO but on the smaller time frames we can see how PA has also brpken pver that next line and is about to retest it as support.
Along with this we can see the Daily MACD is turning bullish from the Low Overbought zone.
So we have the ability for a sustained bounce but somethign that may make the bulls rest on a level og their choice is the FED meeting next week, 28, 29.
On the 29th, we will hear about Rate decisions.
It does need to be fully understood that Lower rates may not absolutely lead to massive gains.
There are some very complicated issues with regard to Corporate Borrowing and the knock on effect could harm markets.
Time will tell but one thing I am sure of is how Bitcoin , to me, does still remain bullish, holding support on Key eves

The Bitcoin bearish era has begun (1D)First of all, you should know that in our previous analyses, we had identified a large triangle. However, the market makers created another bullish wave, increasing the chart’s error margin (The scenario you see in the related ideas section.).
This sharp move indicates the beginning of new bearish branches! It is expected that with a pullback to the red zone, the correction will continue, and we will be involved in it for at least a few months.
Closing a daily candle above the invalidation level will invalidate this analysis.
For risk management, please don't forget stop loss and capital management
When we reach the first target, save some profit and then change the stop to entry
Comment if you have any questions
Thank You

Bitcoin has 2 scenario, better watch these levelsUnless CRYPTOCAP:BTC regains 114k from here, It is aiming for 100k and a little below maybe.
100k is a big figure as well so very likely to see some manipulation around that levels.

$BTC SUNDAY ANALYSIS: #Bitcoin continues to play out the bearisCRYPTOCAP:BTC SUNDAY ANALYSIS:
#Bitcoin continues to play out the bearish setup we have been tracking for two months. After another clean rejection from the 1D 50 EMA zone near 115K to 115.6K, the market confirmed that sellers still dominate this range. Our main target remains 100K, which is also a key support level of this bull market. If Bitcoin breaks below this zone, I expect a deeper move toward 90K and possibly lower.
Right now BTC is trading around 107K, and while a small upside bounce is possible, it is likely to be short-lived. Important data is coming next week, including the U.S. CPI report on Thursday, October 24 at 8:30 AM ET, and the FOMC updates, which could bring short-term volatility. Resistance levels sit around 110K and the 1D 50 EMA near 115K, while 100K remains the critical support to watch. If that area fails to hold, we could easily see a drop toward 90K in the coming weeks.
Short-term relief bounces are possible, but they are likely to be sold into unless BTC reclaims 115K with strong volume. Only then would the outlook shift back toward 120K to 122K.
I am still bearish, currently holding the remaining 25% of my short position after closing 75% in profit. I will only add or close depending on how the market reacts to upcoming data and price action. If there is any shift in structure, I will update you in time.
#BTC #Bitcoin #Crypto #BTCUpdate
#CRYPTOSKULLSIGNAL

Bitcoin Now on Last reserve of Support. it MUST bounce hereThe right cirxle is where i expected BTC PA to reach before it bounced, as it did on the left circle.
But It Fell out of Range and has reached this line Early.
the BIG question is now, Will it bounce ? And if it does, the previous line of support....wi that now be resistance ?
It needs to & maintain any semblance of Bullishness....Or we will likely see 94K and truly Test the Bulls.
I do have a BUY order down there. Why Not, I will be surprised if we get there but I relish the idea of buying there again
The weekly RSI certainly shows the ability to rise as it drop lower
The Daily RSI is also in a Good shape.
So we can bounce from here but we have heavy resistance overhead now around 109K
I mentioned this date range ( 12 - 15 Oct ) at the begining of th emonth...and it has played out but, now, we need that bounce higher and up and out of Range OR we could see a drop below and possible enter a mini Bear for the rest of the month.
Maybe longer.
As always, TIME WILL TELL>

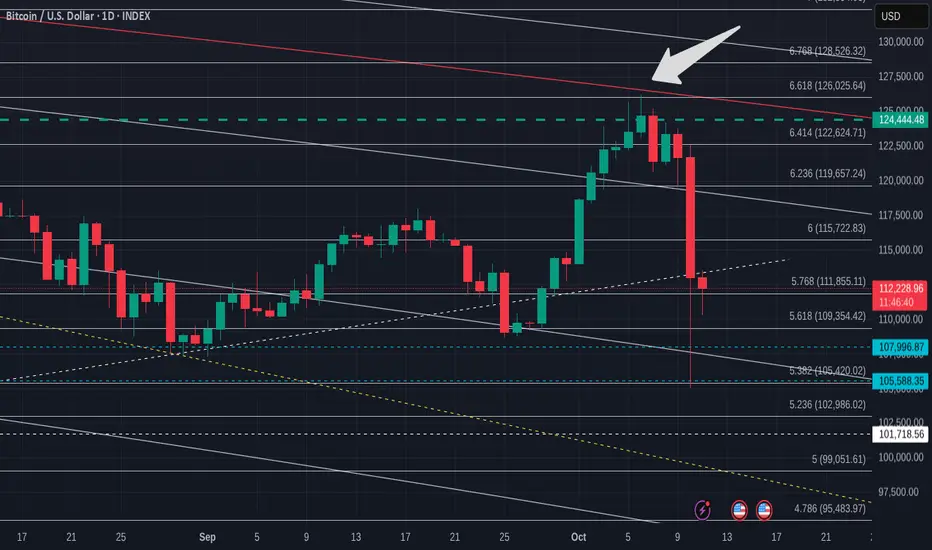
Bitcoin Bearish Continuation from Daily FVGa bearish continuation setup on Bitcoin (BTC/USD) in the daily timeframe.
After a sharp rejection from the Daily Fair Value Gap (FVG) zone between roughly $114,000–$120,000, price shows strong bearish momentum. The large red candle indicates sellers’ dominance, and the marked downward arrow projects a potential move toward lower support zones around $108,000 and $105,000, which act as the next liquidity levels or demand areas.

Bitcoin at Heavy Supports – Time to Go Long?As I expected in my previous idea , Bitcoin ( BINANCE:BTCUSDT ) completed both its bullish and bearish moves and hit its Long and Short targets .
Bitcoin can still see some upside as long as it holds this Heavy Support zone($111,980-$105,820) . However, given the recent momentum and the wick down to around $102K a few days ago, any further rally depends on breaking the Resistance zone($118,750-$115,730) and touching around $117,220 , which is the high of that significant bearish candle .
Currently, Bitcoin is sitting in a Heavy Support zone($111,980-$105,820) near the 200_SMA(Daily) and a Cumulative Long Liquidation($108,415-$107,156) . It's basically hovering between key weekly support lines, so this is a pretty strong supports .
In terms of Elliott Wave theory , it looks like Bitcoin is still completing its wave 4 . This wave 4 might have formed a Double Three Correction(WXY) , and now we can expect a potential upward move .
I expect that in the next few hours, Bitcoin may start a short-term bullish move up to around $115,000 or to the Cumulative Short Liquidation Leverage($114,973-$113,435) .
Note: Overall, it's better to look for Long positions right now, considering Bitcoin's position. But if it breaks the 200_SMA(Daily) and the Heavy Support zone($111,980-$105,820), we could see a broader crypto market drop.
Note: Around the $108,000 level, we have huge buy orders stacked up, which might act as a significant support zone.
Please respect each other's ideas and express them politely if you agree or disagree.
Bitcoin Analysis (BTCUSDT), 4-hour time frame.
Be sure to follow the updated ideas.
Do not forget to put a Stop loss for your positions (For every position you want to open).
Please follow your strategy and updates; this is just my Idea, and I will gladly see your ideas in this post.
Please do not forget the ✅' like '✅ button 🙏😊 & Share it with your friends; thanks, and Trade safe.

Bitcoin Roadmap: Is a Major Correction the Next Stop?As I expected from the previous analysis , Bitcoin did start to drop and hit its targets .
Now, with the news that the U.S. might impose a 100% tariff on China , we saw Bitcoin sharply sell off last night. Actually, as I mentioned in my previous ideas , the rally from about $109,000 to around $126,199(ATH ) (which was a new all-time high for Bitcoin) had relatively low volume. That was a sign that a correction might be on the way, and last night’s news just acted as a trigger to speed it up.
In fact, what took Bitcoin 10 days to climb was reversed in about 4 days , showing how strong the sellers are right now.
Educational tip: You can use volume candles on TradingView to see which candles had higher volume—the thicker the candle, the more significant the move.
Now, the big question: will Bitcoin keep dropping or bounce back?
Right now, it’s sitting near a cluster of Support lines and close to the daily 200_SMA(Daily) and the 50_SMA(Weekly) , as well as a Heavy Support zone($111,980-$105,820) . Last night’s drop was basically the first test of these supports .
Since it’s the weekend and volumes are usually lower, we don’t expect a huge downward move in the next 48 hours.
Bitcoin might do a pullback to the broken Resistance zone($114,820-$113,180) and then continue its drop.
According to Elliott Wave analysis , Bitcoin seems to be completing a microwave 4 of the main wave 3 .
I expect that after Bitcoin completes , we might see it continue downward and fill the CME Gap($111,355-$109,915) early in the next week.
So, do you think the major correction for Bitcoin has started or not? Let me know what you think!
Note: In case the Support lines break, there’s also a chance that we might see a Death Cross (where the 50-day moving average crosses below the 200-day moving average), which could signal further bearish momentum.
Note: Around the $108,000 level, we have huge buy orders stacked up, which might act as a significant support zone.
Please respect each other's ideas and express them politely if you agree or disagree.
Bitcoin Analysis (BTCUSDT), 4-hour time frame.
Be sure to follow the updated ideas.
Do not forget to put a Stop loss for your positions (For every position you want to open).
Please follow your strategy and updates; this is just my Idea, and I will gladly see your ideas in this post.
Please do not forget the ✅' like '✅ button 🙏😊 & Share it with your friends; thanks, and Trade safe.
Bitcoin Eyes Double Top After SelloffFenzoFx—Bitcoin is consolidating near $112,160.00 after a major selloff, testing this level as support. Price action shows a double top at $116,078.
From a technical view, BTC may aim for this level if it holds above immediate support at $112,143.0.
A close below $112,143.0 could trigger a deeper downtrend, with the next bearish target likely at $100,000.0.

Bitcoin Bullish Confirmation Above $119500 | Watch November MoveBitcoin is currently trading below a key resistance level of **$114,500**, and a **strong Monday closing on 13 October above this level** is crucial for confirming a short-term bullish recovery.
If BTC successfully closes above **$114,500**, the next important resistance will be around **$119,500**.
A **Monday closing on 20 October above $119,500** would confirm a temporary bullish structure, giving Bitcoin the strength to test higher levels toward the **$127,600 liquidity zone** in November.
Currently, major liquidity is sitting near **$124,600 and $127,600**, which might attract price movement before any major reversal begins.
The market has already taken liquidity around **$101,000**, trapping retail sellers — and now, it may move up to grab the **short-side liquidity** before the next larger downtrend begins.
⚠️ **Be patient and stay disciplined. Avoid long positions for now.**
Focus on the market’s move toward the top, and prepare for **short positions near the highs** to capture the **2026 bear market** — which is expected to last from **September to November 2026**.
📊 The market often manipulates both sides before showing the real direction. Watch levels carefully and trade with confirmation.
💬 **Follow me on TradingView** for more Bitcoin and Ethereum updates — and comment below which coin you’d like me to analyze next!

236 Fib Circle rejection AGAIN. I warned you about this earlier
In a post at the beginning of the month, I warned about a RED start to the month.
OK, we reached a New ATH first lol...But look where we are now !
My exact words were "Past October closes are 10 Green to 4 Red, so the Odds are we will see another Green October close, though it may not be a large candle.
InFacr, there are a few charts that point towards a Red start till around Second week, 12th - 15th October.
This of course can change but it maybe worth understanding that we may get a bloody month start."
Look at the Arrow on the chart. That Red Arc is a 236 Fib circle....
Anyway, so now ?
We are not at that date range for recovery yet but Monday may be positive But CAUTION is a MASSIVE idea.
We have currently bounced off the 5.382 Fib extension and are noe just above the 5.768 BUT also just under a line of resistance. WE NEED TO GET OVER THAT
One thing that points to a possible range here ir, at worse, further Dips is that the Daily MACD has only just turned BEARISH
The 4 hour has reached OVERSOLD now and so we may see some support coming in on a short term
The Daily RSI is Low but maybe not low enough to support a sustained move higher though it can rise and Range high
We need to WaTCH CLOSE AND SEE WHAT HAPPENS OVER THE NEXT 7 DAYS
#BITCOIN ANALYSIS I have been warning you for the last 45 days #BITCOIN ANALYSIS
I have been warning you for the last 45 days that a big dump was coming and now it’s playing out exactly. Bitcoin has already dumped around $20K and is now trading near 112K, right at the major resistance zone that has triggered every big correction since 2018.
A small bounce to 115K–116K is possible, but after that I expect another leg down toward 100K, and potentially lower to 90K.
I’m still holding my 50% short position. If anything changes or I close my position, I’ll update you. Remember I mentioned earlier that if BTC went back to 125K–128K, I would add more shorts and that plan hasn’t changed.
Till Monday, I expect some volatility, but Monday’s price action will give a clearer direction.
🔸 Weekly:
BTC touched the long-term trendline again → clear rejection happened.
👉 Until we get a weekly close above 125K, the risk of a major pullback stays high.
BITSTAMP:BTCUSD
🔸 Daily:
Price is inside the 110K–125K supply zone. Structure is weak.
If price breaks and resists below 110K, then 100K is the next target.
📊 My Trade:
✅ First target 105K hit
Holding 50% shorts, expecting a bounce to 115K, then lower.
📌 Downside Targets: 105K ✅ → 100K → 95K → 90K

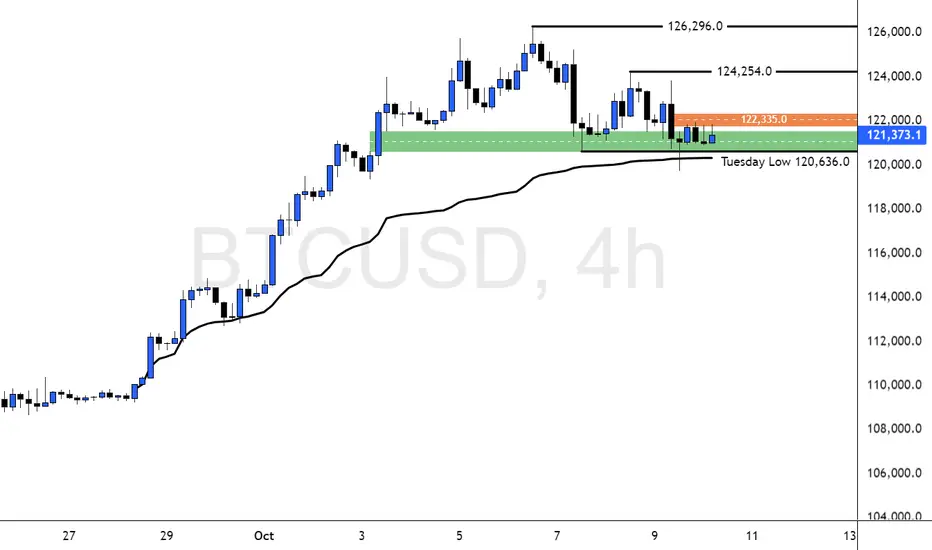
Bitcoin Leaps for a New Bullish Run Above this ResistanceFenzoFx—Bitcoin remains bullish. Yesterday, price dipped below Tuesday’s low, but failed to close beneath it. This support zone is backed by a bullish fair value gap and anchored VWAP from September 28.
Immediate resistance stands at $122,335.0. If bulls close above this level, BTC/USD could target $124,254.0, followed by all-time-high. However, the bullish outlook is invalidated if BTC/USD closes below recent lower lows.
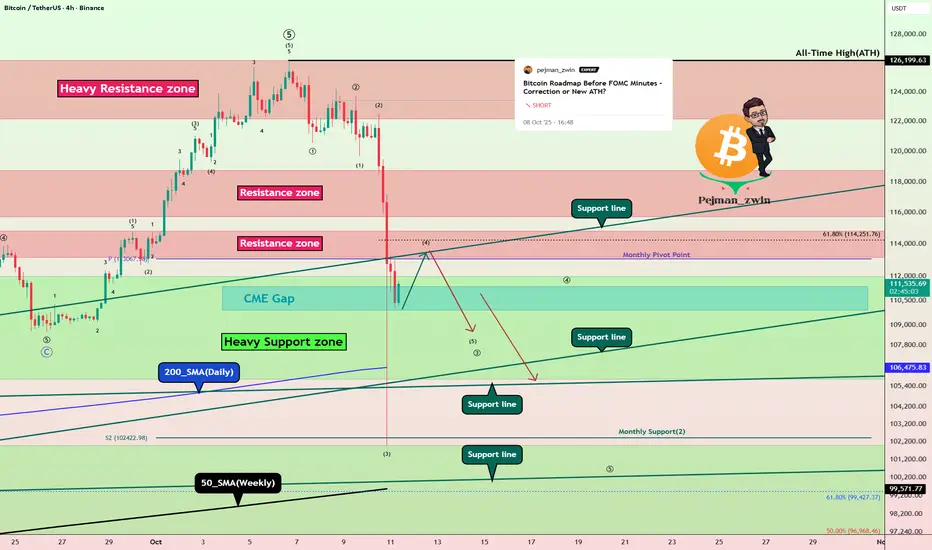
Bitcoin Roadmap Before FOMC Minutes – Correction or New ATH?Today, we have one of the most important macro events — the FOMC Meeting Minutes
Let’s quickly understand what it is and why it could shake the crypto market
What are FOMC Minutes?
They’re the detailed notes from the last Federal Reserve meeting, showing what members discussed about interest rates, inflation, and the economy.
Markets carefully read every line to find hints about future rate cuts or continued tightening.
Why does it matter for Bitcoin?
When the Fed turns dovish (hinting at lower rates), risk assets like Bitcoin usually rally But when the tone is hawkish (worried about inflation), investors move to cash or bonds, causing crypto to dip.
Let’s take a look at Bitcoin ( BINANCE:BTCUSDT ) on the 4-hour timeframe .
Before analyzing the chart, let’s quickly review what defines a strong uptrend :
1-Higher Lows(HL):
Each new low should form above the previous one, showing that buyers are stepping in earlier each time.
2-Higher Highs(HH):
Each new high should be higher than the last, confirming that bullish momentum is still in control.
3-Structure Respect:
The new low should not break below the previous high — if it does, it doesn’t necessarily mean the trend is over, but it indicates a weakening of the bullish structure.
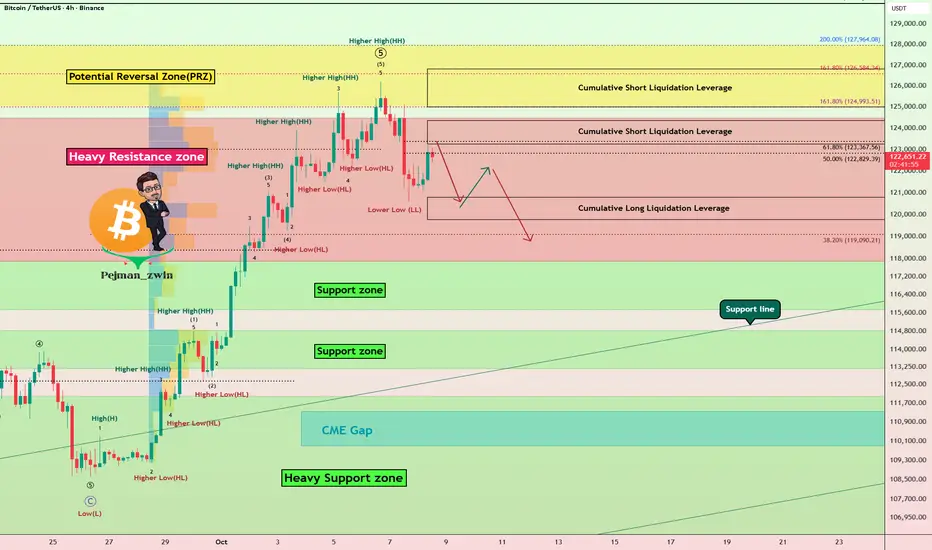
Based on the points above, Bitcoin failed to form a new Higher Low(HL) during the past 24 hours, and the previous high was retested .
These signals indicate a loss of bullish momentum, suggesting that we might see at least a short-term correction from a technical perspective.
Bitcoin has already started to bounce back nicely from the Potential Reversal Zone (PRZ) and is currently trading in a Heavy Resistance zone($124,474-$117,900) .
In terms of Elliott Wave theory , it seems that with the formation of a Lower Low(LL) , Bitcoin has completed at least a series of impulsive waves , and we can now expect corrective waves .
I expect Bitcoin to drop to at least Cumulative Long Liquidation Leverage($120,779-$119,957) before the FOMC Meeting Minutes start and could continue to rise or correct depending on the tone of the FOMC Meeting Minutes .
Note: You should note that these days, Bitcoin has a higher correlation with the SPX500( SP:SPX ) index than before, so if there is a sudden movement in Bitcoin, one of the reasons could be a sudden movement in the SPX500.
Do you think this bullish move could lead to a new all-time high (ATH) for Bitcoin again!?
Cumulative Short Liquidation Leverage: $124,350-$123,244
Cumulative Short Liquidation Leverage: $126,813-$125,000
CME Gap: $111,355-$109,915
Please respect each other's ideas and express them politely if you agree or disagree.
Bitcoin Analysis (BTCUSDT), 4-hour time frame.
Be sure to follow the updated ideas.
Do not forget to put a Stop loss for your positions (For every position you want to open).
Please follow your strategy and updates; this is just my Idea, and I will gladly see your ideas in this post.
Please do not forget the ✅' like '✅ button 🙏😊 & Share it with your friends; thanks, and Trade safe.
Elliott Wave + Gartley Harmonic: Why Bitcoin May Correct Soon!?Bitcoin( BINANCE:BTCUSDT ) has shown strong bullish momentum over the past week, climbing nearly +10% and testing key resistance zones . Several fundamental and technical factors fueled this rally.
Key Drivers of the Rise:
ETF inflows – Significant net inflows into spot Bitcoin ETFs boosted demand.
Macro uncertainty – U.S. government shutdown risk and weaker job data supported risk assets.
Monetary policy – Expectations of softer Fed policy improved market sentiment.
Derivatives impact – Options expiry, high OI, and short squeezes added upward pressure.
Exchange outflows – Lower BTC supply on exchanges signaled accumulation.
Positive sentiment – “Uptober” narrative and bullish analyst targets lifted confidence.
-------------------------------------------
Now, if we look at the Bitcoin chart in the above timeframes from a technical analysis perspective , we can see the following:
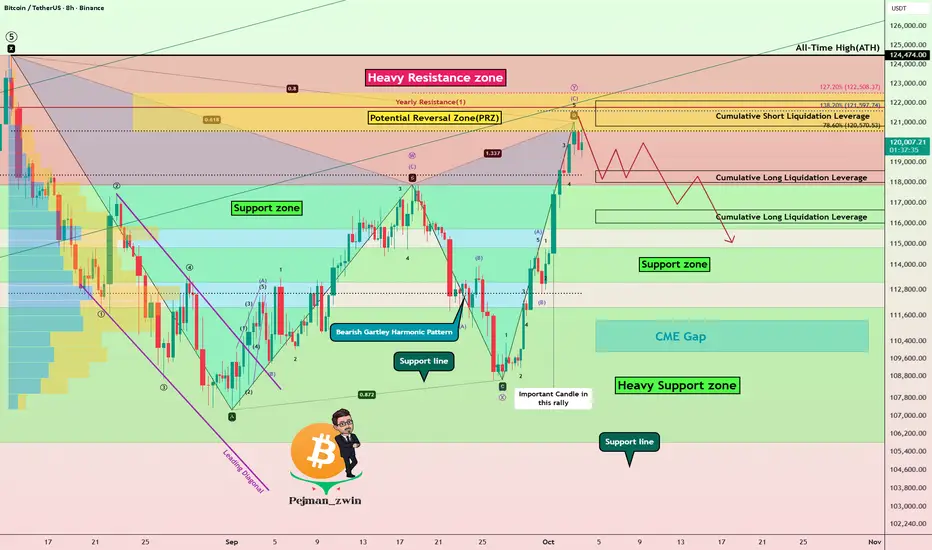
First of all, let me say that the rally that Bitcoin has had over the past 7 days has NOT been accompanied by high volume, and this is not good news for Bitcoin to create a new All-Time High(ATH) .
Bitcoin is entering a Heavy Resistance zone($124,474(ATH)-$117,900) and is moving near the Potential Reversal Zone (PRZ) and Cumulative Short Liquidation Leverage($122,120-$120,823) .
In terms of Elliott Wave theory , Bitcoin appears to be completing a microwave C of the main wave Y . One of the reasons I saw the waves as corrective , other than the microwaves, was the low volume of Bitcoin in the past 7-day rally .
If we look at the Bitcoin chart from a pattern perspective , the important Bearish Gartley Harmonic Pattern is also well and standardly defined on the chart, such that point D in the PRZ can be completed. The Gartley Harmonic Pattern is the most important pattern among the harmonic patterns .
I DO NOT expect a new ATH formation for Bitcoin in this rally due to the above reasons, and I expect it to at least decline to the Support zone($114,820-$113,180) .
Note: Important prices to watch for if Bitcoin reverses (in order of importance of volume): $118,400-$112,700
Note: You should note that these days, Bitcoin has a higher correlation with the SPX500( SP:SPX ) index than before, so if there is a sudden movement in Bitcoin, one of the reasons could be a sudden movement in the SPX500.
Educational Tip : The volume of each candle is considered to be the identity and credibility of that candle, and you can find these candles with the help of volume candle charts.
Cumulative Long Liquidation Leverage: $118,583-$118,000
Cumulative Long Liquidation Leverage: $116,652-$116,000
CME Gap: $111,355-$109,915
Stop Loss(SL): $125,00(Worst)
Please respect each other's ideas and express them politely if you agree or disagree.
Bitcoin Analysis (BTCUSDT), 8-hour time frame.
Be sure to follow the updated ideas.
Do not forget to put a Stop loss for your positions (For every position you want to open).
Please follow your strategy and updates; this is just my Idea, and I will gladly see your ideas in this post.
Please do not forget the ✅' like '✅ button 🙏😊 & Share it with your friends; thanks, and Trade safe.
Bitcoin Crushes $125K – New ATH Unlocked: Bull Run Just Started?Yo traders, Skeptic from Skeptic Lab! 🩵 Bitcoin just smashed a new ATH—your next move could set the 3-month path! In this video, we dive deep into the daily/4h analysis: from the long squeeze bounce at key support to the parabolic breakout and resistance crush. We hunt fresh long triggers (1h resistance break), skip shorts for now (bias bullish), and I share my take on your positions—hold profits if you're green (target $130K?), partial close if not. HWC/MWC/LWC all uptrend—momentum's building! Don't FOMO; money management saves the day. Like, comment your coin focus, follow for more.

BTCNEW UPDATE (1D)In the previous analysis, we considered Bitcoin’s scenario as a triangle, which has now failed.
It now appears that this is not a triangle but a diametric pattern. Currently, it seems we are in the middle of wave F. The potential corrections we expect are buying opportunities, and we will look to buy within the green box if a correction occurs.
The target for wave E could be between 138K and 140K.
A daily candle closing below the invalidation level will nullify this analysis.
invalidation level : $106418
For risk management, please don't forget stop loss and capital management
Comment if you have any questions
Thank You

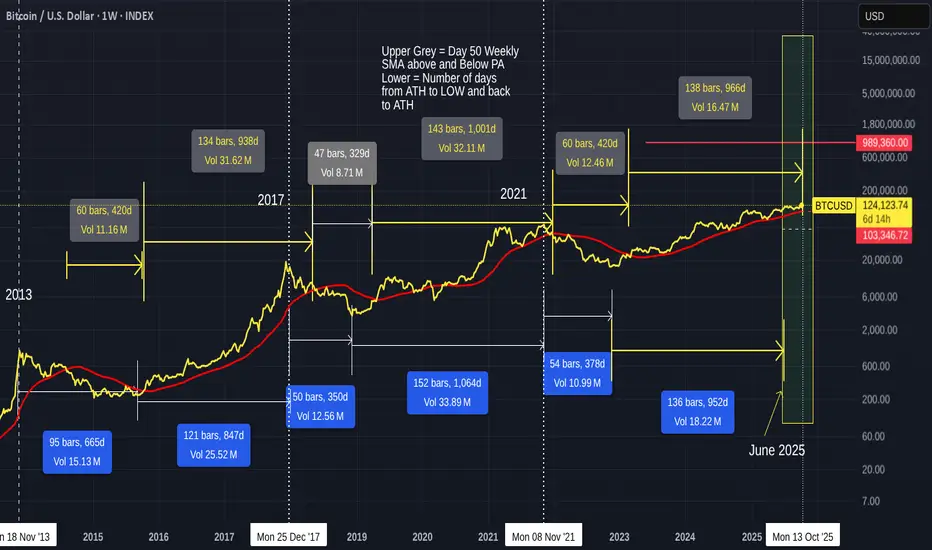
BITCOIN now in Cycle ATH Zone but is BTC still in Cycles ?I first drew this chart back in 2024 and it is amaxing how things have played out,
The Numbers in Grey boxes are the number of Days the 50 SMA ( red) has been above and below PA.
The Blue, Below PA is the day count for PA Cycle High to cycle Low and Back to Cycle high.
We have already past the "High Low" Day count for this cycle ATH and we are now on the Zone for the 50 SMA day count ATH. The peojected date for this ATH is 13 October.
Note how Similar PA & 50 SMA is in the 2013 - 2017 Cycle.
I was also running a PA Fractal chart showing similarities to PA and we can see how close it was until February this year
For me, the reason we went "Flat" from February onwards is simly because of the Long Term resistance over head.... a line that has rejected EVERY Bitcoin ATH = this is all explained in previous posts. See the Blue Arc.
It is that Blue Arc we need to Cross over. This Arc has kept PA Flat this cycle......
Looking at a Zoomed in Chart, we can see how that 50 SMA is a line of strong support.
Should PA retreat, the 50 SMA is at around 103K at this time.
The MACD is just under but in a zone where PA has retreated from
This does NOT automatical Mean PA will Drop from here. Though on lower Time Frames, MACD is up High in Oversold.
However, as the 4 hour shows us, It is already dropping from OverSold and yet PA has hit a high
Divergence is in play
One thing that dies hint at a pull back is the RSI being up in Oversold on a Daily chart
But it should be understood, RSI Can range High or Low
So, are we in Cycle Still ?
If we are, we should expect a beginning of a BEAR market in the next few weeks. But we have not really seen the "Top" pattern and Profit taking yet.....
Until that happens, I really am inclined to believe we have broken the cycle patterns.for a number of reasons.
For instance, the MVRV Z Score
This has not even past the levels seen in previous Runs
BUT as a precaution, it is worth noting that Dash orange line, that starts where the Nov 2021 ATH Was.
We have been rejected from that level already this run But we Still have room to get back up to that level at the mooment.
The Main reason i feel things are different are that Blue Arc I mentioned earlier.
We HAVE to break above that and remain there.....
We are too close at this moment and a Bear market WILL take us back below that HUGE line of Very Very Strong resistance. The Daily chart below shows this
We need one more push to take us Higher, to give us Room to remain above, even when Bitcoin Does correct .
Note that 3 Fin extension on the last chart posted.
We just got above the 6. We need to Rise far enough over that for it to act as support ewhn retested.
3, 6, 9
9 Fib extension at around 180K
Just saying
NEW CYCLES ARE BEGINNING