Bitcoin Faces $120K Resistance – Bull Trap or Breakout?Bitcoin ( BINANCE:BTCUSDT ) continued its uptrend of the last 2-3 days as I expected in my previous idea . Today, the announcement of the ADP Non-Farm Employment Change index worked like a catalyst for Bitcoin .
Bitcoin is currently surrounded by Resistance zones and a Potential Reversal Zone (PRZ) , and is near the important price of $118,400(Volumetric importance) and the $120,000(Round Number) .
From the perspective of Elliott Wave theory , it seems that Bitcoin could be in corrective waves and that the increase of the last few days could only serve as a Bull Trap .
I expect Bitcoin to decline at least to the Support lines .
Cumulative Long Liquidation Leverage: $113,590-$111,900
Cumulative Long Liquidation Leverage: $115,823-$115,087
Cumulative Short Liquidation Leverage: $120,000-$118,000
Note: If Bitcoin falls below the Support zone($114,820-$113,180), we should expect further declines.
CME Gap: $111,355-$109,915
Stop Loss(SL): $120,103
Please respect each other's ideas and express them politely if you agree or disagree.
Bitcoin Analysis (BTCUSDT), 1-hour time frame.
Be sure to follow the updated ideas.
Do not forget to put a Stop loss for your positions (For every position you want to open).
Please follow your strategy and updates; this is just my Idea, and I will gladly see your ideas in this post.
Please do not forget the ✅' like '✅ button 🙏😊 & Share it with your friends; thanks, and Trade safe.
Bitcoinanalysis

Bitcoin Resistance Zone Battle – ATH or Fakeout?Bitcoin ( BINANCE:BTCUSDT ) has shown strong momentum over the past 5 days , liquidating many traders in both Long and Short positions .
Bitcoin has now entered the Resistance zone($114,820-$113,170) and is moving near the Cumulative Short Liquidation Leverage($115,000-$114,272) and Resistance lines .
From an Elliott Wave Theory perspective, given Bitcoin’s strong bullish momentum over the past 24 hours, it appears to be completing Wave 3. This Wave 3 seems to be of the extended type.
I expect Bitcoin , after a correction , to make another attempt toward the Resistance zone($114,820-$113,170) and potentially test the Resistance lines .
Do you think this bullish move could lead to a new all-time high (ATH) for Bitcoin?
Cumulative Long Liquidation Leverage($113,037-$112,650) + Near Monthly Pivot Point($113,356): An area where Bitcoin could start rising again (if there is a correction, of course).
Cumulative Long Liquidation Leverage: $111,100-$110,500
CME Gap: $111,355-$109,915
Note: Also, Bitcoin approaching the 61.8% golden Fibonacci level could lead to a Bitcoin correction.
Please respect each other's ideas and express them politely if you agree or disagree.
Bitcoin Analysis (BTCUSDT), 1-hour time frame.
Be sure to follow the updated ideas.
Do not forget to put a Stop loss for your positions (For every position you want to open).
Please follow your strategy and updates; this is just my Idea, and I will gladly see your ideas in this post.
Please do not forget the ✅' like'✅ button 🙏😊 & Share it with your friends; thanks, and Trade safe.
BTC Traders Are About to Learn the Hard WayMost traders are celebrating BTC pushing through 113,524… but here’s what most of them don’t see coming.
If price holds, we’ve got clean air to 117K.
If it slips into 111,642, the dominoes line up for 109K… and possibly a flush toward 100K.
This is the kind of setup that wipes out overleveraged traders—and hands opportunities to those who know how to position.
👉 I’m not here to tell you what to do with your money. But I will say this: how you prepare in the next few days could decide whether you’re the one getting liquidated… or the one profiting from the liquidation.
I’ve mapped out the exact levels I’m watching and the playbook I’ll be using if BTC chooses either path.
DM me if you want to see it.

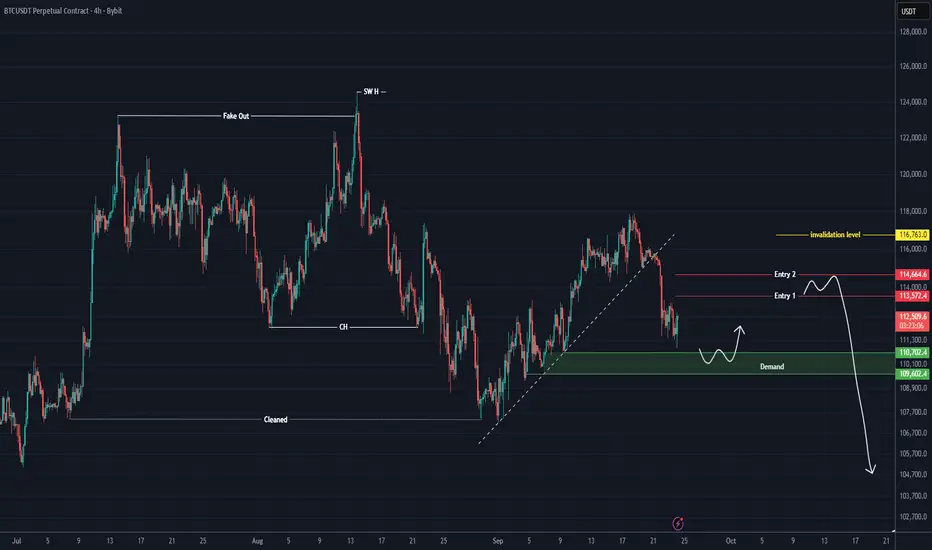
BITCOIN Is Still Bearish (1D)All these upward moves look like a pullback to the supply zone that had not yet been tested. It is expected that after some ranging around this area, the price will drop, breaking the liquidity pool forming beneath the candles and moving toward TP 1.
This outlook remains valid as long as no daily candle closes above the invalidation level.
For risk management, please don't forget stop loss and capital management
When we reach the first target, save some profit and then change the stop to entry
Comment if you have any questions
Thank You

BTC Market Update – Bullish Trend RebuildingBTC Market Update – Bullish Trend Rebuilding
The market structure on Bitcoin highlights a sequence of expansion, consolidation, and sharp corrective phases. After reaching a peak around 115,000, the price shifted into a prolonged sideways phase, where liquidity built up before a decisive breakdown. This breakout introduced stronger bearish momentum, driving price toward lower ranges.
Currently, Bitcoin is stabilizing around 109,500 after the decline, with price action suggesting a potential extension into deeper liquidity zones near the lower range before regaining upward momentum. The projected flow reflects a scenario where downside movement acts as a liquidity sweep, providing the conditions for buyers to re-engage.
The broader outlook remains constructive. Even with short-term pressure favoring the downside, the long-term structure still supports recovery potential. A strong reaccumulation phase could lift Bitcoin back toward the 115,000 zone, aligning with the market’s tendency to reclaim imbalance after periods of sharp displacement.

Bitcoin Roadmap: Can BTC Hold the $108K Before Next Big move!?Bitcoin( BINANCE:BTCUSDT ) managed to break the Support zone($110,920-$109,900) and Support lines yesterday with the help of a Bearish Marubozu Candle(the Marubozu candle volume was acceptable).
Bitcoin is still moving in the Heavy Support zone($112,000-$105,800) and near the important Support line, Potential Reversal Zone(PRZ) , Cumulative Long Liquidation Leverage($108,165-$107,000).
In terms of Elliott Wave theory, Bitcoin appears to be completing microwave 5 of the main wave 3. Microwave 4 of the main wave 3 is of the Contracting Triangle type, and the main wave 3 is of the extended type.
I expect Bitcoin to start rising and attack the Resistance lines after completing the main wave 3 from the Potential Reversal Zone(PRZ) , Support zone($108,200-$107,240), and Important Support line.
Cumulative Short Liquidation Leverage: $110,624-$109,836
Note: If Bitcoin touches $106,800, we can expect a break of the Heavy Support zone($112,000-$105,800).
Note: If Bitcoin goes above $111,000, we can expect a renewed rise in Bitcoin.
---------------------------------------------
One of the indices that helps the Roadmap of Bitcoin and other tokens is the USDT.D%.
USDT.D% currently seems to have managed to break the heavy resistance zone and this is NOT good news for Bitcoin and other tokens, and perhaps a further correction in the crypto market is on the way.
USDT.D%’s roadmap for me is that it is almost in line with today’s analysis of Bitcoin.
---------------------------------------------
Please respect each other's ideas and express them politely if you agree or disagree.
Bitcoin Analysis (BTCUSDT), 1-hour time frame.
Be sure to follow the updated ideas.
Do not forget to put a Stop loss for your positions (For every position you want to open).
Please follow your strategy and updates; this is just my Idea, and I will gladly see your ideas in this post.
Please do not forget the ✅' like '✅ button 🙏😊 & Share it with your friends; thanks, and Trade safe.

Bitcoin Setup: Eyeing CME Gap at $113KBitcoin( BINANCE:BTCUSDT ) is currently trading in a Heavy Support zone($112,000-$105,800) and near the Support zone($110,920-$109,900), Support lines, Potential Reversal Zone(PRZ) , and Cumulative Long Liquidation Leverage($110,430-$109,660).
In terms of Elliott Wave theory, Bitcoin seems to have completed a microwave 5, the reason for today's drop was the correction in the SPX500 index( SP:SPX ) and the release of US indices(Final GDP q/q, Unemployment Claims).
Also, we can see the Regular Divergence(RD+) between Consecutive Valleys.
I expect Bitcoin to move back above 100_EMA(Daily) because the breakout volume was not enough, and attack the Resistance lines. If the Resistance lines are broken we can expect the CME Gap($113,380-$113,275) to fill.
First Target: $112,600
Second Target: $113,280
Stop Loss(SL): $109,280
Cumulative Short Liquidation Leverage: $114,866-$113,720
Please respect each other's ideas and express them politely if you agree or disagree.
Bitcoin Analysis (BTCUSDT), 1-hour time frame.
Be sure to follow the updated ideas.
Do not forget to put a Stop loss for your positions (For every position you want to open).
Please follow your strategy and updates; this is just my Idea, and I will gladly see your ideas in this post.
Please do not forget the ✅' like '✅ button 🙏😊 & Share it with your friends; thanks, and Trade safe.

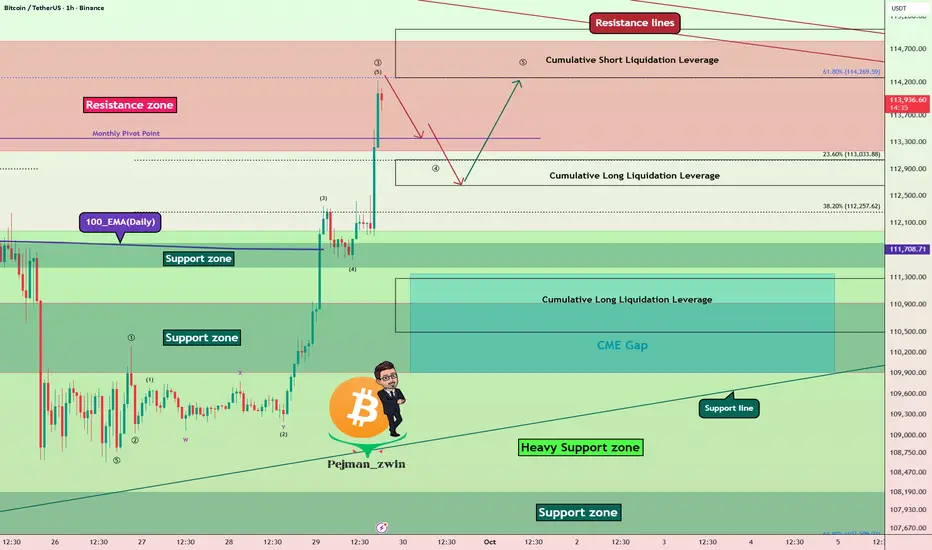
Bitcoin Outlook: From Support Bounce to Short Liquidation TargetBitcoin ( BINANCE:BTCUSDT ) moved as I expected in my previous idea ( Long and Short positions hit their targets ).
Bitcoin is currently moving near the Resistance zone($114,820-$113,170) , Resistance line, and the Monthly Pivot Point , and seems to have failed to break 100_EMA(Daily) .
In terms of Elliott Wave theory , Bitcoin completed wave 5 as I expected by attacking 100_EMA(Daily) and Heavy Support zone($112,000-$105,800) , and we can expect more bullish waves .
I expect Bitcoin to break the Resistance line in the coming hours and attack the Resistance zone ($114,820-$113,170) and the Cumulative Short Liquidation Leverage ($114,334-$113,400) .
Cumulative Long Liquidation Leverage: $110,950-$110,350
Note: If Bitcoin goes above $115,000, we should expect Bitcoin to rise again.
Please respect each other's ideas and express them politely if you agree or disagree.
Bitcoin Analysis (BTCUSDT), 1-hour time frame.
Be sure to follow the updated ideas.
Do not forget to put a Stop loss for your positions (For every position you want to open).
Please follow your strategy and updates; this is just my Idea, and I will gladly see your ideas in this post.
Please do not forget the ✅' like '✅ button 🙏😊 & Share it with your friends; thanks, and Trade safe.
Bitcoin Analysis On Lower TimFrameBitcoin’s movement has truly become complex and trendless, and the drops are not happening with momentum. It’s worth taking a look at Bitcoin’s moves on the lower timeframes.
For opening a short position, we need to wait for the red-marked zone.
If the price reaches the red zone and we enter a position, we will not exit our short position in the green-marked zone, and in this analysis, we are not looking for long trades.
For risk management, please don't forget stop loss and capital management
Comment if you have any questions
Thank You
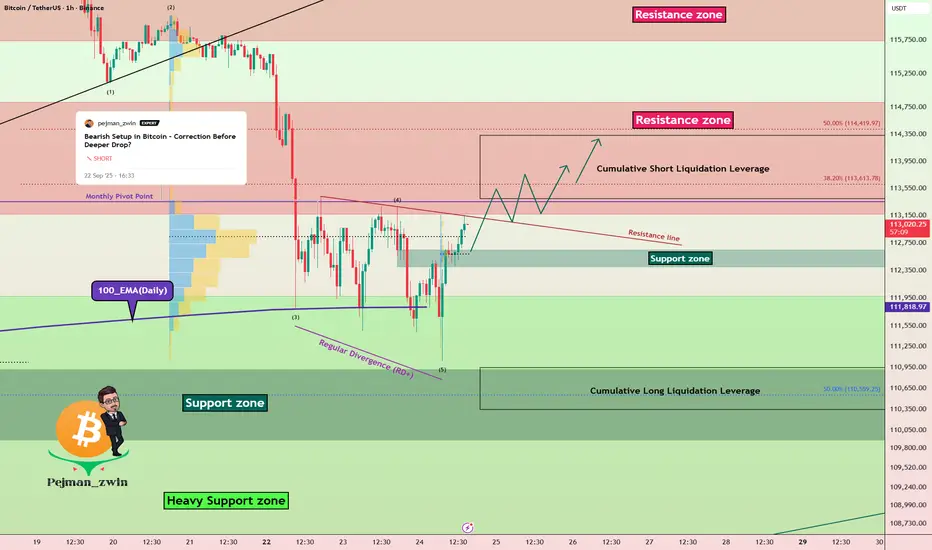
Bearish Setup in Bitcoin – Correction Before Deeper Drop?Bitcoin ( BINANCE:BTCUSDT ) started to decline and broke the ascending channel and Support zone($114,820-$113,170) with the help of the Bearish Flag Pattern , as I expected in the previous idea update .
Do you think Bitcoin can go below $105,000 !?
Bitcoin is once again approaching 100_EMA(Daily) and the Heavy Support zone($112,000-$105,800) .
From the perspective of Elliott Wave theory , Bitcoin appears to have completed the Zigzag Correction(ABC/5-3-5) in the ascending channel, and now it seems that we should expect bearish waves .
I expect Bitcoin to FAIL to break the 100_EMA(Daily) with one attack and have an upward correction to Fibonacci levels and Cumulative Short Liquidation Leverage($114,098-$113,229) , and then re-attack the Heavy Support zone($112,000-$105,800) and 100_EMA(Daily) .
Cumulative Long Liquidation Leverage: $111,850-$110,421
Note: If Bitcoin goes above $115,000, we should expect Bitcoin to rise again.
Note: There is also a possibility that the SPX500 index( SP:SPX ) will also correct and, given Bitcoin's correlation with this index, cause Bitcoin to correct further.
Please respect each other's ideas and express them politely if you agree or disagree.
Bitcoin Analysis (BTCUSDT), 4-hour time frame.
Be sure to follow the updated ideas.
Do not forget to put a Stop loss for your positions (For every position you want to open).
Please follow your strategy and updates; this is just my Idea, and I will gladly see your ideas in this post.
Please do not forget the ✅' like '✅ button 🙏😊 & Share it with your friends; thanks, and Trade safe.

Bitcoin's $1B Liquidation Nightmare—What's Next?Dive into Bitcoin's wild $1B liquidation chaos triggered by Powell's rate speech! From the half-point cut hype to the market's "holy sh*t" moment, I break down the events, lessons on money management, and why doing nothing might be your best move today. Full analysis inside—watch now! If it clicks, give a thumbs up and follow for more crypto insights.

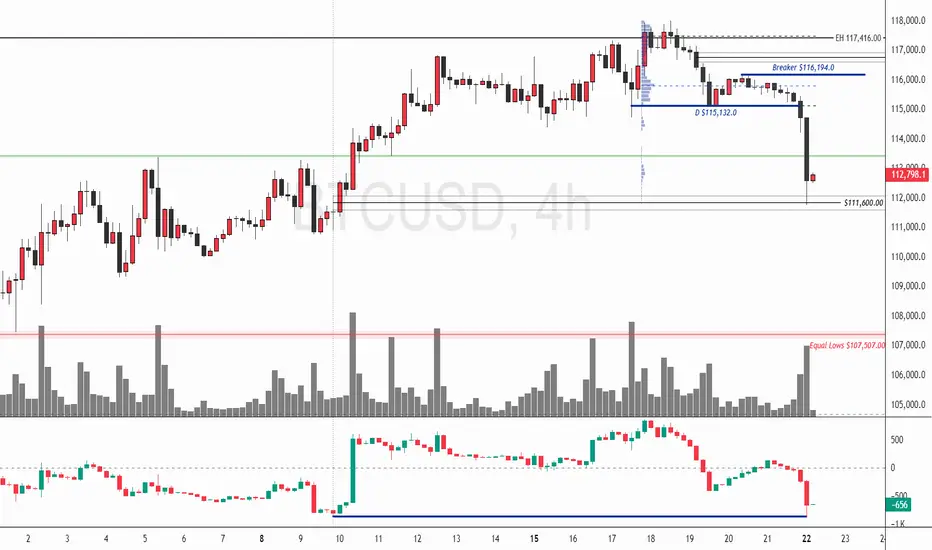
Bitcoin: Volume Spike Signals Temporary ReliefFenzoFx—Bitcoin sold off early in the week, now trading near $112,670.00. A high-volume 4-hour candle tapped the bullish FVG and ended with a wick, suggesting partial profit-taking by bears.
The short-term trend remains bearish due to displacement below $115,132.00 and active bearish FVGs. BTC/USD may consolidate near resistance before resuming its downtrend. If price rises toward the low-volume node near $115,132.00 and holds bearish momentum, it could target the equal lows at $107,507.00.
The bearish outlook is invalidated if BTC/USD closes above the breaker block at $116,194.00.
BTC Looks Bearish (12H)From the point marked as **Start** on the chart, it seemed that a bullish phase had begun on Bitcoin. This bullish phase formed a triangle, and now we are at the end of this triangle.
With a pullback to the red zone, a further drop could occur. The main target of this bearish move appears to be the 88K channel.
This view remains valid unless a daily candle closes above the invalidation level.
For risk management, please don't forget stop loss and capital management
When we reach the first target, save some profit and then change the stop to entry
Comment if you have any questions
Thank You

BITCOIN Update: Stay Alert (4H)This analysis is an update of the analysis you see in the "Related publications" section
Read the analysis carefully
Given the loss of the trendline, Bitcoin stalling, and decreasing momentum, the previous Bitcoin analysis needed to be updated.
If Bitcoin fails to make a valid breakout above the yellow line at $116,520 and does not sustain above it, a bearish scenario will emerge, and the price will drop significantly
A bullish outlook toward the supply zone shown on the chart above is only valid if Bitcoin executes a confirmed breakout above $116,520.
So stay alert and follow the chart closely.
For risk management, please don't forget stop loss and capital management
Comment if you have any questions
Thank You

Key PRZ Ahead for Bitcoin – Bounce or Breakdown?Bitcoin ( BINANCE:BTCUSDT ) moved as I expected in my previous idea and rose to the Resistance zone($118,580-$117,460) .
First of all, let me say that this is a short-term Bitcoin analysis .
Bitcoin is filling the CME Gap($116,115-$115,860) and is moving near the Support zone($116,900-$115,730) [, Cumulative Long Liquidation Leverage($115,555-$114,424) , Potential Reversal Zone(PRZ) , and the lower line of the ascending channel .
In terms of Elliott Wave theory , Bitcoin appears to be completing a wave C of the Expanding Flat(ABC/3-3-5) .
I expect Bitcoin to rise to at least $116,910 if it even manages to break the ascending channel.
Second Target: $117,760
Stop Loss(SL): $$115,300
Cumulative Short Liquidation Leverage: $118,965-$117,906
Please respect each other's ideas and express them politely if you agree or disagree.
Bitcoin Analysis (BTCUSDT), 1-hour time frame.
Be sure to follow the updated ideas.
Do not forget to put a Stop loss for your positions (For every position you want to open).
Please follow your strategy and updates; this is just my Idea, and I will gladly see your ideas in this post.
Please do not forget the ✅' like '✅ button 🙏😊 & Share it with your friends; thanks, and Trade safe.
BITCOIN Update: Stay Alert (4H)This analysis is an update of the analysis you see in the "Related publications" section
Read the analysis carefully
Given the loss of the trendline, Bitcoin stalling, and decreasing momentum, the previous Bitcoin analysis needed to be updated.
If Bitcoin fails to make a valid breakout above the yellow line at $116,520 and does not sustain above it, a bearish scenario will emerge, and the price will drop significantly
A bullish outlook toward the supply zone shown on the chart above is only valid if Bitcoin executes a confirmed breakout above $116,520.
So stay alert and follow the chart closely.
For risk management, please don't forget stop loss and capital management
Comment if you have any questions
Thank You

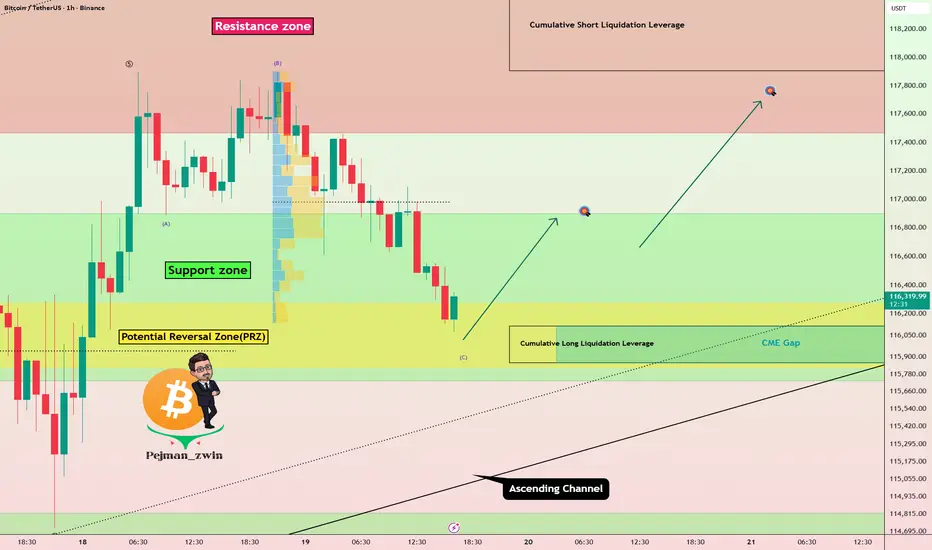
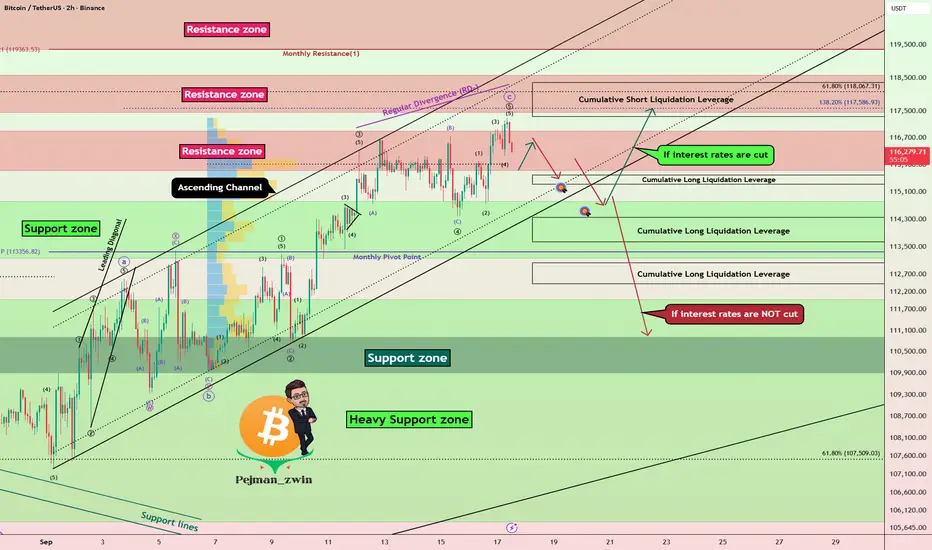
FOMC Day: Prepare for Potential Bitcoin Volatility!Today is a big day for the markets – the US Federal Funds Rate decision and the FOMC Press Conference are scheduled, events that could potentially change the game for Bitcoin ( BINANCE:BTCUSDT ) and other assets .
But until the meeting begins , we still have time to analyze the charts and prepare.
Keep in mind : as we get closer to the announcement and especially during the release, the market could turn highly volatile. Manage your positions wisely and don’t forget your stop-loss levels .
-------------------------------------------
Bitcoin rose about +2% yesterday on the news that " Trump Family's American Bitcoin just went public on the Nasdaq ."
Bitcoin is currently trading in an ascending channel and Resistance zone($116,900-$115,730) near the Cumulative Short Liquidation Leverage($118,354-$117,329) .
In terms of Elliott Wave theory , if interest rates cut , Bitcoin could be completing wave 4 and then rising again and possibly forming a new All-Time High(ATH) . On the other hand, if interest rates do NOT cut , Bitcoin appears to have completed wave C of the Zigzag Correction structure(ABC/5-3-5) .
Also, we can see the Regular Divergence(RD-) between Consecutive Peaks .
I expect Bitcoin to drop to at least $114,860(First Target) before the Fed meeting starts , and if interest rates are not cut , we will see a further and more sudden drop in Bitcoin . And if interest rates CUT , there is a high probability of a Bitcoin pump, so stick to the first target($114,860) for now.
Second Target: $114,470
Cumulative Long Liquidation Leverage: $115,597-$115,330
Cumulative Long Liquidation Leverage: $114,351-$113,640
Cumulative Long Liquidation Leverage: $113,031-$112,430
Do you think the Federal Reserve will cut interest rates?
Please respect each other's ideas and express them politely if you agree or disagree.
Bitcoin Analysis (BTCUSDT), 2-hour time frame.
Be sure to follow the updated ideas.
Do not forget to put a Stop loss for your positions (For every position you want to open).
Please follow your strategy and updates; this is just my Idea, and I will gladly see your ideas in this post.
Please do not forget the ✅' like '✅ button 🙏😊 & Share it with your friends; thanks, and Trade safe.
Bitcoin Cycle Analysis – The Fourth TurningThe dominant cycle identified here is ~292 bars, which has consistently marked major pivots in Bitcoin’s price action. Each cycle builds in intensity, and according to fractal theory, the fourth turning often delivers the most severe correction.
At present, BTC is pressing against the upper bounds of this dominant cycle. If the cycle roadmap continues to hold, we are now in the early stages of the declining phase, with downside risk extending into the mid-to-lower support zones.
Key Insight:
In fractal cycle analysis, the fourth turning is often the most devastating one. If this pattern repeats, the coming downswing could be sharper and deeper than previous declines, preparing the ground for the next major cycle low.
Caution is warranted as both fractal and cycle models are flashing warnings that this market may be in the process of topping out.

Rate Cuts, Liquidity, and BTC: Why 120K Is the Danger ZoneYesterday , while everyone was screaming about a Bitcoin dump, we caught the breakout of that resistance I showed you.
Today, I want to talk about the upcoming rate cut news , what could happen after it, and what we should do with our open positions.
Now personally, I’m still holding the breakout position we entered a week ago . I didn’t secure any profits, and honestly—I didn’t even want to. Because if the Fed cuts rates, we could kick off the next leg of this uptrend.
But keep this in mind: opening fresh positions around 120K IS NOT EASY AT ALL. Why?
Because there’s massive liquidity up there, huge volatility, and the chances of getting stopped out are very high. That’s exactly why I’d rather hold my position from earlier than be forced to open new ones in that zone.
👉 Let’s look at yesterday’s daily candle: it closed super bullish. This shows the market is leaning positive on the idea of a rate cut. But is this candle just front-running the news? Hard to say. We can’t exactly go ask every trader if they bought because of the Fed. So, better not overthink it.
I personally expect a short-term dip after the news drops. But more important than the cut itself are Powell’s words. If he signals more cuts are coming, markets could explode higher. If he says “not anytime soon,” we might get a pullback.
⚠️ My advice:
If you don’t already have a position, stay on the sidelines for a few hours. Any stop loss you put now has a big chance of getting hit.
But if, like me, you’re already in from the earlier triggers, just hold. It’s worth it.
For me, I’m also long on GBP/USD, and I didn’t secure profits there either—I’m waiting to see how it reacts.
👉 Quick look at BTC.D: dominance is rising with Bitcoin, which means it’s smarter to keep focus on BTC rather than altcoins. When dominance turns bearish again, that’s when we’ll shift back to alts.
This is why for the past few days I’ve been saying: stick with Bitcoin. Liquidity is flowing into it.
Ethereum? It gave back almost 70% of its recent move.
LONG STORY SHORT: don’t do anything stupid here. The best play, if you don’t have an open position, is to stay patient. Don’t FOMO.
Remember: the most important thing is not Bitcoin’s price itself. It’s stop-loss size, liquidity zones, and momentum. here in Skeptic Lab, that’s exactly what we dig into.
I’ll try to post another update after the Fed news drops.
Until then, stay safe. Peace ✌️

Bitcoin to 105K? Stop Talking Sh*t, Here’s the TruthEveryone’s screaming about a Bitcoin dump … but where’s the proof? 🤔
In this video, I break down the weekly, daily, 4H, and even 15m to show you the real triggers that matter for Bitcoin’s next move. Spoiler: the big picture is still bullish AF.
We’ll also look at Wednesday’s Fed rate decision and how it could shake the market.
Stay skeptical. Don’t FOMO. Manage risk.
Boost if it helped.
(P.S. Sorry for the voice — I’m fighting through a nasty cold :/)

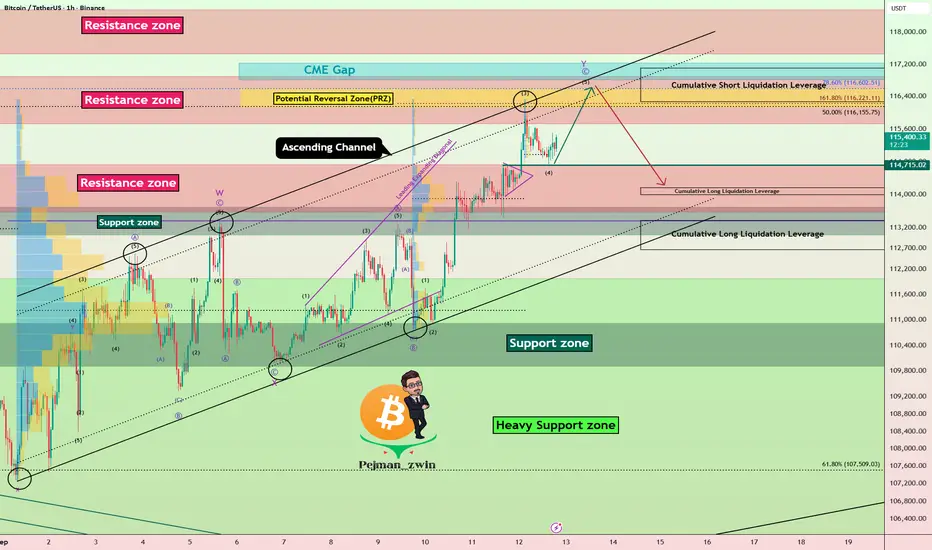
Bitcoin Roadmap | Short termBitcoin ( BINANCE:BTCUSDT ) has been experiencing a lot of volatility over the past 10 days, and the reasons for these movements could be the announcement of US indices + geopolitical issues Those who were in favor of Bitcoin caused Bitcoin to pump .
Bitcoin's movements over the past 10 days have managed to form an Ascending Channel .
In terms of Elliott Wave theory , Bitcoin appears to be completing microwave 5 of microwave C of the main wave Y .
I expect Bitcoin to try to complete main wave Y , and if we find signs of a reversal in the Resistance zone($116,900-$115,730) and Potential Reversal Zone(PRZ) , we can expect a further decline . Also, it is expected that the CME Gap($117,235-$116,820) will eventually be completed in the main wave Y .
Cumulative Long Liquidation Leverage: $114,165-$113,989
Cumulative Long Liquidation Leverage: $113,370-$112,664
Cumulative Short Liquidation Leverage: $117,102-$116,266
Please respect each other's ideas and express them politely if you agree or disagree.
Bitcoin Analysis (BTCUSDT), 1-hour time frame.
Be sure to follow the updated ideas.
Do not forget to put a Stop loss for your positions (For every position you want to open).
Please follow your strategy and updates; this is just my Idea, and I will gladly see your ideas in this post.
Please do not forget the ✅' like '✅ button 🙏😊 & Share it with your friends; thanks, and Trade safe.
Bitcoin: Bullish Bias Strengthens FenzoFx—Bitcoin remains bullish, targeting recent highs at $117,416.00. Currently, BTC is consolidating near $115,000.00, aligning with a bullish fair value gap and support at $114,464.00. Today’s liquidity sweep below the FVG’s mean threshold reinforces the bullish bias.
Immediate resistance stands at $115,652.00. A break above this level may resume the uptrend toward $117,416.00. However, if price drops below $114,464.00, the bullish outlook should be reconsidered.
