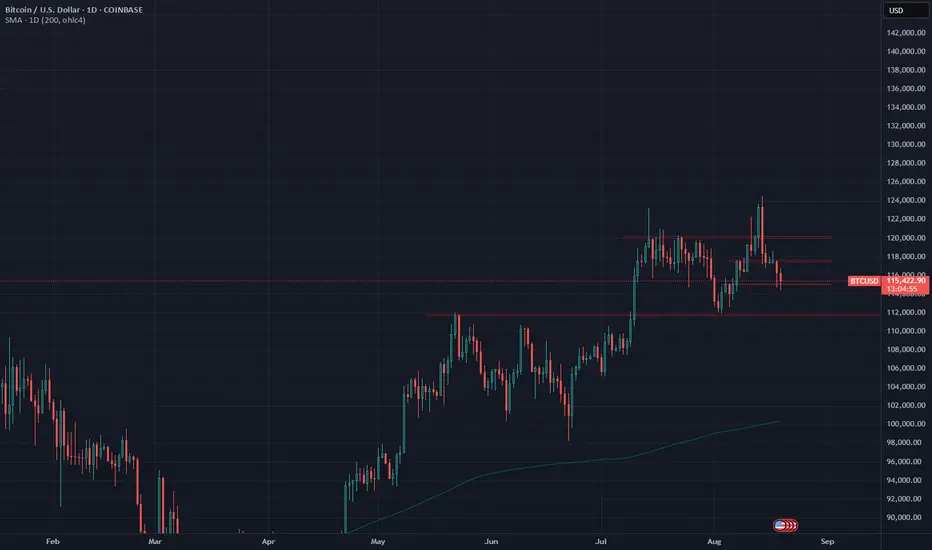
BTC, should we be worried?Despite the calls for a double topping pattern, Bitcoin is yet to enter the territory of worry.
For the time being, support can be expected from as low as $112k. However, potentially signaling a short-term recovery, BTC is testing $115k as support - previous resistance.
Continued short-term weakness could lead to a test of $112k, effectively creating a range with $120k as resistance.
Bitcoin's slow upward grinding could be a reflection of the shift in the market and its players.
Bitcoinanalysis
Bitcoin : Stay heavy on positions
In the short term, there's a potential for a bounce off the previous "short-term overbought" zone, which now serves as support—a textbook pattern.
From a longer-term perspective, my view remains unchanged.
Bitcoin : Stay heavy on positions (2x)
** This analysis is based solely on the quantification of crowd psychology.
It does not incorporate price action, trading volume, or macroeconomic indicators.

Bitcoin Tests Key Support at $115KFenzoFx—Bitcoin's downtrend extended to $115,000, filling the bullish fair value gap now acting as support. The current price equals 25.0% of the previous bullish leg. If BTC closes and stabilizes below $115,000.0, the downtrend may deepen toward the $112,000.0 support order block.
Conversely, a close above $117,445.0 would invalidate the bearish outlook. This level marks the last bearish candlestick pattern and a break of structure. If confirmed, BTC/USD could recover recent losses, targeting resistance at $119,339.0.

The REAL Bull run Test for Bitcoin is NOW
As mentioned in Previous posts about the Blue Arc of Resistance, the Arc that has rejected EVERY Bitcoin ATH since 2011, it HAS to be Crossed and PA to keep above
We crossed it recently and rose to a New ATH.
We now need to Test this Arc as support and it look like this is about to happen.
116K is the threashold
For the full story on this Arc and why it is so important we remain above, look to th elink below for the post about it.
Good luck.

BTC/USDT Analysis — Market Buyer Still Absent
Hello everyone! This is the CryptoRobotics trader-analyst with your daily market review.
Yesterday, Bitcoin finally tested the $117,500–$116,000 buy zone (accumulated volumes), triggering a weak wave of buying. Currently, trading is taking place within a new volume zone, where sellers still dominate. Inside the current sideways range, the $118,480 level acts as a local sell zone (area of aggressive selling).
At the moment, we expect a continuation of the local decline with another test of the $117,200 low. Buying positions are not advisable right now — despite being in a support zone, there’s still no sign of active buyers. This increases the likelihood of a drop to the next liquidity zone.
Buy Zones:
$117,500–$116,000 (accumulated volumes)
$115,300–$114,000 (accumulated volumes)
Sell Zones:
$118,480 (local zone, aggressive seller activity)
$121,200–$122,200 (buy absorption)
This publication is not financial advice.

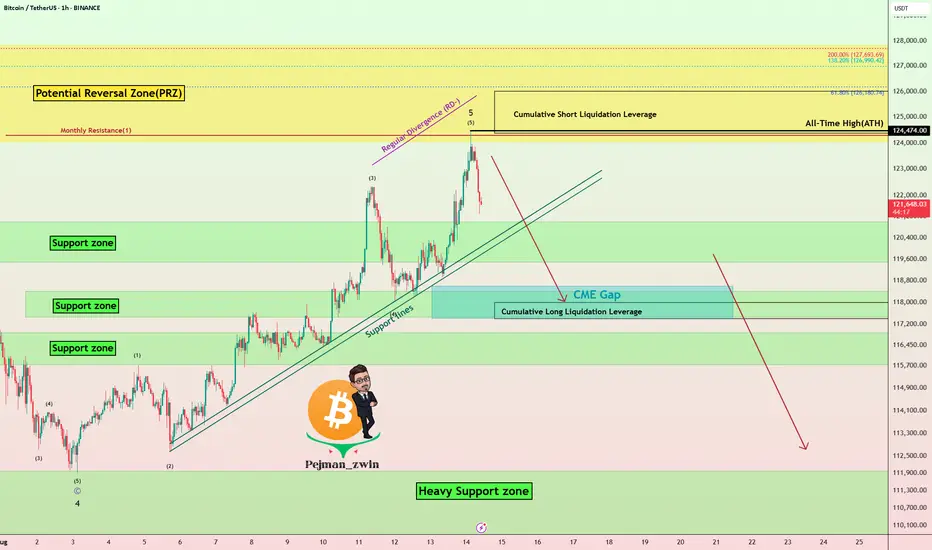
Bitcoin Hits New ATH – Is This the Final Pump Before a Crash?Bitcoin ( BINANCE:BTCUSDT ) reacted well to the Potential Reversal Zone(PRZ) that I told you about in the previous idea and started to decline, but Bitcoin managed to create a new All-Time High(ATH=$124,474) in this rally.
Do you think Bitcoin can create a new All-Time High(ATH) again in the coming hours or should we wait for a main correction?
In terms of Elliott Wave theory , Bitcoin appears to have completed the main wave 5 in the Potential Reversal Zone(PRZ) , and we should expect corrective waves .
Also, we can see the Regular Divergence(RD-) between Consecutive Peaks .
Looking at the USDT.D% ( CRYPTOCAP:USDT.D ) chart, it also seems that with the breaking of the upper line of the descending channel, we can expect an increase in USDT.D% , which could cause a decrease in the price of Bitcoin .
I expect Bitcoin to at least move towards filling the CME Gap($118,600-$117,425) AFTER breaking the Support lines .
Cumulative Short Liquidation Leverage: $126,000-$124,367
Cumulative Long Liquidation Leverage: $118,000-$117,400
Note: Stop Loss(SL): $126,123
Please respect each other's ideas and express them politely if you agree or disagree.
Bitcoin Analyze (BTCUSDT), 1-hour time frame.
Be sure to follow the updated ideas.
Do not forget to put a Stop loss for your positions (For every position you want to open).
Please follow your strategy and updates; this is just my Idea, and I will gladly see your ideas in this post.
Please do not forget the ✅' like '✅ button 🙏😊 & Share it with your friends; thanks, and Trade safe.
This BTC Pullback Doesn’t Break the Bullish StructureYesterday, BTC dropped around 5% from its freshly printed intraday ATH, reaching a low of 117,300. Should bulls be worried?
In my view, this drop can’t be seen as more than just a correction — while it was indeed quite deep, the overall structure remains fully intact.
Price is still comfortably above the ascending trendline that started in April, and even higher than the nearest horizontal support.
Bottom line: As long as BTC stays above the 110–112k zone, there’s no real reason for concern.
For short-term traders, this dip could even be seen as a buying opportunity — anticipating a push towards a new ATH above 125k. 🚀
BTC is Still Bullish (4H)After completing the X wave at the bottom of the chart, it appears that Bitcoin has formed a bullish diamond-shaped diametric pattern and is now at the beginning or middle of wave E within this diametric.
It is expected that, by holding the green-marked zone, the price will soon move toward the next targets.
We have set three targets for wave E, which are marked on the chart.
A daily candle close below the invalidation level will nullify this analysis.
For risk management, please don't forget stop loss and capital management
When we reach the first target, save some profit and then change the stop to entry
Comment if you have any questions
Thank You

Bitcoin Near $125K Resistance — Is the Rally Over?Bitcoin ( BINANCE:BTCUSDT ) increased to $120,000 after breaking resistances , as I expected in my previous idea .
Bitcoin has already managed to break the Resistance zone($121,000-$119,000) and is moving near the Potential Reversal Zone(PRZ) .
According to Elliott Wave theory , Bitcoin is completing the 5th major impulse wave . In my opinion, this is the last bullish wave of Bitcoin, and after that we should wait for the main correction of Bitcoin . Do you agree with me that it is time to run and take profit!?
To get a better view of the main waves , I suggest you look at the idea below .
Also, since Bitcoin is correlated with the S&P500 Index ( SP:SPX ) and since I also foresee the possibility of a correction in the S&P500 Index, it is also possible to expect a decrease in the price of Bitcoin based on the S&P500 Index analysis .
I expect Bitcoin to start declining after entering the Cumulative Short Liquidation Leverage($125,000-$122,580) and Potential Reversal Zone(PRZ) and at least fill the CME Gap($119,100-$117,425) .
Note: There are heavy sell orders around $125,000.
Cumulative Long Liquidation Leverage: $120,866-$119,442
Cumulative Long Liquidation Leverage: $117,743-$115,452
What is your opinion on Bitcoin and its trend? Can it see $130,000, or will a main correction begin?
Please respect each other's ideas and express them politely if you agree or disagree.
Bitcoin Analyze (BTCUSDT), 2-hour time frame.
Be sure to follow the updated ideas.
Do not forget to put a Stop loss for your positions (For every position you want to open).
Please follow your strategy and updates; this is just my Idea, and I will gladly see your ideas in this post.
Please do not forget the ✅' like '✅ button 🙏😊 & Share it with your friends; thanks, and Trade safe.

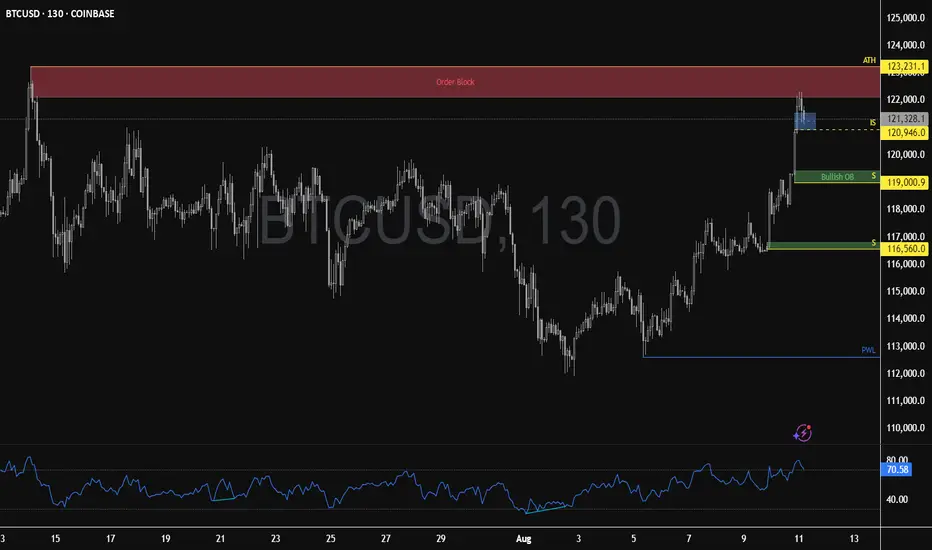
Bitcoin Pulls Back After Testing Bearish BlockFenzoFx—Bitcoin hit the bearish order block and pulled back as expected. RSI 14 dropped below the overbought zone to, signaling increased selling pressure.
Immediate support lies at $120,946. A close below this level could extend the downtrend, targeting the bullish order block at $119,000.00. No bullish setup is expected until price consolidates near discount levels at $119,000.00 and $116,560.00.
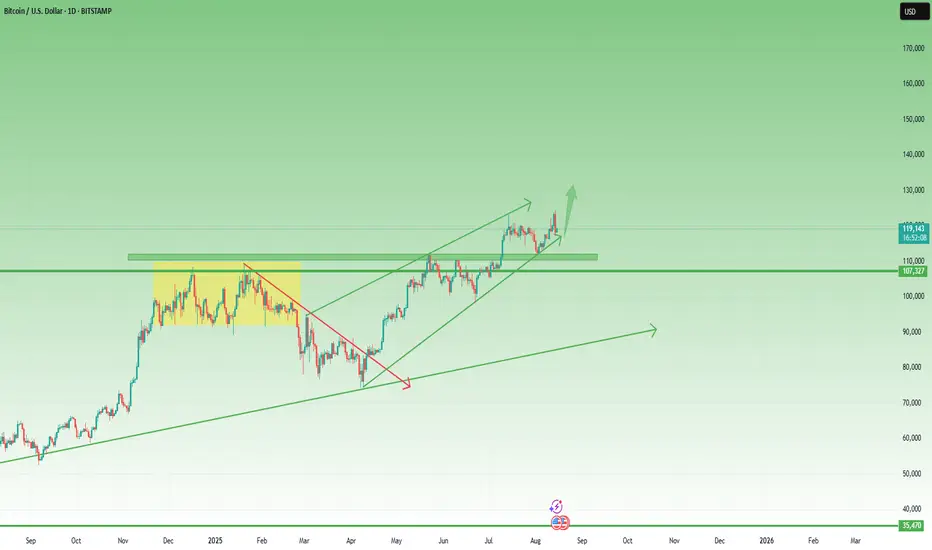
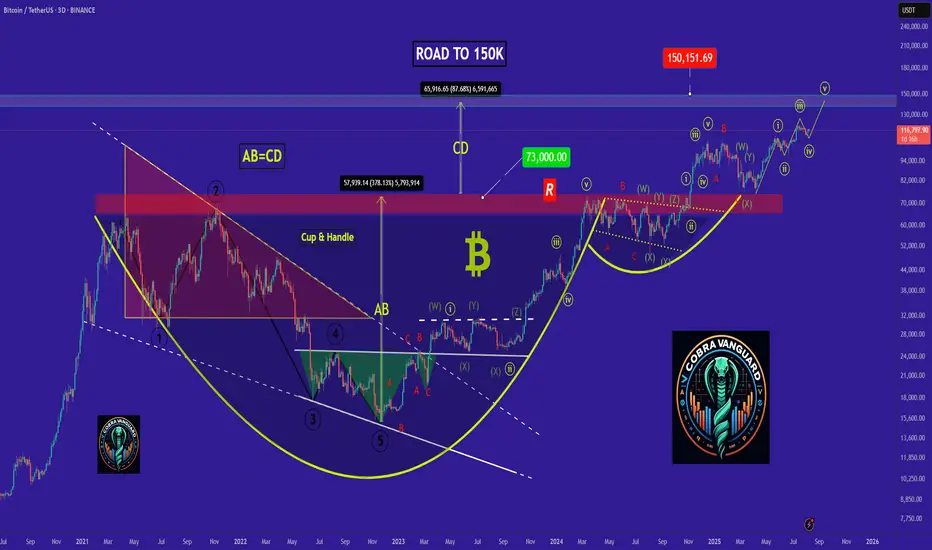
bitcoin - Time to buy again!The price seems to have completed the fourth corrective wave, and from now on, it's time for a price increase, which will continue up to around $150k .
previous analysis
BITCOIN has broken Free - The Next cycle type begins- WHY ?
I have been talking about the Blue Arc of resistance for a while now.
The ARC that has rejected EVERY ATH since Bitcoin began its true rise in Value back in 2011.
I am not going to get to technical right now as I have had only 1 coffee..lol..
Lets begin
I have 3 charts with this Arc on , all slightly different so as to allow for small errors in plotting or calculation.
ALL charts now show PA Above the Arc.
Why is this so important ?
As previously explained, that Blue Arc is a part of a Calculated Fibonacci Spiral.
Calculated from Each ATH to the next and using the difference as a part of that calculation, I was able to pinpoint the centre of this Arc.
And here is the Full picture.
What I am finding a little interesting is how that centre is on MARCH 2020 - That Sudden and worrying COVID CRASH !
But that is a subject for another time.
The Two important things to take of here is how PA began rising on this spiral as soon as PA entered it ( Left ) and unless we broke out of it now, PA would have been dragged back down by December. The time spent inside this spiral are the cumulative years of Bitcoin.
It is also very interesting how the 3 "Cycles " we have had in this channel. have ended perfectly at that intersection of the Blue Arc and the underlying line of support, that PA has not dropped below since we entered the channel back in 2012
To me, that is more than just a coincidence.
And if we look at a smaller time frame, we can see that PA has broken over this Arc, with strength.
The Daily chart above does show us that we do still have challenges ahead.
For instance, there is that line of local resistance just above, that could , under the right circumstances, push PA back down with vengeance should the Bears take over.
But I do not think that will happen yet but it would be nice if we could climb over that and use it as support.
We have done on 2 previous occasions this cycle but each time, we got pushed back under.
3rd time lucky ?
The 4 hour chart gives hope.
Here we can see how that Blue Arc was used as support but once it failed, the Bulls were Quick to get back over.
To me, this shows us that the Bulls have every intention of keeping Bitcoin High and above that Blue Arc.
But the longer we wait to get over that local line of resistance above, and use as support, the further away it Gets.
Currently, the Target to get over that lline is around 140K
Near Term projections of PA, in a bullish run, are around 160K -> 180K
This would give PA that underlying line of support.
So, we wait to see how this plays out but THE MOST IMPORTANT THING ?
We Must remain above that line, the Blue Arc....that currently sits around 115 -118K
The Next Few weeks are VITAL and I remind you..August has nearly twice as many RED monthly closes as Green..Unless it is in a Bull run....;-)
The Daily RSI has room to move still but is High
The Weekly RSI is Similar in hieght, with room to move.
So, We could be in a good position to start that New Cycle type, out of the Spiral that Created Bitcoin as we now know it. The 4 year Flow could change as mass adoption takes pace and People simply do not Buy / Sell as we used to do.
But it is impossible to really know whats coming.
We can only watch and learn. We may well end up having the 4 year cycles again.
After all, that gave us superb profit making opportunities.
Or will Bitcoin become the Store of Value, the Digital Gold ?
Time will tell.
Have a good week and stay safe

Bitcoin is super bullish (4H)This analysis is an update of the analysis you see in the "Related publications" section
If you’ve been following our previous analyses, we had a bullish outlook on Bitcoin from the lower green zone.
An important level on the Bitcoin chart has been reclaimed, and it is expected to move toward the next targets if it consolidates above the red box.
The targets are marked on the chart.
A daily candle closing below the invalidation level will nullify this analysis.

Bitcoin Bounces Back — Is $120K the Next Stop?!Bitcoin ( BINANCE:BTCUSDT ) reacted well to the 50_SMA(Daily) and the Heavy Support zone($112,000-$105,800 and started to rise again.
The question is, can Bitcoin reach $120,000 again and even create a new All-Time High(ATH)!?
In terms of Elliott Wave theory , it seems that Bitcoin has managed to complete the main wave 4 in the descending channel . To confirm the end of the main wave 4 , we must wait for the upper line of the descending channel to break. The structure of the main wave 4 is a Zigzag Correction(ABC/5-3-5) .
I expect Bitcoin to trend higher in the coming hours and attack the resistance area and the upper line of the descending channel(First Target: $117,490) .
Do you think Bitcoin's main correction has begun, or does Bitcoin still have a chance to create a new ATH?
Second target: $119,991
Cumulative Long Liquidation Leverage: $113,526-$112,591
Note: Stop Loss: $111,070
Please respect each other's ideas and express them politely if you agree or disagree.
Bitcoin Analyze (BTCUSDT), 2-hour time frame.
Be sure to follow the updated ideas.
Do not forget to put a Stop loss for your positions (For every position you want to open).
Please follow your strategy and updates; this is just my Idea, and I will gladly see your ideas in this post.
Please do not forget the ✅' like '✅ button 🙏😊 & Share it with your friends; thanks, and Trade safe.

Bitcoins has slipped back under Long Term resistance. CAUTION
It is VERY clear to see and some just do not want to see it
That Blue Arc, Arrowed, is an Arc that has rejected EVERY ATH since Bitcoin began rising from its early Low.
And also understand, that arc is not just a random line, It is Calculated and is part of a Fibonacci Spiral.
ANYWAY, as we can see on the chart. PA is heading to a Squeeze with this Arc and a rising line of support below.
This line of support has NEVER failed since PA crossed over it.
So we have a n arc of Resistance that has Never been broken.
We have a line of support that has Never been Broken.
One of these two line Has to break.
The Apex of this Squeeze us Dec this year and, as we all know, PA always react before the Apex.
So, How accurate is the placement of this Arc ?
Lets see the Daily chart
Here we can see that PA has for most of this year, been trying to break over and, in July, succeeded, only to fall back below a week ago.
To many extents this played along Very well with the monthly Candle Colour patterns I been posting.
But the fact remains, we are once again BELOW a HUGE powerful line of resistance that we MUST break above and stay above.
We do have many lines of Support below, Local and some, longer term.
We can close on the 4 hour just to see where we are in a more local time frame.
Here, we can see that 105K is a very possible line of support initially that we need to watch and see what happens. Hopefully, we range above this level and let RSI cool off.
The RSI is always a great gauge to watch here and the daily offers some hope of remaining in this current PA range
It must be said that RSI could still drop lower, though we have room to rise before PA becomes OverBought on the Daily.
But the weekly shows us a longer term CAUTION flag.
While we have not been OverBought on the weekly for a long time, we ARE up high, leaving the potential for a Drop.
But with the Daily in good shape, this could be postponed. In this cycle, previous times we got overbought, PA ranged while RSI dropped.
This could repeatover and over........But PA needs to rise OVER that line of resistance and turn it into Support.
This is NOT a choice//it is a MUST HAPPEN if Bitcoin is to continue its rise higher.
The current Price line of this Blue Arc is around 116K.
What we realy need to understand about this Arc is that once we pass December 2025, that arc begins to DROP.
And if PA is below it still, PA will get dragged down with it, into an ever decreasing price model.
So, there we have it
Simple as that.

Bitcoin Consolidates Below VWAP Amid Structural UncertaintyFenzoFx—Bitcoin’s downtrend eased near the bullish order block but hasn’t entered the zone. It’s currently consolidating around $114,360.0, below the July 14 VWAP.
No clear break of structure has occurred, making long positions risky. Key support lies at $110,650.0, backed by high volume.
Technically, price is expected to enter this zone. If it does, traders should watch for a break of structure on lower time frames like M15. This setup offers a minimum 1:7 risk-to-reward.
If BTC closes below the main support, bearish momentum may continue toward the next order block at $110,120.0.

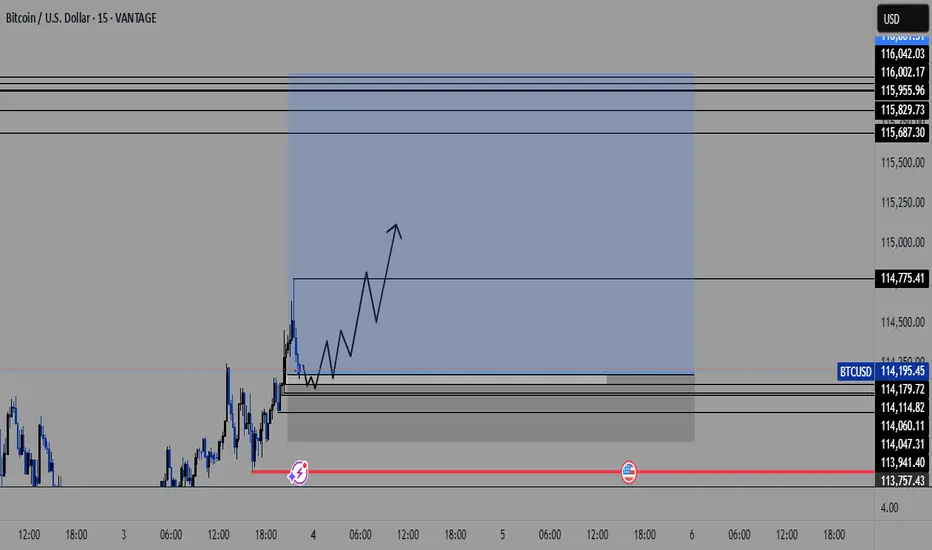
Bitcoin to $116K in a Week? Here's the Case Everyone's IgnoringI know it sounds wild — but hear me out.
BTC is primed for something massive, and the ingredients are all on the table:
✅ ETF inflows are quietly stacking
✅ Supply shock post-halving is still underestimated
✅ DXY weakening = flight to hard assets
✅ Global uncertainty = Bitcoin safety bid
✅ Technicals pointing to a breakout above ATH with no resistance until $100K+
We're seeing the early signs of parabolic structure forming — and if volume confirms, this could move fast. Everyone thinks a 2x in a week is impossible... until it isn't.
Not saying it’s guaranteed — but if you've been around long enough, you know BTC doesn’t move linearly.
👀 Watch the $72K breakout zone closely. If it flips with conviction and volume, $116K is not out of the question.
Drop your charts. Agree or disagree?
Do you think I'm joking ???As I said, Bitcoin broke the triangle, and now with a slight price correction(109k), it could surge to $150k , and you still think I'm joking!!
Previous analysis

BTCUSD Technical Analysis – Bearish Momentum Towards Fair Value BTCUSD Technical Analysis – Bearish Momentum Towards Fair Value Gap
Bitcoin is showing clear bearish pressure after rejecting from the previous resistance zone around 118,800 – 120,000. The market structure and smart money concepts indicate potential for further downside.
🔍 Key Observations:
Previous Resistance Respected: Price failed to break through the strong resistance zone marked near the 119,200–120,000 level, showing strong institutional selling interest.
Market Structure Breaks:
BOS (Break of Structure) and CHoCH (Change of Character) confirmed bearish shift.
Price has maintained lower highs and lower lows, signaling a bearish trend.
Liquidity/Fair Value Gap Zone: The market is currently targeting the liquidity/FVG zone between 116,400 – 116,100, which aligns with price inefficiency and unfilled orders.
Support Zone Ahead: A strong support zone is visible near 115,600 – 115,200. Expect a potential reaction or consolidation here.
📌 Strategy & Bias:
Short Bias Active until price reaches 116,116 (target).
Watch for possible bullish reversal signs in the support/FVG zone.
Ideal for scalp-to-swing short trades, with tight SL above recent EQH.
📚 Educational Notes:
Fair Value Gaps (FVG) indicate institutional imbalances and are often revisited by price.
CHoCH and BOS are early signals of smart money moves – always monitor them in confluence with volume and zones.

BTCUSD Analysis : Major Breakout Setup | Big Move Loading"Bitcoin Coiling Below Key Resistance – Breakout or Trap?"
🔍 Technical Overview:
Bitcoin is currently trading within a compressed range, sitting just below a key descending trendline that has capped upside movement for multiple sessions. Price is consolidating between minor highs and lows, hinting at a build-up of momentum for the next breakout move.
The setup presents a classic compression inside a bearish wedge, but with increasing bullish pressure evident from higher lows and wick rejections near minor supports.
🧱 Detailed Technical Breakdown:
🔸 1. Descending Trendline Structure
Price has formed a downward sloping resistance line from earlier highs.
This trendline has acted as a dynamic ceiling, rejecting multiple bullish attempts.
Each time price approaches it, the rejection gets weaker, indicating a possible breakout attempt soon.
🔸 2. Multiple Minor & Major Zones
Minor Resistance: Around $118,800–$119,200
A short-term ceiling that has paused bullish rallies.
Price needs a clean break and close above this to initiate momentum.
Major Resistance: ~$121,000–$121,200
This zone aligns with a previous significant swing high.
A break above here could result in strong bullish continuation toward ATH levels.
Minor Support: ~$117,000
Price has repeatedly bounced from this level.
A breakdown would indicate fading bullish strength and open the downside.
Major Support: ~$115,000
A historically strong demand zone.
If BTC fails all bullish attempts, this would be the final defense for buyers.
🧠 Market Psychology Insight:
Price is trapped between aggressive short-term sellers and accumulating buyers.
Buyers are placing confidence in this area by defending higher lows.
Sellers are still protecting the trendline, but with each retest, the defense weakens.
This is a classic equilibrium zone where liquidity is building—once imbalance hits, a strong impulsive breakout (either direction) is likely.
Volume and momentum should be watched closely as a breakout with confirmation may trap the opposite side, leading to a strong move (short squeeze or long liquidation).
🔮 Scenario Forecasts:
📈 Bullish Breakout Scenario:
Price breaks above $119,200 → minor resistance flips to support
Retest of the broken trendline confirms a bullish breakout
Price targets:
First Target: $121,000–$121,200 (major resistance)
Second Target: $122,500+
Third Target: $123,800–$124,000 (All-Time High)
Confirmation Needed: 4H candle close above descending trendline and $119,200 with rising volume.
📉 Bearish Rejection Scenario:
Price gets rejected from the trendline or minor resistance zone
Breaks below $117,000 minor support
Possible targets:
First Target: $116,000 (reaction zone)
Second Target: $115,000 (major support)
A fall below $115,000 could invalidate the bullish buildup and invite strong bearish continuation.
This would signal that bulls failed to reclaim control, and sellers maintain market structure dominance.
📌 Key Levels Summary:
Type Price Range Significance
🔺 All-Time High $123,800–124,000 Final upside target
🔸 Major Resistance $121,000–121,200 Key breakout level
🔹 Minor Resistance $118,800–119,200 Immediate trendline + local supply
🔹 Minor Support ~$117,000 Local demand base
🔻 Major Support $115,000 Last line of defense for bulls
🧭 Conclusion & Strategy:
Bitcoin is approaching a make-or-break zone under a significant descending trendline. Price compression is tightening, and a breakout looks imminent.
Traders should stay patient and wait for confirmation—either a breakout and successful retest for longs or a rejection and trendline defense for shorting opportunities.
Whether it’s a breakout toward $121K and ATH, or a drop toward $115K support, this setup offers a high-probability trade opportunity for both bulls and bears depending on the confirmation.

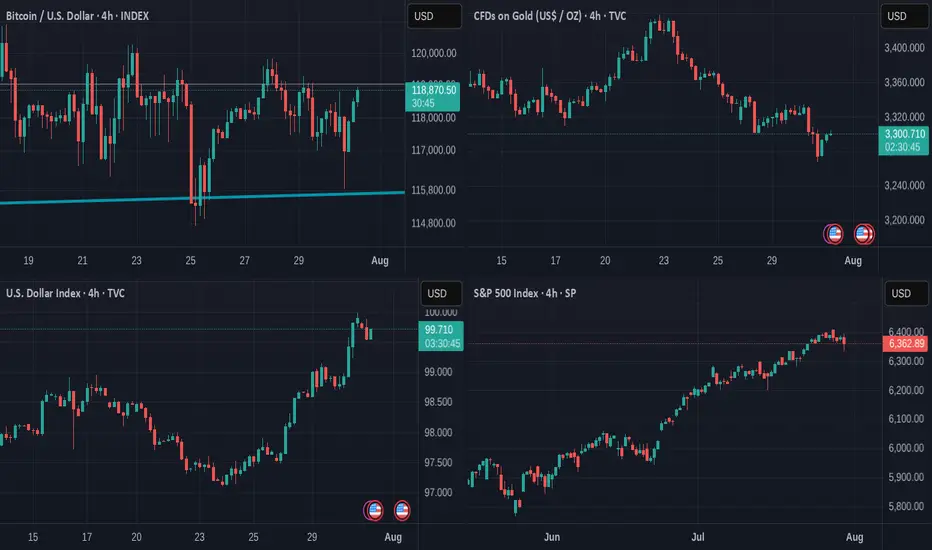
Has Bitcoin become a "SAFE" asset ? These charts show that......
After we heard the US Federal Reserve hold rates yesterday, Markets Fell some.
And Bitcoin joined them for a couple of hours but Look now.
While the $ falls, the S&P Falls, GOLD is the traditional haven of safety and we can see how it Rose in Value over the last 12 hours
The $ has Fallen over the last 8 hours
S&P Stalled for the last 24 hours
And the STRONGEST positive moves over the last 12 hours were from BITCOIN rising, though it is taking a breather for the moment.
SO, has it become a SAFE HAVEN ?
Put it like this. Bitcoin has NOT lost value like it used to when under pressure.
We have yet to see what would happen once it reaches its cycle Top. Will it retreat as it has historicaly...
But for now, it does seem to be a strong store of Value and remains with potential and likelihood of further rises.
The TOTAL CRYPTO MARKET CAP chart below
This shows us that the investor market seems Very confident in the Crypto Market,,Just going from strength to strength.
The TOTAL 2 Market Cap chart shows us something very interesting.
The TOTAL2 chart is the Total Market Cap MINUS BITCOIN
Compare the 2 charts and you will see how the TOTAL chart has risen way over its previous cycle ATH but the TOTAL2 is currently being rejected off its previous ATH line.
This clearly shows us that BITCOIN is the strength in the Crypto Market.
It is the same story on the TOTAL3 chart ( TOTAL minus BTC & ETH )
It is the same on the OTHERS chart ( Top 125 coins minus top 10 by market Cap )
BITCOIN CARRIES THE MARKET
These are early days but the Future of Bitcoin does seem VERY good
So far this cycle, the largest retrace was -31%
This drop was NOT a sharp Drop over a short period of time. It was an expected and controlled drop over 112 days.
But the zoomed out version of that chart tells us something VERY GOOD
PA has risen above and Tested and held that line of resistance that had rejected PA at Cycle Top ATH in 2017 and 2021.
That is a HUGE move and we wait to see if we Hold and move higher away from this line.
SO, Is Bitcoin a Safe Haven ?
It is certainly looking more and more like it.
PA is secure, has held position well and is in Price discovery...slowly and with caution...but always moving forward.
The traditional 4 yeat Cycle would end in late Q4 this year and so we have to wait and see what happens then.
But Bitcoin PA has moved into New ground on so many fronts now.
The traditinal BEAR market may not appear, in which case, YES, Bitcoin could become a New SAFE HAVEN
Buy Bitcoin
Hold Bitcoin
White House Crypto Report Incoming: Will BTC Pump from Support? One of the important news for Bitcoin ( BINANCE:BTCUSDT ) that was released today was that " White House confirms first Bitcoin and crypto report will be released TOMORROW ". Bitcoin is likely to rise with the release of the White House report .
What do you think? At least a temporary pump may be in store for Bitcoin.
Bitcoin fell to the Support zone($116,900-$115,730) and filled the New CME Gap( $119,500-$118,295) as I expected in the previous idea .
Bitcoin is currently moving near the Support zone($116,900-$115,730) , Cumulative Long Liquidation Leverage($116,828-$115,710) and Potential Reversal Zone(PRZ) .
I expect Bitcoin to rise from the Support zone($116,900-$115,730) to at least $118,680(First Taregt) .
Second target: Upper line of the descending channel
Note: Stop Loss: $114,680 = Worst Stop Loss(SL)
CME Gap: $115,060-$114,947
Cumulative Short Liquidation Leverage: $118,827-$118,298
Cumulative Short Liquidation Leverage: $120,144-$119,200
Please respect each other's ideas and express them politely if you agree or disagree.
Bitcoin Analyze (BTCUSDT), 1-hour time frame.
Be sure to follow the updated ideas.
Do not forget to put a Stop loss for your positions (For every position you want to open).
Please follow your strategy and updates; this is just my Idea, and I will gladly see your ideas in this post.
Please do not forget the ✅' like '✅ button 🙏😊 & Share it with your friends; thanks, and Trade safe.

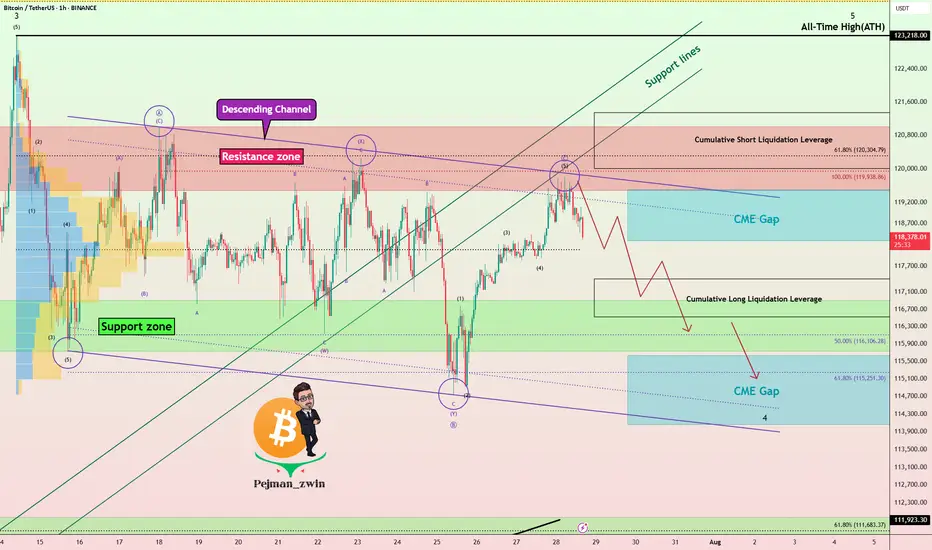
Bitcoin Rejected Near $120K – Bears Wake Up!First of all, I have to say that Bitcoin’s movements over the last 12 days have been a bit difficult to trade , generally, the hardest market to make a profit in is the range market with a swing movement .
Bitcoin( BINANCE:BTCUSDT ) is currently trading near the Resistance zone($121,000-$119,500) , Cumulative Short Liquidation Leverage($121,336-$120,000) , and the upper line of the descending channel .
Since Bitcoin has lost support lines , we can consider this increase in Bitcoin over the last two days as a pullback to the support lines(broken) . Do you agree with me!?
In terms of Elliott Wave theory , it appears that Bitcoin is still completing the main wave B. The main wave B is a Regular Flat(ABC/3-3-5) . The structure of the microwave B of the main wave B was a Double Three Correction(WXY) .
Additionally, the SPX 500 index ( SP:SPX ), which Bitcoin is correlated with , is poised for a correction in my opinion, which could also impact Bitcoin .
Also, unlike previous Mondays, MicroStrategy has NOT purchased Bitcoin , and the company currently holds 607,770 BTC .
Old Bitcoin wallets also seem to be waking up to the fact that they can create movements in the crypto market . " In recent days, 471,867.8 BTC worth $56.39 million have been transferred from old wallets from 2012 to 2017 . ".
I expect Bitcoin to decline to at least the Support zone($116,900-$115,730) and fill the CME Gaps in the coming hours .
New CME Gap: $119,500-$118,295
CME Gap: $115,060-$114,947
Cumulative Long Liquidation Leverage: $117,401-$116,615
Please respect each other's ideas and express them politely if you agree or disagree.
Bitcoin Analyze (BTCUSDT), 1-hour time frame.
Be sure to follow the updated ideas.
Do not forget to put a Stop loss for your positions (For every position you want to open).
Please follow your strategy and updates; this is just my Idea, and I will gladly see your ideas in this post.
Please do not forget the ✅' like '✅ button 🙏😊 & Share it with your friends; thanks, and Trade safe.