Bitcoin Monthly- IF in Bear, What has marked the End previously Bitcoin - What shows us we are near or on the Bottom? THIS DOES
Bitcoin Monthly Chart
50 SMA RED
100 SMA BLUE
The 50 Month SMA was tested by the End of Bear Markets in 2015 and and 2019 and marked the bottom. PA Bounced
PA fell through it when tested in 2022 and PA found support on a long term trend line.
On this chart, since the 50 Month SMA came into being, it has only been lost on 4 occasions and Only Once for longer than a month.
See Arrows on charts above
* On a Wick down in August 2015
* On a Wick down in March 2020 ( Covid)
* For an 8 Month period in the DEEP Bear market were companies like 3 Arroes, Celcious and FTX collapsed due to external pressure and stupidity
* And a small candle down in September 2023
The Dashed Red lines are showing the current 50 Month SMA price of around 57K usdt. and projected path
PA is not testing that yet as it usualy does at the end of a Bear.
As and When we get there, this may lasts no longer than a month.. but that is not a guarantee.
To me, this is simply showing us were we are in this Market.
IF this is a BEAR Market, We are NOT Near the Bottom or on the Bottom .
PA is however on that long term line of support. the November candle wicked down to it and bounced
Already in December, we have done the same.
On a weekly chart, we can see how the 50 was lost and PA is now testing the 100, just above the long term support.
This cycle, that trend line has been Very important in the early stages of recovery from the 2022 Bear
If this is just a correction, we could be near a decision point as we watch that 100 Weekly SMA and see if PA can hold above it.....->
So, IF we are in a Bear Market and not just a Correction, we may have a LONG way to go yet. Down to that 50 Month SMA.
As we have seen in the past, This Month candle can Wick down Deeply. So if you are greedy enough, or stupid enough to be using Leverage. Make sure you are ready.
Or have the Dynamics of BTC PA changed now.?
We will have to wait and See.
Bitcoinaverages

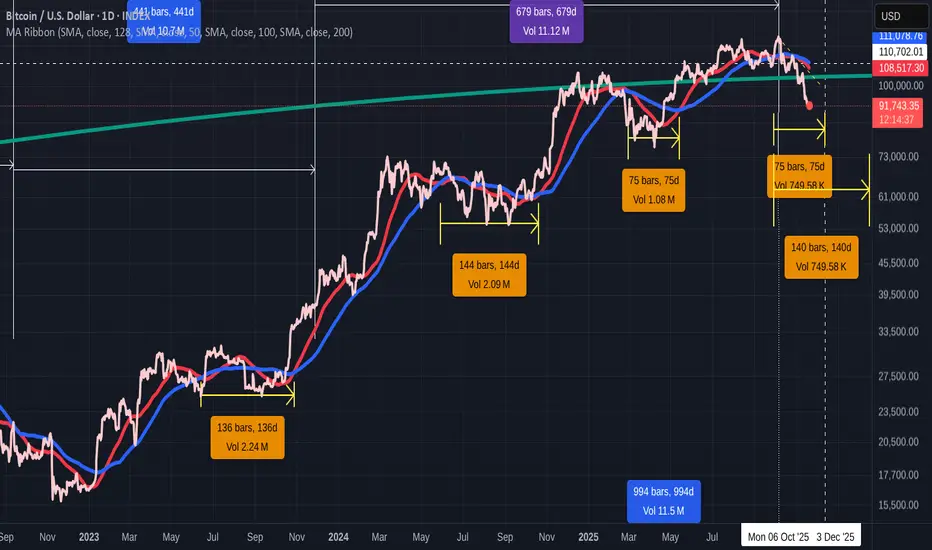
Bitcoin Daily 50 & 100 SMA day counts this cycle from crossover
This post is in conjunction with the weekly SMA I just posted.
It will predict nothing But it will give us an idea of how the "Cycle" is continuing or not, by the end of this month.
The day counts are from when the 50 SMA ( RED ) first drops below the 100 ( BLUE ) - BEARISH, to when the 50 Rises back above and remains above on the DAILY BITCOIN INDEX chart.
The First 2 occasions, since Jan 2023
2023 - 136 days
2024 - 144 days
Unusually, 2025 has 2 occasions where the 50 dropped below the 100.
The first lasted 75 Days in early 2025
And so , now, with the daily 50 having just crossed below the 100, we can maybe project forward and see when the 50 may recover back over the 100, IF the market remains Bullish
If we were to do another 75 days, we could expect the Bullish crossover at the beginning of December....which would be a similar total day count of the 50 below the 100 of the previous years this cycle ( 75 in early 2025 + 75 now )
THIS is what I think is possible as it has confluence with other charts.
If we have to wait around 140 days ( the average of the two previous longer occasions) we will be in February 2026
This Time does also have some confluence in other charts but it less strength
There is a Very Good reason Why O feel that PA HAS to climb again and that is simply that PA has fallen back below LONG TERM RESISTANCE>
As mentioned in many previous posts, that Blue Arc has rejected EVERY ATH since Bitcoin began its climb in 2011
There is also a line of resistance just below current PA position, that is squeezing PA....And it has never been crossed before.
IF PA drops much further, we WILL drop below that line of Support.
For me, THIS is what I am watching the most
Stay safe
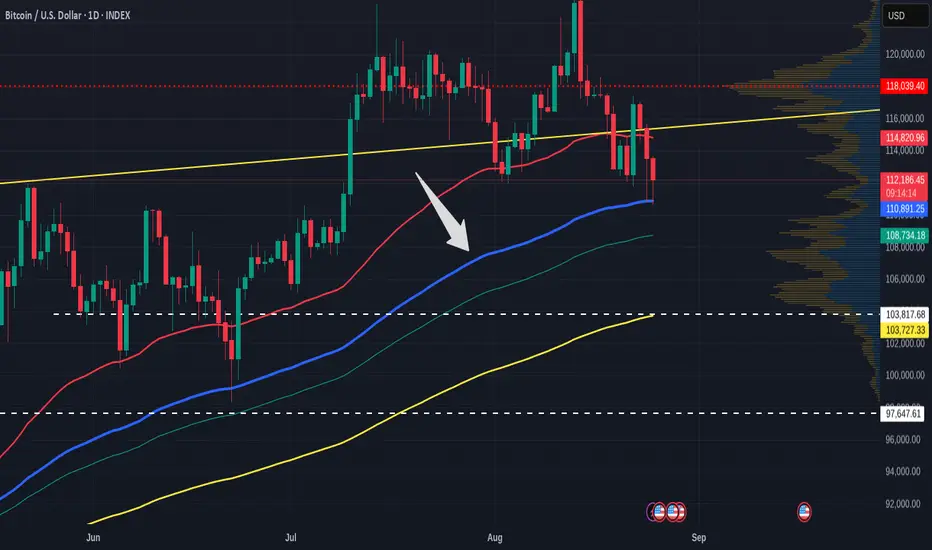
Bitcoin Daily update - will the 100SMA hold this time?
So, PA lost momentum and is falling abck to support on the 100 Daily SMA ( blue )
Last time we fell through the 100 we reached down to teh 128 Daily SMA ( green ) and found support
We need to watch closely and se if this happens again if the 100 fails
It is worth remembering that should the 128 fail, the 200 Daily SMA ( Yellow ) is down around 100K
After this, support lays around 94K

Bitcoin bouncing off the 100 Day SMA- Repeat as last time ?
The chaar says it alp
Arrow points to 100 day SMA. We gt a bounce to ATH last time......
Will we repeat ?
I doubt it but we may get back over some levels...
Time will tell