BITCOIN HIGH PROBABILITY BUY SETUPSOON!!!🚨BTC HIGH PROBABILITY BUY SETUP 🚨
* Here We Can See Clearly The Next Potential Moves For BTCUSD Coming Hours.
* Keep Your Eyes Close On Your Trading Positions.
* Happy PIP Hunting Traders.
FXKILLA.
Bitcoinbuy

Bitcoin Long OpportunityBitcoin 👀
After a clear liquidity sweep, price reacted with a bullish expansion, showing that early buyers have stepped in with conviction.
My primary focus is on the buy-side liquidity resting below.
I anticipate a liquidity grab into that area and will look to execute from the M15 unfilled imbalance beneath current price.
On the HTF, we have a strong DOL, supported by an unfilled H1 SIBI, which remains a key objective. 🎯
Also, we have a OTE level of a previous range that aligns with our entry POI - unfilled M15 FVG.
I will consider taking partial profits into the H1 SIBI zone 💰
📉

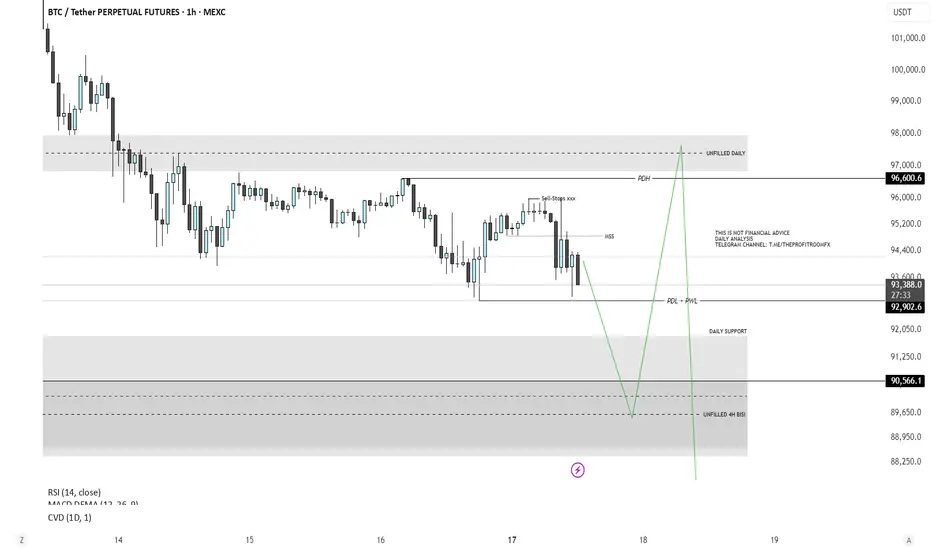
Bitcoin Analysis - Short & LongPrice is anticipated to sweep the previous day’s low (PDL) and previous week’s low (PWL), while also mitigating the unfilled H4 imbalance.
This aligns with a potential retest of the daily FVG support zone before initiating a move to the upside.
There is a clear draw on liquidity toward the buy-side, with both the previous day’s high (PDH) and an unfilled daily FVG serving as objective targets.
After filling this daily FVG imbalance, price is expected to continue delivering lower to address remaining inefficiencies on the sell-side, specifically around the 87,000 level, where another unfilled daily FVG is present.
Bitcoin LONG OpportunityBitcoin Potential Long
Recently, we observed a liquidity sweep targeting key swing points, including the Previous Day’s Low (PDL), which represents sell-side liquidity within the previously established range.
Going forward, I anticipate that price may continue to draw toward liquidity levels below the current range , specifically the Previous Week’s Low (PWL) and an unfilled imbalance within the Monthly Fair Value Gap (FVG).
Should price reach this zone, I will be closely monitoring market structure and lower-timeframe price action for signs of a potential reversal or long setup from that area towards Buyside Liquidity.

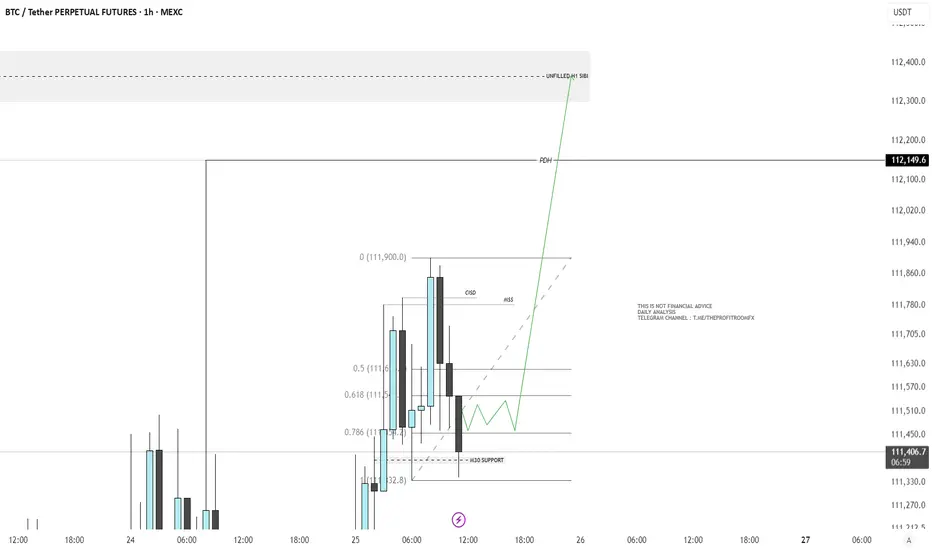
Bitcoin Weekend AnalysisIf the current H1 candle closes within the range of the previous candle, we may anticipate a potential movement toward the buy-side.
There is a notable draw on liquidity, with the Previous Daily High (PDH) and an unfilled H1 SIBI (Sell-Side Imbalance, Buy-Side Inefficiency) serving as key areas of interest.
Recently, we’ve also observed a Market Structure Shift (MSS) alongside a Change in Short-Term Direction (CISD)on the H1 timeframe.
In addition, price has shown multiple rejections from a support level formed by a M30 Fair Value Gap (FVG), reinforcing this area as a short-term accumulation zone.
Based on this structure, I expect price to accumulate between the 0.786 and 0.618 Fibonacci retracement levels, before redistributing toward our Draw On Liquidity (DOL).
Overall, my bias remains bearish, anticipating a sell opportunity after the SIBI imbalance has been filled and the PDH liquidity has been swept.
Bitcoin AMD for London Session - LONG We are currently observing a typical Accumulation-Manipulation-Distribution (AMD) entry model to support a bullish bias for Bitcoin in the upcoming hours (London Session).
At present, price action appears to be in an accumulation phase. We anticipate a potential liquidity sweep of a key swing low , specifically, the previous day’s low (PDL), which aligns with a Point of Interest (POI): an unmitigated H1 order block.
Sell-side liquidity from the previously established dealing range has already been swept, indicating that a manipulation phase may be underway.
Based on this structure, we can reasonably expect a price movement toward the 0.618 Fibonacci retracement level of the prior range.

Bitcoin BTC Analysis - PM NY Session
Bullish Bitcoin Analysis – PM Session 💰🐂
Recent price action on the 1-hour timeframe (H1) has shown weak candle closures, indicating a failure to achieve significant displacement.
However, we observed a recent sweep of the previous daily high (PDH), followed by a strong close above that level.
This move led to a market structure shift (MSS), suggesting a potential transition to a bullish trend.
With this bullish bias in mind, I have identified a key Fibonacci range that aligns with several confluences supporting the bullish outlook.
Notably, there remains an unfilled bullish imbalance (BISI) on the H1 chart, in addition to a nearby H1 order block.
Furthermore, the optimal trade entry (OTE) level aligns closely with the 0.618 Fibonacci retracement, further strengthening the case for a long position. - 109 000 is the level we’re looking at 👀

Bitcoin (BTC) - Bullish Reversal ScenarioCurrently anticipating a potential bullish reversal in Bitcoin (BTC) following a sweep of key liquidity levels, specifically the previous week’s low (PWL) and the previous day’s low (PDL). This liquidity grab appears to have been followed by a strong rejection at the PWL level, indicating a possible shift in market sentiment toward the upside. 📈
Before this reversal unfolds, I expect price to first target and sweep the previous day’s high (PDH), which would provide the necessary momentum to tap into deeper liquidity levels and confirm directional intent. 📉
Furthermore, I’m anticipating price to retest a significant H4 BISI, which adds confluence to the bullish outlook.
On the buyside, there is a well defined engineered liquidity pool characterized by relatively equal highs and the previous week’s high (PWH), offering a clear draw for price. 💰
Overall, these factors suggest a high probability setup for a bullish continuation, contingent on the successful sweep of PDH and sustained support at the H4 imbalance zone.

Bitcoin Daily - getting ready for a move higher ?
As I mentioned last time, that Red disgonal "line" is actually a large 236 Fib circle and, as usual, it has proved to be a line of resistance, pulling PA down, to reset and allow for moves higher.
Is the "Dip" over ?
Impossible to say but PA is certainly getting into a position to make moves higher.
The Daily MACD
Now below Neutral but note how th eHistogram is showing a White bar..A weakening of the Bearish move. But do understand, this alone is not reliable, as it can turn Red again.
The Daily RSI
This could offer some hope as we see that RSI is in an area were it has bounced previously
But, again, n Guarantees.
The 4 Hour PA chart
This shows us more detail on how PA has just gone Flat...waiting.
Early next week, we get the start of anew Month.
To be able to maintain the Bullish run over the previous months, we need a GREEN month cndle from BTC..
It is currently an inverse Green Hammer candle.
We may stay were we ar enow and Dro further at the start of October.
DON'T PANIC

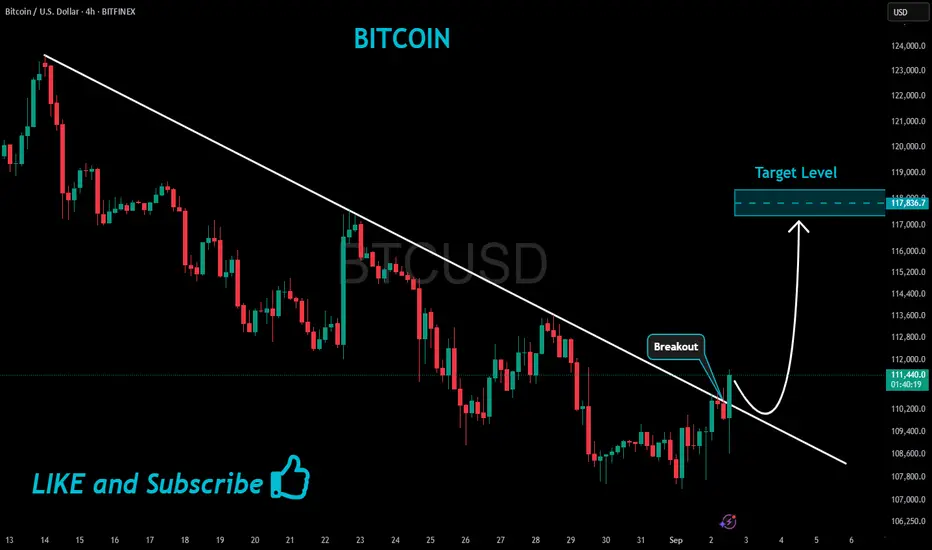
BITCOIN Bullish Breakout!
HI,Traders !
#BITCOIN made a bullish
Breakout of the falling resistance
And the breakout is confirmed
So we are bullish biased
And we will be expecting
A further bullish move up !
Comment and subscribe to help us grow !
Bitcoin - Looking To Buy Pullbacks In The Short TermM15 - Strong bullish move.
No opposite signs.
Currently it looks like a pullback is happening.
Expecting further continuation higher until the two Fibonacci support zones hold.
If you enjoy this idea, don’t forget to LIKE 👍, FOLLOW ✅, SHARE 🙌, and COMMENT ✍! Drop your thoughts and charts below to keep the discussion going. Your support helps keep this content free and reach more people! 🚀
--------------------------------------------------------------------------------------------------------------------

Bitcoin priming itself for a cup of upside to 146,942!MAJOR Cup and Handle is forming on the one and only Bitcoin.
TOp institutions are paying 100s of millions of dollars into the crypto with the idea that it's going to rocket to $200,000.
But baby steps, because the chart is definitely showing upside to come. First it will have to break through the brim level first before we even get a STRONG buy.
Price> 20 and 200MA
Target 146,942
Disclosure: I am part of Trade Nation's Influencer program and receive a monthly fee for using their TradingView charts in my analysis.

Bitcoin is nearing a critical breakout zone at $86,000Bitcoin is nearing a critical breakout zone at $86,000.
If this level breaks with strong momentum, we could see a rapid bullish continuation toward the major resistance area around $105,000. The ascending channel remains intact, and aggressive buying near support points to a strong upside setup.
From a fundamental view, Bitcoin is gaining strength as global uncertainty rises. The latest escalation of trade tariffs has disrupted traditional markets, pushing more investors toward alternative assets like Bitcoin. Historically, Bitcoin has performed strongly during times of economic instability.
Tightening monetary policies worldwide are fueling recession fears, making Bitcoin even more attractive as a hedge — the new "digital gold." With institutional interest growing, Bitcoin is well-positioned for a significant capital inflow.
Stay ready — the next big move is close! 🚀

Bitcoin Breaks Trendline-Is $109k Next?Technical Analysis: Ascending Channel Pattern
The asset is exhibiting an ascending channel pattern, indicative of sustained bullish momentum. Key observations include:
- Channel Boundaries: The price has consistently respected the channel's upper and lower boundaries, forming higher highs and higher lows.
- Breakout and Retest: Following a strong momentum breakout, the price is potentially retesting a key support level, previously acting as resistance.
- Support Zone: If buyers confirm support at this level, it may signal a continuation of the uptrend, targeting the upper boundary of the channel at $109,000.
Key Monitoring Points:
- Bullish Confirmation Signals: Look for bullish engulfing candles, strong wicks rejecting the support zone, or increased buying volume to confirm long positions.
- Risk Management: Failure to hold support could signal a bearish shift, emphasizing the importance of monitoring price action and adjusting strategies accordingly.

Bitcoin has broken above the $86,000 zone, just as we anticipateBitcoin has broken above the $86,000 zone, just as we anticipated.
🔹 On-Chain Insights:
• Long-Term Holders: Mild distribution — profit-taking phase
• Network Activity: Steady — strong and healthy
• Sentiment: Bullish — weak USD and rising institutional inflows
🔹 Macro Overview:
• U.S.–China tensions and Fed uncertainty boost Bitcoin’s safe-haven appeal
• Institutions are steadily increasing exposure — a strong positive signal
Stay tuned with megvipofficial for more accurate updates and premium crypto signals!

Bitcoin 4h in Consodilation / BullishBitcoin is in consolidation since last couple of days. Once channel will be broken upside, we can buy Bitcoin with target
Target 1 : 86000
Target 2 : 87000
Target 3 : 88000
Target 4 : 89000

Thu 10th Apr 2025 BTC/USD Daily Forex Chart Buy SetupGood morning fellow traders. On my Daily Forex charts using the High Probability & Divergence trading methods from my books, I have identified a new trade setup this morning. As usual, you can read my notes on the chart for my thoughts on this setup. The trade being a BTC/USD Buy. Enjoy the day all. Cheers. Jim

BITCOIN Trending Higher - Can Bulls Maintain Momentum?COINBASE:BTCUSD is trading within a well-defined ascending channel, with price action consistently respecting both the upper and lower boundaries. The recent bullish momentum indicates that buyers are in control, suggesting a potential continuation toward higher levels.
The price has broken above a key resistance zone and successfully retested it as support, confirming the bullish structure. This retest strengthens the case for further upside, with the next target aligning with the upper boundary of the channel near $91,000.
As long as the price remains above this newly established support, the bullish outlook stays intact. However, if the price fails to hold above this zone, a deeper pullback toward the midline or the lower boundary of the channel could come into play.
Remember, always confirm your setups and trade with solid risk management.
Best of luck!

Tue 18th Mar 2025 BTC/USD Daily Forex Chart Buy SetupGood morning fellow traders. On my Daily Forex charts using the High Probability & Divergence trading methods from my books, I have identified a new trade setup this morning. As usual, you can read my notes on the chart for my thoughts on this setup. The trade being a BTC/USD Buy. Enjoy the day all. Cheers. Jim

BTC → Bitcoin Retrace to $69,500? Or Bounce to $150,000?The short version, the probability that Bitcoin tests the breakout price around $69,500 is very high. That's simply the nature of breakouts; bulls take profits (sell orders) until the previous high is reached, at which point the bulls start buying again, and the bears take their profits (buy orders), driving the market up for another leg.
The question is, what is our next move as traders? Or even Bitcoin investors?
How do we trade this? 🤔
Let's zoom out to the Monthly chart. Bitcoin is resting on the 9EMA, a support area we've closed above it since September of 2023. Our current context is we've broken out of the 2021 cycle high of $69,500 and reached a new high just shy of $110,000. It's clear we're in pullback mode right now, so far-reaching down to $78,000.
Fundamentally, there aren't many catalysts for bullish activity. Bulls are simply taking profit at the first 6-figure Bitcoin price, which is both a psychological and technical price for selling. Monetary policy is still in a state of qualitative tightening, inflation has been slowly rising since September 2024, from 2.4% to 3%. Not a dramatic move, which certainly isn't helping Bitcoin move to the upside. Bitcoin seems to respond more to monetary policy than inflation rates and while the rates have steadily climbed, it's not enough to shock the market, while monetary policy has largely stayed the same.
Technical analysis shows TOTAL, TOTAL2, and TOTAL3 crypto market cap charts all were rejected at key resistance areas in early December. Bitcoin broke the 2021 right shoulder around $46,000 to $73,000, then had a measured move up to $109,000, about a 55% move each, give or take. We're simply in a state where we've reached a key resistance level after a breakout while the market as a whole is in a state of uncertainty. I believe that uncertainty will lead to a capitulation down to the high $ 60,000s, even if it's a quick wick. This would likely lead to a $1,500 ETH, $1.50 XRP, it may look ugly. But take a look at past cycles; a 30-40% pullback for Bitcoin is just another Thursday in the crypto market. The alts can pull back as much as 50%-60%.
I think we wait for the buy signal. Look for a pullback to the breakout area at $69,500, and wait for the market to tell us that we found the buy zone with a strong candle close on or near its high on the Daily chart, likely somewhere around $75,000. Then I believe $150,000 is the area for this cycle high based on the Lifetime Resistance and measured move target. The measured move shows a 57% move up after the breakout; if we take that 57% move up and stack it on the mid-price of the current trading range at $91,000, that takes us to right around $150,000. Anything beyond that is a bonus. I think from there, it makes a second attempt to breach the high, followed by our 12-18 month bear market as shown in the chart.
💡 Trade Idea 💡
Long Entry: $75,000
🟥 Stop Loss: $55,000
✅ Take Profit #1: $105,000
✅ Take Profit #2: $135,000
⚖️ Risk/Reward Ratio: 1:3
🔑 Key Takeaways 🔑
1. Breakout above 2021 Cycle High $69,500
2. Psychological and technical high of $100,000 reached
3. Pullback phase has been in motion since December, breakout zone is the buy target
4. Wait for a two-legged pullback toward the Monthly 30EMA (breakout zone), look for strong buy signal, large bull candle closing on or near its high.
5. RSI is near 64.00 and below the Moving Average. Wait for contact and a drop toward 60.00 in concurrence with the price action to enter.
💰 Trading Tip 💰
It's reasonable to take half profits at the first resistance target in a long trade, or the first support target in a short trade. Using a 1:1 Risk/Reward Ratio for your first target, you can move your stop loss up to your entry price, locking in profits. This allows you to watch the rest of the trade execute without worry of losing money. This helps improve trading psychology and the equity in your account.
⚠️ Risk Warning! ⚠️
Past performance is not necessarily indicative of future results. You are solely responsible for your trades. Trade at your own risk!
Like 👍 and Follow to learn more about:
1. Reading Price Action
2. Chart Analysis
3. Trade Management
4. Trading Psychology

LONG ON BITCOINIts Timeeeee.....
Bitcoin has tapped into a major demand zone and has given us a change of character/structure to the upside.
It has pulled back to discount price all day today and is now ready to head back up to 100k.
I am purchasing bitcoin now at 83k expecting it to get back to 100k buy the end of the week. BITSTAMP:BTCUSD

Mon 3rd Mar 2025 BTC/USD Daily Forex Chart Buy SetupGood morning fellow traders. On my Daily Forex charts using the High Probability & Divergence trading methods from my books, I have identified a new trade setup this morning. As usual, you can read my notes on the chart for my thoughts on this setup. The trade being a BTC/USD Buy. Enjoy the day all. Cheers. Jim

Bitcoin, No matter what going below $90,000Hello Guys, Wish you a Very Happy Valentines Week.
a Quick update on Bitcoin, i do not see any upward positive rally for next few weeks , my direction and target for the same is below $90,000.. a setup with entry stoploss and target is placed in the charts.
good luck and good trading :)
