BCH - LONG IDEAMy long-term review: It's a profitable trade that continues to this day.
(RU version) -
Now may be a good time for those who don't want to wait months to enter.
We have a beautiful 4H FVG long position, so let's see how it reacts. If it consolidates, we enter. If it falls below the lows, we ignore the idea.
It's very simple. The nearest target is $700+.
BINANCE:BCHUSDT.P
Bitcoincash

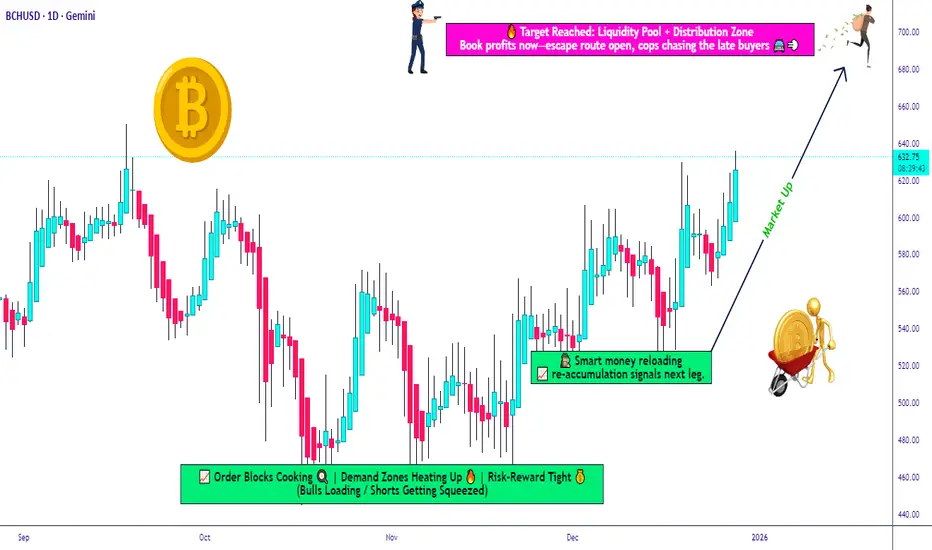
Bitcoin Cash Aligns With Broader Crypto Upside Momentum🚨 BCH/USD CRYPTO PROFIT PATHWAY SETUP 🎯 | Bitcoin Cash Bull Trap Escape Strategy
💰 ASSET: BCH/USD (Bitcoin Cash vs U.S. Dollar)
Market: CRYPTO | Strategy Type: SWING TRADE | Plan: 📈 BULLISH
📊 CURRENT MARKET DATA (Real-Time Verified)
Current Price: $614.41 USD
24H Volume: $365.33M USD
Market Cap Rank: #11
24H Change: +1.49%
YTD Performance: +35% (Strong Bullish Momentum)
🎯 "THIEF STRATEGY" - LAYERED ENTRY SYSTEM
💎 Entry Zones (Layer Your Positions):
The "Thief Strategy" uses multiple limit orders to scale into positions strategically:
Layer 1: Entry @ $560 (20% of position)
Layer 2: Entry @ $580 (25% of position)
Layer 3: Entry @ $600 (30% of position)
Layer 4: Entry @ $610 (25% of position)
💡 Alternative: Market entry at ANY PRICE LEVEL for aggressive traders (current: ~$614)
⚠️ Note for Thief OG's: You can adjust layers and increase entry points based on your own risk tolerance and capital allocation strategy.
🛑 STOP LOSS MANAGEMENT
Thief's SL: @ $550
⚡ CRITICAL REMINDER - Dear Ladies & Gentlemen (Thief OG's):
This is MY stop loss based on MY strategy
Adjust YOUR stop loss according to YOUR risk management rules
Consider your position sizing and portfolio allocation
This is NOT a recommendation—it's reference data
YOUR money = YOUR decisions = YOUR risk
🎖️ TARGET: POLICE FORCE RESISTANCE ZONE
Primary Target: @ $690 🚀
📈 Why $690?
✅ POLICE FORCE acts as strong resistance + oversold bounce zone
✅ Historical correlation support at this level
✅ Accumulation zone before potential breakout
✅ Smart money trap escape point
⚠️ CRITICAL REMINDER - Dear Ladies & Gentlemen (Thief OG's):
This is MY take profit target based on MY analysis
Set YOUR targets according to YOUR trading plan
Scale out at multiple levels if preferred
Take profits when YOU are comfortable
NOT a recommendation—trade at YOUR own risk
🔗 CORRELATED PAIRS TO WATCH
Monitor these pairs for market correlation and confirmation signals:
Primary Correlations:
BTC/USD - Current: $87,900.93 | BCH follows Bitcoin's macro direction
ETH/USD - Current: $2,936.87 | Layer-1 competition indicator
BCH/BTC - Direct correlation ratio tracking
Key Correlation Points:
BCH hashrate above 7.71 EH/s (above 2017 peak) = Network strength confirmation
Bitcoin correlation shows BCH experiencing 61,561% liquidation imbalance, suggesting price decoupling potential
Watch Bitcoin dominance levels—currently at 59.5%
🔥 FUNDAMENTAL & ECONOMIC FACTORS (Latest Updates)
✅ Recent Bullish Catalysts:
1. Major Technology Upgrades (2025):
NEAR Integration (Dec 23, 2025) - Cross-chain swaps with 120+ assets across 25+ chains
Cashinals Launch (Dec 18, 2025) - BCH-20 token standard debuts, expanding NFT ecosystem
May 2025: VM Limits & BigInt Support activated - enabling Ethereum-like smart contracts
2. Network Strength Indicators:
Hashrate at 7.71 EH/s, surpassing 2017 peak
Circulating supply: 19,972,656 BCH (approaching 21M max supply)
Over 2,550 merchants now accepting BCH
3. Institutional & Whale Activity:
Whale Activity Peaks (Dec 24, 2025) - Record transaction sizes signal accumulation
$482M moved by large holders in July 2025
Grayscale's rumored BCH ETF filing
4. Technical Price Action:
Confirmed double bottom pattern near $300 region
BCH testing critical $600 zone for breakout to $800-$1,000
Strong buy signal on technical indicators
📅 Upcoming Events to Monitor:
2026: Quantum-resistant cryptography development
2026: Enhanced VM Limits & BigInt CHIPs for DeFi integration
Ongoing: Cross-chain liquidity expansion via NEAR Protocol
⚡ KEY RESISTANCE & SUPPORT LEVELS
Immediate Resistance:
R1: $620-$630 (Current test zone)
R2: $650 (Breakthrough target)
R3: $680-$690 (Major resistance—TARGET)
R4: $800-$1,000 (Extended targets)
Support Levels:
S1: $580-$600 (Strong buyer accumulation)
S2: $560 (Layer entry zone)
S3: $520-$560 (Pullback cushion)
S4: $445-$450 (50W-EMA support)
📊 PRICE PREDICTIONS & ANALYST CONSENSUS
2025 Outlook:
Bullish scenario: BCH could reach $701 with increased hype
Bearish scenario: Support around $450-$507
Year-end target: Potential $799
Medium-Term (2026-2027):
2026 maximum: $1,160
Bullish targets: $1,200-$1,597 by end 2025/early 2026
Potential retest of $4,300 ATH if smart money accumulates
🎯 TRADING STRATEGY SUMMARY
Setup Type: Swing Trade (Multi-day to Multi-week hold)
Risk Level: Medium-High (Crypto volatility)
R:R Ratio: Approximately 1:2.5 (depending on entry)
Timeframe: Daily/4H chart focus
Strategy: Layered entry + correlation monitoring + fundamental backing
📱 FOLLOW FOR MORE SETUPS
If this analysis helps YOUR trading journey, smash that 👍 and follow for more Profit Pathway Setups!
Drop a 🔥 if you're entering this trade!
Thief Strategy Squad: Make money, manage risk, escape the trap! 🏃♂️💨
BITCOIN CASH Analysis (4H)From the point marked with the green arrow on the chart, Bitcoin Cash has formed a bullish diametric pattern. At this stage, wave E of the diametric appears to be completed, and price has entered wave F.
We have identified two entry zones on the chart, where positions should be built using a DCA strategy.
The targets for wave G have been clearly marked on the chart.
A daily candle close below the invalidation level will invalidate this scenario.
For risk management, please don't forget stop loss and capital management
When we reach the first target, save some profit and then change the stop to entry
Comment if you have any questions
Thank You

BCH Buy/Long Signal (4H)The structure of Bitcoin Cash is bullish and it continues to form higher highs and higher lows.
Each bullish wave in this fractal moves more than 1 percent and the previous lows are not taken. We expect the same behavior this time as well with the price rising at least 19 percent.
Therefore buy or long positions can be considered at the support levels of the previous wave.
The targets are marked on the chart.
Do not enter the position without capital management and stop setting
Comment if you have any questions
thank you

BCH: $700–$800 Before the Next Bear MarketBCH Macro Resistance Before Bear Market
Based on historical price structure, Bitcoin Cash (BCH) appears to be approaching a macro resistance zone around $700–$800 , which has previously marked the final upside before major bear markets.
In 2018 and 2022, BCH followed a very similar pattern:
A prolonged accumulation phase
A strong push into a horizontal resistance zone
A rejection from that zone, followed by a deep bear market decline
The current structure closely mirrors those past cycles. Price is once again testing the same historical supply zone, where sellers previously stepped in aggressively.
Key idea:
I expect BCH to reach the $700–$800 range
This level could act as the last distribution zone before the broader market transitions into a new bear market phase
This is not a short-term trade idea, but a macro perspective based on repeating market behavior and long-term resistance reactions.
⚠️ As always, confirmation is needed, and this scenario is invalidated i f price accepts and holds above the resistance zone.

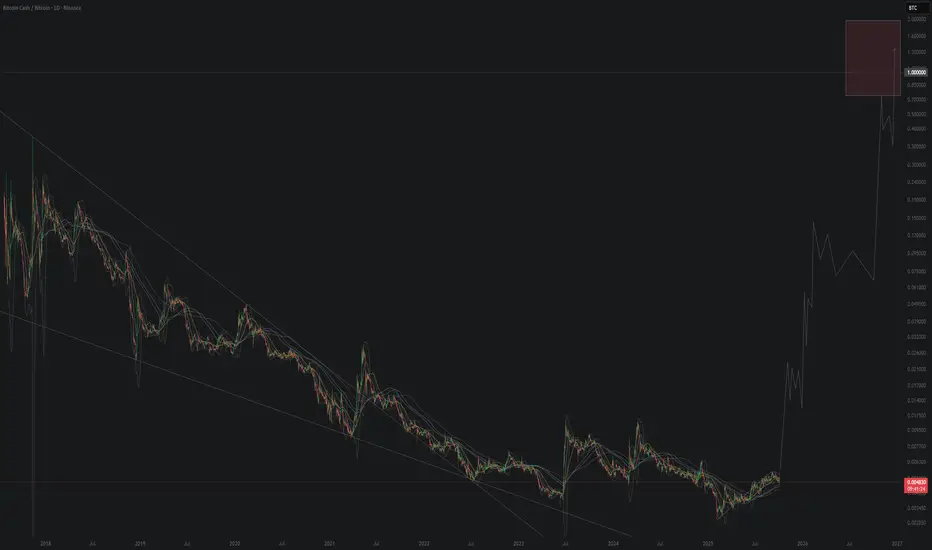
8 Years Break ? Bitcoin Cash $BCH ! 1. The Resistance Line (The "Bear" Trend)
The descending trendline (top line) connects the major peaks:
Point 1 (Dec 2017): The All-Time High / Cycle Top.
Point 2 (2021): The mid-cycle peak.
Points 3 & 4 (2024-2025): Recent lower highs where sellers stepped in.
Significance: Every time the price touched this line previously, it was rejected forcefully. This created a sequence of Lower Highs, indicating selling pressure.
2. The Support Line (The "Bull" Trend)
The ascending trendline (bottom line) connects the major lows:
2018 Lows: The bear market bottom.
2022/2023 Lows: The accumulation phase post-FTX crash.
Significance: The market established a sequence of Higher Lows, indicating that buyers are stepping in at increasingly higher prices over the long term.
The Breakout Zone: Point 5
Point 5 represents the apex of this multi-year compression.
The Breakout: The chart indicates that BCH has pierced the long-term descending resistance line (around the $450-$500 zone).
Current Price Action ($566.28): The current price is trading above the breakout trendline. This is technically a bullish confirmation. The price action immediately following Point 5 looks like a "backtest" or "consolidation," where the previous resistance is being tested as new support.
Projections and Targets
The chart features a large upward arrow projecting a parabolic move. Here are the technical targets based on this structure:
Intermediate Resistance: The first major hurdles are likely the previous swing highs around $700, followed by the 2021 highs around $1,600.
The "Measured Move" (Macro Target): The horizontal dotted line at the top of the chart sits at $4,338.94.
This target likely corresponds to a retest of the 2017 All-Time Highs.
In T.A., the target of a triangle breakout is often calculated by measuring the height of the back of the triangle (2017-2019 range) and projecting it from the breakout point. This calculation aligns with the arrow pointing toward the $3,000 - $4,500 region.
This is a classic "volatility compression" play. The chart suggests that the long "crypto winter" for BCH is ending. The break of the 8-year downtrend line is the most significant technical event on this chart.

Bitcoin Cash (BCH) Preparing for a Breakout MoveBCH is currently trading inside a rising wedge structure, where price keeps creating higher lows while struggling to clear the upper resistance. This pattern often appears before a decisive expansion in volatility, either as a continuation or as a reversal depending on how the breakout occurs.
Recent price action shows rejection at the upper boundary, followed by a pullback into a fib cluster between 0.382 and 0.786. This zone acts as a short term decision point, where the next directional move is likely to originate.
The market structure remains constructive as long as BCH holds above the rising wedge support. A controlled retracement into the grey demand block keeps the bullish case intact, while a deeper breakdown would shift momentum in favour of sellers.
Key Technical Notes:
• Rising wedge structure guiding current trend
• Clear fib retracement confluence inside the demand block
• Higher lows indicate buyers are still defending structure
• Breakout above the wedge can trigger an impulsive move
• Breakdown from wedge support opens a larger correction
Bullish Scenario:
A bounce from the fib cluster and a breakout above the wedge resistance can open a rapid expansion toward the 720 region. Momentum would accelerate if buyers reclaim the mid channel levels with strength.
Bearish Scenario:
Losing wedge support flips the entire structure short. In that case, BCH may slide toward 446 where major liquidity sits.
In simple terms:
BCH is compressing inside a rising wedge. A breakout means continuation toward 720, while a breakdown exposes 446. Watch the fib cluster for confirmation of direction.
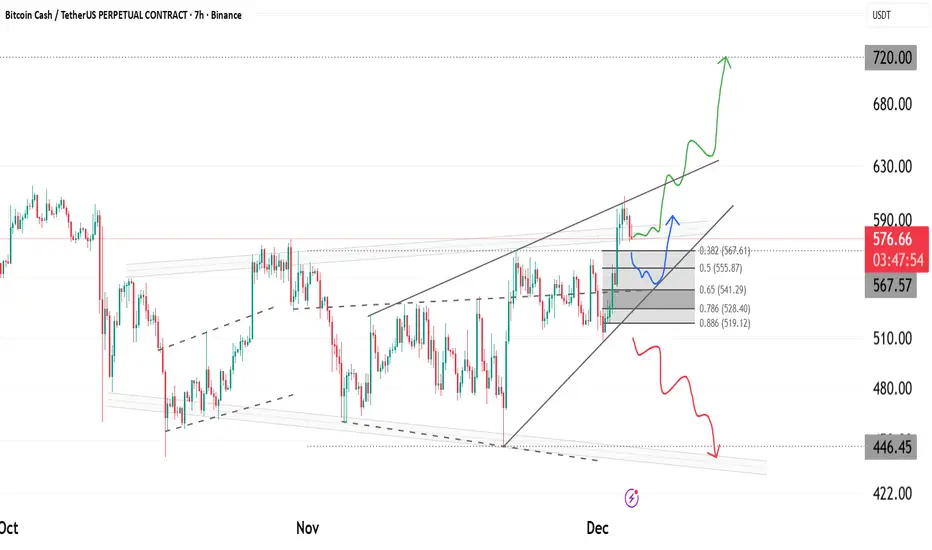
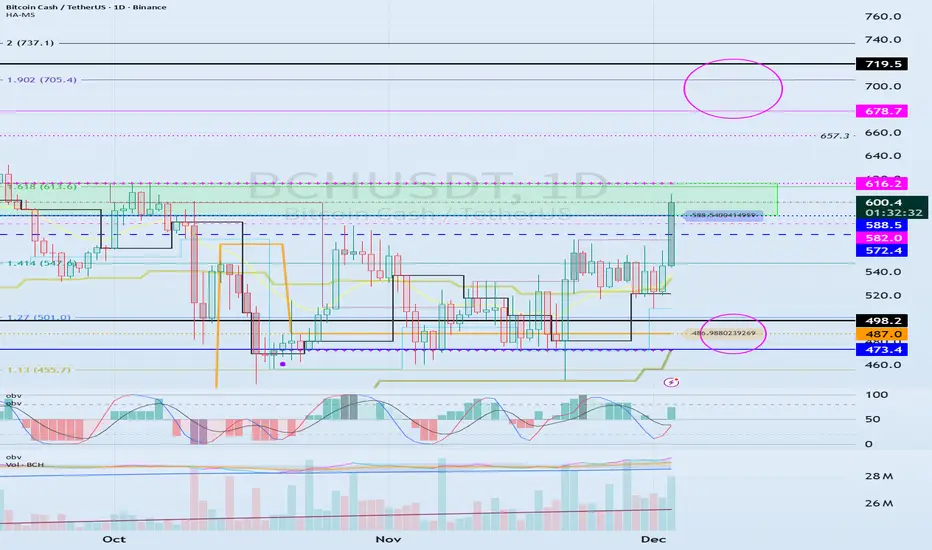
The key is whether it can break above 588.5-616.2
Hello, traders!
Follow us to get the latest information quickly.
Have a great day.
-------------------------------------
(BCHUSDT 1D chart)
The 1D chart is rising towards the HA-High ~ DOM (60) range, raising expectations for a bullish trend.
Accordingly, the key question is whether the 588.5-616.2 range can be supported and the price can rise.
If it rises, we should examine whether it can break above the 678.7-719.5 range, which is the range formed by the DOM (60) indicator on the 1M chart and the previous high.
To continue the uptrend by breaking above key points or ranges, the StochRSI, TC, and OBV indicators must show upward trends.
If possible,
- The StochRSI indicator should not have entered an overbought zone.
- The TC indicator should remain above zero.
- The OBV indicator should remain above the High Line.
Therefore, we should examine the movements of the StochRSI, TC, and OBV indicators when the price rises above the DOM (60) indicator.
If the StochRSI falls below 80, it's considered a stop loss, as further declines are likely.
-
Thank you for reading.
We wish you successful trading.
--------------------------------------------------
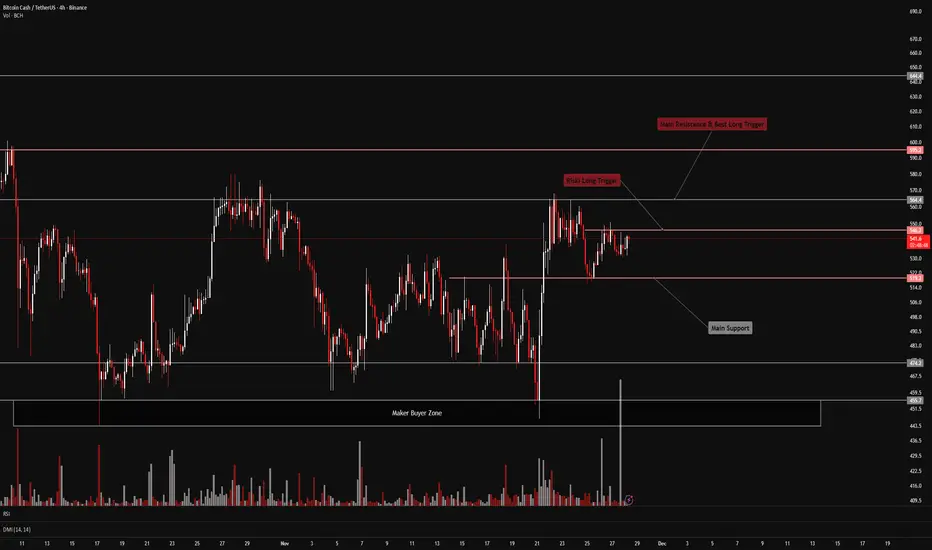
FireHoseReel | BCH: Ready to Shock the Market ?🔥 Welcome To FireHoseReel !
Let's dive into the BCH ( BitcoinCash ) 4H analysis .
👀 Bitcoin Cash (BCH) – Market Structure Overview
After reacting strongly from the major buyer zone, Bitcoin Cash pushed higher and attacked the $564 resistance directly.
Price then faced rejection at this level and entered a multi-timeframe corrective phase. During this correction, sell volume declined, and in the most recent 4-hour candles, buy volume has increased noticeably.
BCH has now formed an early long trigger around $546.
If this level breaks with multi-timeframe confirmation, we can look for early long positions, anticipating a future breakout above $564.
📊 Volume Is the Key Signal
Pay close attention to BCH volume — volume is more important than price here.
Right now, after price reached the $546 resistance zone, we’re seeing a strong surge in buy volume that hasn’t appeared for several days.
This behavior can be an early signal of a trend shift and the potential start of another bullish rally.
✔️ BCH/BTC Additional Market Perspective Looking at the BCH/BTC pair, price has moved upward very smoothly and is currently in a corrective phase.
The support and resistance levels that generate entry triggers are clearly defined — and these levels align perfectly with the BCH/USDT pair.
Early trigger: 0.005961
Safer trigger: 0.0062
These levels can be used for multi-pair confirmation.
📌 Trading Scenarios for Bitcoin Cash
You can review the following scenarios alongside your own strategy:
🟢 Long Scenario
A breakout above the $546 high, supported by rising buy volume, can offer a solid early long setup.
This setup is mainly for front-running the main breakout with lower initial risk.
If BCH later breaks and confirms above the stronger resistance at $564, we can safely add more size to existing long positions.
🔴 Short Scenario
Since the BCH/BTC pair is currently in a strong bullish structure, I do not expect a deep correction for Bitcoin Cash at this stage.
Therefore, short setups are not preferred in the current market context.
🛞 Risk Management & Disclaimer
Please remember to always use proper risk management and position sizing. Nothing in this analysis is financial advice. The market can change quickly, so always trade based on your own strategy, research, and risk tolerance. You are fully responsible for your own trades.
#BCHBTC #1W (Binance) Big falling wedge breakoutCRYPTOCAP:BCH just regained 50MA weekly support in sats, performing better than CRYPTOCAP:BTC
Seems likely to continue bullish towards 200MA resistance, probably after a pull-back.
⚡️⚡️ #BCH/BTC ⚡️⚡️
Exchanges: Binance
Signal Type: Regular (Long)
Amount: 7.0%
Current Price:
0.004885
Entry Targets:
1) 0.004657
Take-Profit Targets:
1) 0.006329
Stop Targets:
1) 0.003987
Published By: @Zblaba
CRYPTOCAP:BCH BINANCE:BCHBTC #BitcoinCash #PoW bitcoincash.org
Risk/Reward= 1:2.5
Expected Profit= +35.9%
Possible Loss= -14.4%
Estimated Gaintime= 4-7 months

BCH BITCOINCASH 1D - 1W TFWe can clearly see a large triangle formation along with a well-defined channel, which together outline the structure the price is likely to follow in the near future.
Based on this setup, the price is expected to move toward the highlighted targets as long as it respects the channel and continues developing within this broader triangle pattern.
There is also a possibility that the price may drop to the bottom of the channel — the blue zone — before moving upward.
This would still remain within the overall market structure and would not invalidate the bullish scenario as long as the channel holds.

BCHUSD - Resistance Broken This long term resistance line has been approached and broken through by price
I think a bigger break out is coming if this is a true break of this trend line
In my opinion a very undervalued crypto right now
Daily timeframe

BCH Poised for taking out all time highsOverlaid Zcash right before pump with BCH weekly. Eerily similar pattern. BCH already brokeout of historical consolidation just waiting for pump.
Market cap #13 slowly approaching Top 10 where it belongs even without pump.
21M supply limit just like Zcash and btc. Deflationary currency.

Bitcoin (BTC/USD) - Bullish Breakout Alert : Targeting $130k ?🚀 Bitcoin (BTC/USD) - Bullish Breakout Alert: Targeting $130K+ in October 2025! 🚀
Hello Traders! In today's chart, I’ve analyzed Bitcoin’s recent movements. As of October 8, 2025, BTC is trading above $123,500, showing an 8.6% surge last week. Following September’s 5.35% gain, the market is in a bullish mood, aligning with the historical "Pumptober" trend.
What to Watch on the Chart:
Double Bottom Pattern: Two troughs formed near $113,000, signaling a bullish reversal. The neckline resistance at $117,300 has been broken, with the next target at $122,000-$125,000.
Symmetrical Triangle Breakout: A breakout from a two-month descending channel has occurred, indicating a sharp upside move, potentially up to $138,000.
Moving Averages: Both the 50-day MA ($118K) and 200-day MA ($115K) are rising, providing strong support. RSI at 65 is in the bullish zone but not overbought.
Volume Trend: ETF inflows ($175M+ last month) and increasing institutional buying volume suggest sustainability, potentially pushing BTC to $130K-$135K.
Prediction: If $124K holds, the target by the end of October is $131,500 (6-8% upside). Worst case, support at $118K-$120K may be tested. Long-term: $150K+ is possible in 2025 due to ETF and halving effects.
Risk: A US government shutdown or macro volatility could lead to a 5-10% dip. Always DYOR and use stop-loss!
Share your thoughts in the comments – bullish or cautious? Like & share if helpful! 📈 #Bitcoin #BTC #CryptoAnalysis #TradingView

BCH: Weak Volume Signals Pullback Risk FenzoFx—Bitcoin Cash is trending upward after tapping $606.80 buy-side liquidity in early October. Despite higher highs, the cumulative volume profile shows lower lows, signaling weak buying interest.
The first manipulation occurred after exiting the accumulation zone (purple box), but price held above its mean threshold. A dip below $580.10 is expected to sweep liquidity. If BCH rebounds with a bullish engulfing pattern, the next target is $650.90.
However, if price closes and stabilizes below $580.10, the bullish outlook is invalidated, and BCH may drop toward equal lows at $533.40.

BCHUSD - An Altcoin ChoiceAn expanding wedge allows for price extension so high, this will be the last move for this wedge.
It is a massive move but im not sure what is soon to come for alts.
I'm bullish on BCH for its real world applicability.
Weekly chart

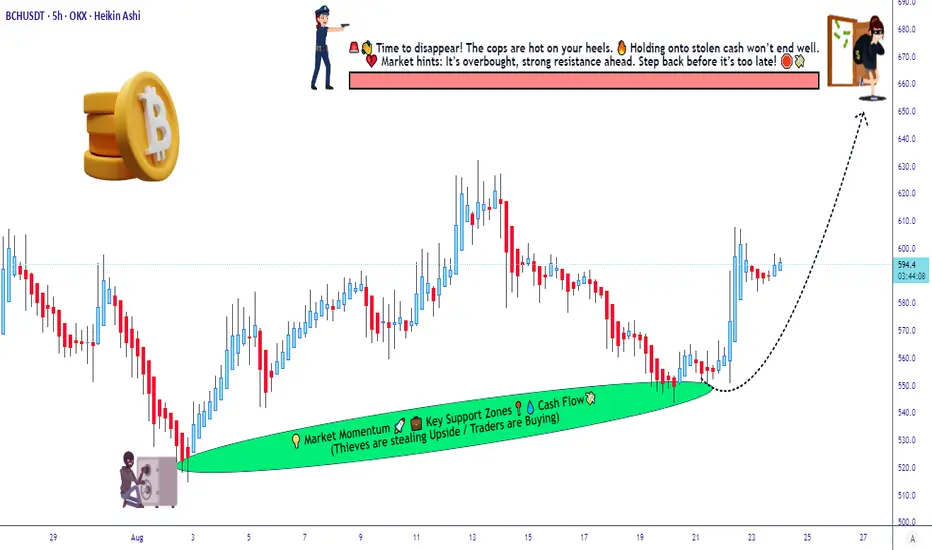
Ready To Loot With This BCH Bullish Strategy? 🏴☠️ BCH/USDT HEIST BLUEPRINT - BULLISH LOOT IN PROGRESS! 🏴☠️
Attention all Thief Crew Members! 👋 Ladies & Gentleman of the Robbery Elite! 🎩🤵♀️
The vault for BINANCE:BCHUSDT is WIDE OPEN! 🔓 Time to execute our master plan and fill our bags! 💰🤑
📜 THE MASTER HEIST PLAN (BULLISH) 📜
🎯 TITLE: LAYERED LIMIT ORDER ASSAULT!
📍 ASSET: Bitcoin Cash vs Tether (BCH/USDT)
⏰ TIMEFRAME: Day / Swing Trade Heist
📈 BIAS: BULLISH LOOTING! 🐂
🚪 ENTRY: THE LAYERED APPROACH (THIEF STYLE) 🚪
This is a MULTI-LAYER LIMIT ORDER HEIST! We are not entering all at once. We are sneaky thieves! 🐱👤
Place your BUY LIMIT ORDERS at these precise levels to average your entry like a true OG:
LAYER 1: 600.0 👉 Swipe the first bag!
LAYER 2: 590.0 👉 Double the loot!
LAYER 3: 580.0 👉 Loading up...
LAYER 4: 570.0 👉 Max capacity! 💼
(You can increase your layers based on your capital, you clever thief!)
🛑 STOP LOSS: THE ESCAPE ROPE 🛑
This is the Thief's Official SL: 540.0
Dear Crew, adjust your escape plan based on YOUR risk appetite and how many layers you used! Protect your capital! 🧨⚠️
🎯 TARGET: THE GREAT ESCAPE 🎯
The POLICE BARRICADE is forming at 670.0! 🚔🚧
WE ESCAPE WITH THE STOLEN MONEY AT: 660.0 🏃♂️💨
DO NOT GET GREEDY! Exit before the cops arrive! Take the profit and treat yourself to something nice! You've earned it! 🍾🥂
⚡ SCALPERS' NOTE: ⚡
Scalping Crew! 👀 Only quick, sharp long scalps allowed on this heist. If you're rich, go all in. If not, stick with the swing crew and execute the layered plan! Use a trailing stop to protect your mini-loot! 🔪
📝 Why This Heist? 🤔
💹 Bullish Vibes: BCH/USDT showing strong upward momentum on the charts. 📈
🔍 Do Your Homework: Check fundamentals, COT reports, on-chain data, and sentiment analysis for the full picture. 🧩
⚠️ Stay Woke: Markets move fast—keep up with real-time data and adjust your plan! ⏰
⚠️THIEF'S DISCLAIMER:⚠️
This is not financial advice! This is a robbery plan! 🎭 Manage your own risk, do your own research, and only steal... I mean, trade... with what you can afford to lose! The markets can be a trap! 🕳️
💖 SUPPORT THE CREW! 💖
SMASH THAT LIKE & BOOST BUTTON! 👉 💚🔔
It fuels our next heist and strengthens our robbery team! Let's make stealing money look easy! 🚀🤝
I'll see you at the target, crew! Stay tuned for the next heist! 🤑✨
#THIEFTRADER #BCH #USDT #CRYPTO #HEIST #LAYEREDENTRY #BULLISH #SWINGTRADE
Bitcoin cashBcH usdt daily analysis
Time frame daily
Risk rewards ratio >2.3 👈👌
Target 920$
Double bottoms pattern created

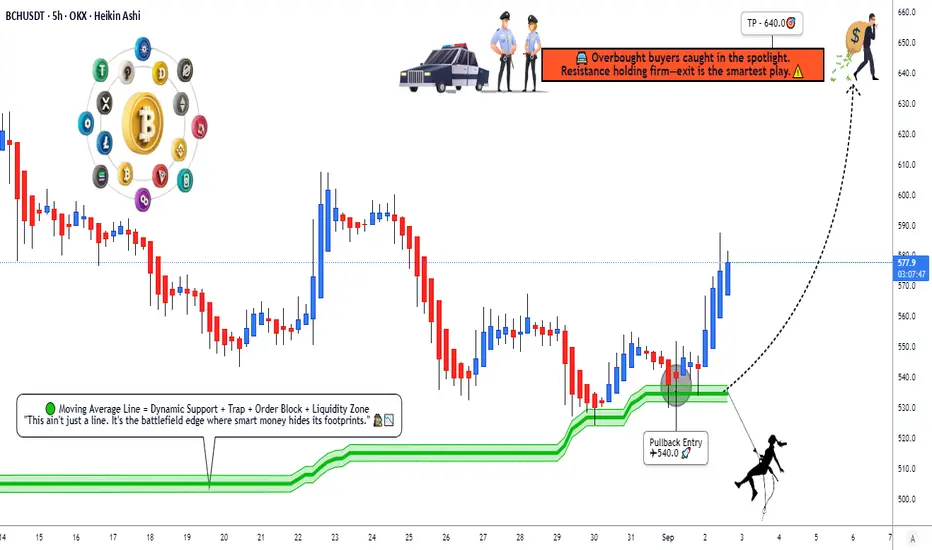
BCH/USDT: Is The Fear Overdone? Bullish Heist Plan Inside.🚀 BCH/USDT: Bullish Pullback Heist - Layered Entry Loot (Swing/Day) 💰
📍 Quick Take:
Bitcoin Cash is pulling back into a key demand zone, offering a prime bullish entry. This plan uses a strategic layered entry to capitalize on the dip, targeting a rally toward $640.
📊 Latest Market Pulse (As of Sept 02, 2025)
Price: $577 USDT | 24h Change: +2.8% 📈
Sentiment: Neutral (Fear & Greed Index: 46) ⚖️
Retail Mood: 55% Bullish 😎📱
Institutional Mood: 60% Bullish 💼🔒
Volume: $442M | Key Support: $540
⚔️ The "Money Looting" Trade Plan
🎯 Direction: Bullish (Pullback Play)
🔑 Entry Method: The Layered Heist
Deploy multiple limit orders to average your entry like a pro. The current price is perfectly poised for this strategy!
Layer 1: 570.0 USDT
Layer 2: 560.0 USDT
Layer 3: 550.0 USDT (CURRENT PRICE ZONE)
Layer 4: 540.0 USDT (STRONG SUPPORT)
➡️ Adjust layers based on your risk appetite.
🛡️ Stop Loss (The Getaway Car):
A break below 520.0 USDT invalidates the setup. This is my level—all Thief OGs should adjust their SL based on their own strategy and risk tolerance! Never risk more than 1-2% of your capital.
🎯 Profit Targets (The Escape Route):
The first major barricade is at 650.0. Let's aim to escape with the stolen goods at 640.0! Consider taking partial profits on the way up.
📈 Why This Setup? Fundamental & Macro Backdrop
Fundamental Score: 7/10 🏗️ - Strong network upgrades, growing adoption, and low fees provide a solid foundation. The recent Velma hard fork boosts DeFi potential.
Macro Score: 6/10 🌍 - Mixed but favorable. Expected Fed rate cuts could boost risk assets like crypto, though global trade tensions remain a headwind.
Sentiment Shift: The bounce from $540 support shows resilience. With institutional accumulation up 22% and open interest rising, the fear present now often precedes a 10-15% rally.
Overall Outlook: Bullish (Mild Edge) 🐂
Probability of reaching $640 by late September is strong, supported by technicals, fundamentals, and shifting market sentiment.
👀 Related Pairs
Watch These: BINANCE:BTCUSDT , BINANCE:ETHUSDT , BINANCE:XRPUSDT , BINANCE:SOLUSDT
✨ “If you find value in my analysis, a 👍 and 🚀 boost is much appreciated — it helps me share more setups with the community!”
#BCH #BitcoinCash #SwingTrading #Scalping #Crypto #TradingSetup #LayeredEntry #BULLISH #USDT #TradingView #MarketReport #FearAndGreed
The Bitcoin Cash/Bitcoin bull runBitcoin Cash/Bitcoin began its bull run in February 2025
Long entry: 4800 sats
Take profit: between 0.70 / 1.90 btc
This is my personal opinion and this is not a financial advice! Good trading!
The Bitcoin Cash bull runBitcoin Cash began its bull run in June of 2023, we are currently only 20% of the way through the bull run.
I think the bull run will end around the end of 2026.
Long entry: 590 USD
Take profit: between 0,4 million and 2,4 million USD
In my opinion there is a high probability that it will reach between 1 and 2.5 million, 1.2 million could be a likely target.
This is my personal opinion and this is not a financial advice! Good trading!

Bitcoin Cash BCH price analysisMore than 3 months have passed since the publication of the previous idea for #BCH, and the price itself has shown an increase of +40%
◆ Slowly but surely growing
◆ Does not react to the price fall CRYPTOCAP:BTC (for those who don't know, #BCH is the first CRYPTOCAP:BTC fork and probably the only one that survived. Then there were 8-10 more of them in 2017-2018... but hey...)
◆ It has been moving in its own direction for more than a year, when OKX:BCHUSDT is cheaper than $300, it is actively bought back by someone.
We have slightly revised the growth target for #BitcoinCash, but why not consider this asset as a long-term investment from $350-400 to $900 and $1250
_____________________
Did you like our analysis? Leave a comment, like, and follow to get more

TradeCityPro | BCH Holding Support as Bulls Defend Momentum👋 Welcome to TradeCity Pro!
In this analysis, I want to review the BCH coin for you. One of the old and well-known American coins that, with a market cap of $11.33 billion, ranks 16th on CoinMarketCap.
📅 Daily Timeframe
On the daily timeframe, this coin has an upward trendline and has made a slow upward move with a slight slope up to the top of 618.4.
⚡️ Currently, this trendline has been broken and the price has reacted to the 530.9 zone. The break of this zone gives us confirmation of the trendline break and the price can move towards lower levels.
🔍 But the FRVP indicator shows a larger support zone from 491.9 to 530.9, and to have FRVP confirmation, we need to consider this.
💥 At the same time, as the price fell, volume dropped significantly, and it seems that market participants are more interested in the upward trend, because volume was increasing in the bullish leg and decreasing in the corrective leg.
🔔 The RSI oscillator was also on a support zone at 43.49, which was supported, and as long as RSI is above this level, the main market momentum will remain bullish.
🧩 So for now, I think it’s better not to open short positions because the price is on an important level and volume also diverges with shorts.
📈 But for a long position or even buying in spot, breaking 618.4 is a suitable trigger, and with its break, we can enter a position.
📊 If the 491.9 area is broken, the next support zones we have are 406.1 and 349.2.
📝 Final Thoughts
Stay calm, trade wisely, and let's capture the market's best opportunities!
This analysis reflects our opinions and is not financial advice.
Share your thoughts in the comments, and don’t forget to share this analysis with your friends! ❤️
