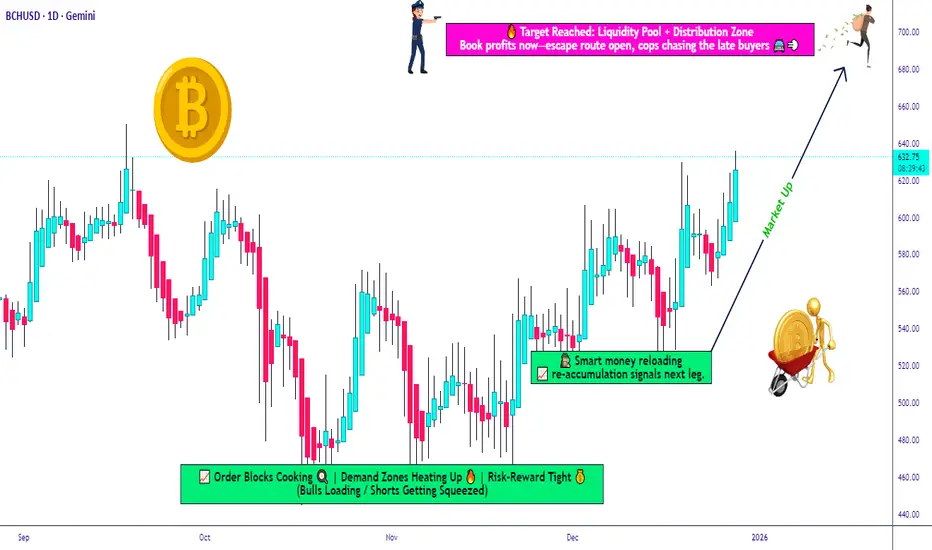
Bitcoin Cash Aligns With Broader Crypto Upside Momentum🚨 BCH/USD CRYPTO PROFIT PATHWAY SETUP 🎯 | Bitcoin Cash Bull Trap Escape Strategy
💰 ASSET: BCH/USD (Bitcoin Cash vs U.S. Dollar)
Market: CRYPTO | Strategy Type: SWING TRADE | Plan: 📈 BULLISH
📊 CURRENT MARKET DATA (Real-Time Verified)
Current Price: $614.41 USD
24H Volume: $365.33M USD
Market Cap Rank: #11
24H Change: +1.49%
YTD Performance: +35% (Strong Bullish Momentum)
🎯 "THIEF STRATEGY" - LAYERED ENTRY SYSTEM
💎 Entry Zones (Layer Your Positions):
The "Thief Strategy" uses multiple limit orders to scale into positions strategically:
Layer 1: Entry @ $560 (20% of position)
Layer 2: Entry @ $580 (25% of position)
Layer 3: Entry @ $600 (30% of position)
Layer 4: Entry @ $610 (25% of position)
💡 Alternative: Market entry at ANY PRICE LEVEL for aggressive traders (current: ~$614)
⚠️ Note for Thief OG's: You can adjust layers and increase entry points based on your own risk tolerance and capital allocation strategy.
🛑 STOP LOSS MANAGEMENT
Thief's SL: @ $550
⚡ CRITICAL REMINDER - Dear Ladies & Gentlemen (Thief OG's):
This is MY stop loss based on MY strategy
Adjust YOUR stop loss according to YOUR risk management rules
Consider your position sizing and portfolio allocation
This is NOT a recommendation—it's reference data
YOUR money = YOUR decisions = YOUR risk
🎖️ TARGET: POLICE FORCE RESISTANCE ZONE
Primary Target: @ $690 🚀
📈 Why $690?
✅ POLICE FORCE acts as strong resistance + oversold bounce zone
✅ Historical correlation support at this level
✅ Accumulation zone before potential breakout
✅ Smart money trap escape point
⚠️ CRITICAL REMINDER - Dear Ladies & Gentlemen (Thief OG's):
This is MY take profit target based on MY analysis
Set YOUR targets according to YOUR trading plan
Scale out at multiple levels if preferred
Take profits when YOU are comfortable
NOT a recommendation—trade at YOUR own risk
🔗 CORRELATED PAIRS TO WATCH
Monitor these pairs for market correlation and confirmation signals:
Primary Correlations:
BTC/USD - Current: $87,900.93 | BCH follows Bitcoin's macro direction
ETH/USD - Current: $2,936.87 | Layer-1 competition indicator
BCH/BTC - Direct correlation ratio tracking
Key Correlation Points:
BCH hashrate above 7.71 EH/s (above 2017 peak) = Network strength confirmation
Bitcoin correlation shows BCH experiencing 61,561% liquidation imbalance, suggesting price decoupling potential
Watch Bitcoin dominance levels—currently at 59.5%
🔥 FUNDAMENTAL & ECONOMIC FACTORS (Latest Updates)
✅ Recent Bullish Catalysts:
1. Major Technology Upgrades (2025):
NEAR Integration (Dec 23, 2025) - Cross-chain swaps with 120+ assets across 25+ chains
Cashinals Launch (Dec 18, 2025) - BCH-20 token standard debuts, expanding NFT ecosystem
May 2025: VM Limits & BigInt Support activated - enabling Ethereum-like smart contracts
2. Network Strength Indicators:
Hashrate at 7.71 EH/s, surpassing 2017 peak
Circulating supply: 19,972,656 BCH (approaching 21M max supply)
Over 2,550 merchants now accepting BCH
3. Institutional & Whale Activity:
Whale Activity Peaks (Dec 24, 2025) - Record transaction sizes signal accumulation
$482M moved by large holders in July 2025
Grayscale's rumored BCH ETF filing
4. Technical Price Action:
Confirmed double bottom pattern near $300 region
BCH testing critical $600 zone for breakout to $800-$1,000
Strong buy signal on technical indicators
📅 Upcoming Events to Monitor:
2026: Quantum-resistant cryptography development
2026: Enhanced VM Limits & BigInt CHIPs for DeFi integration
Ongoing: Cross-chain liquidity expansion via NEAR Protocol
⚡ KEY RESISTANCE & SUPPORT LEVELS
Immediate Resistance:
R1: $620-$630 (Current test zone)
R2: $650 (Breakthrough target)
R3: $680-$690 (Major resistance—TARGET)
R4: $800-$1,000 (Extended targets)
Support Levels:
S1: $580-$600 (Strong buyer accumulation)
S2: $560 (Layer entry zone)
S3: $520-$560 (Pullback cushion)
S4: $445-$450 (50W-EMA support)
📊 PRICE PREDICTIONS & ANALYST CONSENSUS
2025 Outlook:
Bullish scenario: BCH could reach $701 with increased hype
Bearish scenario: Support around $450-$507
Year-end target: Potential $799
Medium-Term (2026-2027):
2026 maximum: $1,160
Bullish targets: $1,200-$1,597 by end 2025/early 2026
Potential retest of $4,300 ATH if smart money accumulates
🎯 TRADING STRATEGY SUMMARY
Setup Type: Swing Trade (Multi-day to Multi-week hold)
Risk Level: Medium-High (Crypto volatility)
R:R Ratio: Approximately 1:2.5 (depending on entry)
Timeframe: Daily/4H chart focus
Strategy: Layered entry + correlation monitoring + fundamental backing
📱 FOLLOW FOR MORE SETUPS
If this analysis helps YOUR trading journey, smash that 👍 and follow for more Profit Pathway Setups!
Drop a 🔥 if you're entering this trade!
Thief Strategy Squad: Make money, manage risk, escape the trap! 🏃♂️💨
Bitcoincashbtc
BCH BitcoinCash Bullish longBitcoin Cash (BCH) soars in value thanks to surge in crypto trading volume in South Korea
Bitcoin Cash (BCH) has seen a significant surge in value, crossing the $300 mark, fuelled by rising crypto trading volumes in South Korea.
The BCH/KRW exchange pair listed on Upbit, one of South Korea’s largest digital asset exchanges, saw a trading volume of $557.63 million in the last 24 hours.
This volume is nearly 3.5 times greater than the BTC/KRW pair on Upbit and 5.5 times greater than the BCH/USD volume on Coinbase, a Nasdaq-listed exchange.
However
the recent BCH rally may be driven by speculative motivations rather than underlying fundamentals.
Strategy Bullish
3Lots
2 Lots will be excecuted at Profit Target Zones
1Lot will follow the Trend
It will be only!!! excecuted ,if Bullish Trend changes
The stops will be delivered as soon as possible to break even,better some pips above the Buyinh price
I have marked my profit targets
Psychology:
1:The price is always right
2The Market is alwas right
3 The Chart is always right
4 IGNORE THE NEWS; Plan your trades and trade your plan.
5Drawdowns are partof the game
6 Risk management and money mangement is King!
7 wHATEVER HAPPENS;sTICK TO YOUR PLAN!
8 In a bear market no price is weak enough
9 In a bull market no price is strong enough
10 Patience !Wait for confirmation: Control emotions and tensions.

Bitcoin Cash - The Lost Dinosaur I have recently been paying attention to bitcoin cash and in particular, the oldest chart I can find with all the data from previous bull runs etc. As shown, the weekly chart is showing a potential Elliot Wave structure with wave 1 being complete and wave 2 either complete or very close to being complete. IF this is a 2-wave structure within a broader 5 waves then wave 3 is next, which is the fastest, most aggressive wave of all the waves in the Elliot Wave theory. From a fib time span, bitcoin cash should start going up this week and into November.


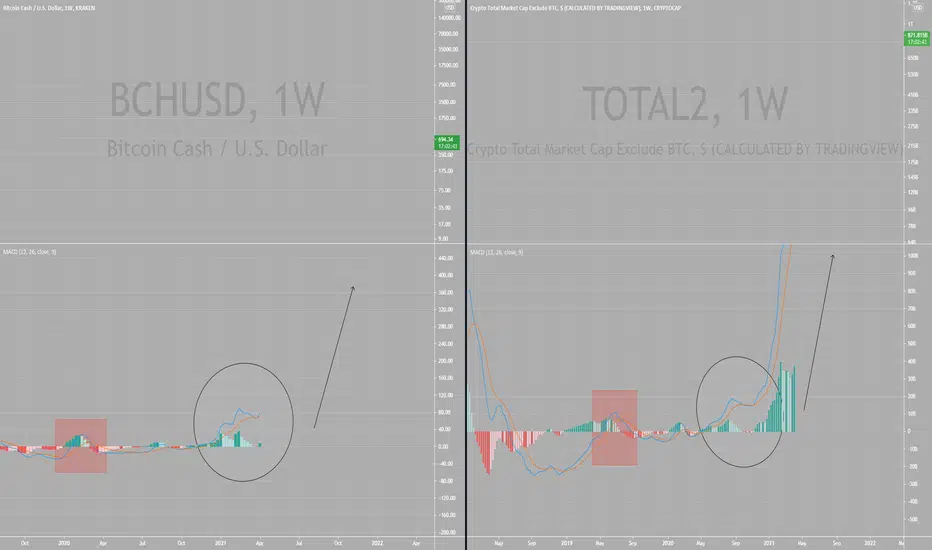
Bitcoin Cash Powerful MACD SetupI have seen this MACD setup around the board
It tends to get bullishly rejected after a small retest at the curve top
An example is TOTAL2, you can see the results on the MACD
I added BCH based on this formation, and previous assumptions

BCH In the MiddleLooking for a breakout above the first resistance into the large channel up
BCH in my opinion has more of a real world use case than BTC
Using triangles to create mosaic
I am long BCH

BCH completed Butterfly move for almost 400% big moveHi dear friends, hope you are well, and welcome to the new update on Bitcoin Cash.
On the long-term monthly chart, the price action of the BCH with Bitcoin pair has completed the last leg of the bullish Butterfly pattern and entered the potential reversal zone. The 1.618 Fibonacci retracement level goes in the negative zone and it is not possible for the priceline to enter the negative territory, sofar the priceline has found good support at 0.01052 btc , therefore I have set the buying range from 1.27 Fib level to 0.01052 btc , however, if in the near future there will be some changes, like the priceline finds any new support then I will be keep sharing with you.
There is also a very good downtrend line support as well.
This trade has a huge profit possibility of 399%, and the high loss possibility upto 9%.
Note: Above idea is for educational purpose only. It is advised to diversify and strictly follow the stop loss, and don't get stuck with trade.

Ahead of the Curve - InformativeThis is an informative post rather than an analysis.
Hopefully someone extracts some value from it.
I believe in staying ahead of the curve, in doing this, we don't need to make fast moves. Being patient often pays.
For example Bitcoin Cash, has a goal at the end of its Roadmap "mankind scale" which includes 50 transactions a day for 10 billion people.
Positioning ourselves for these events in the roadmap, can provide a new way at looking at scaling and in my mind 'payment options'
We are starting to see the adoption of Bitcoin ATM's and Bitcoin payments within stores. "the obvious option is "buy bitcoin??!" which I feel a lot of people stick to.
However is this ahead of the curve?
In the grand scheme of things it most likely is, but are there better options?
Bitcoin Cash for example, a fork of Bitcoin, is processing more payments than Bitcoin in Africa, coupled with an underdeveloped and youthful TA situation. Gives large prospect for growth. The 'mankind scale' creates a thought provoking assumption. That the majority of the world will be using cryptocurrency. (im not an expert at population inflation rates)
In my opinion Ethereum is the clear winner in diversifying and revolutionizing the way we view currency. With the introduction of DeFi. And my portfolio reflects this decision.
Thankyou for reading my thoughts.
Remember its not just Bitcoin.
Bixley

Bitcoin Cash: In-depth Breakout Analysis 1D (Jul. 26)X Force Global Analysis:
Bitcoin cash (BCH) has been showing signs of reversals through a descending wedge on a downtrend. In this analysis, we take a look at Bitcoin Cash's technical evidence to assess its bullish probabilities.
Analysis
- To begin with, we can notice extremely extended bullish divergences on the daily, as prices form lower lows and indicators form higher lows
- The Relative Strength Index (RSI) shows a steady increase over time, demonstrating increasing trend strength
- The Moving Average Convergence Divergence (MACD) also forms higher lows and higher highs as a sign of momentum
- The Stochastic indicator also contributes to the bullish divergence formation on the daily, adding weight to a bullish case
- Counting Elliott Waves within the descending bullish wedge, we can count Elliott triangle waves (ABCDE) leading to a breakout
- The Exponential Moving Average Ribbons are converging, looking to form a potential golden cross
- We have managed to close above the 0.5 Fibonacci retracement resistance, providing confirmation of a breakout
- Bitcoin cash has also managed to close above the Ichimoku cloud resistance for the first time in many weeks, signaling a potential long term trend reversal
What We Believe
We believe that the outlook on BCH is extremely bullish based on a plethora of technicals that point to the same direction. This could potentially be the beginning of a long term trend reversal.
Trade Safe.

BCH/BTC 1D Jul. 25Suggested Entry: 25215
Target 1: 26650
Target 2: 27800
Target 3: 28840
Stop Loss: 24250
The reason why Bitcoin Cash (BCH or BCHABC) is bullish despite having a similar setup to XRP is for two main reasons:
- Technical indicators support a stronger evidence for bullish momentum
- While confirmation is yet to be provided, it could be argued that BCH has broken out of the descending wedge pattern
As a descending wedge pattern in a downtrend is typically identified as a bullish reversal pattern, we suggest a long position with targets leading up to previous historical resistance levels, and a tight stop loss below significant support.
Trade safe.

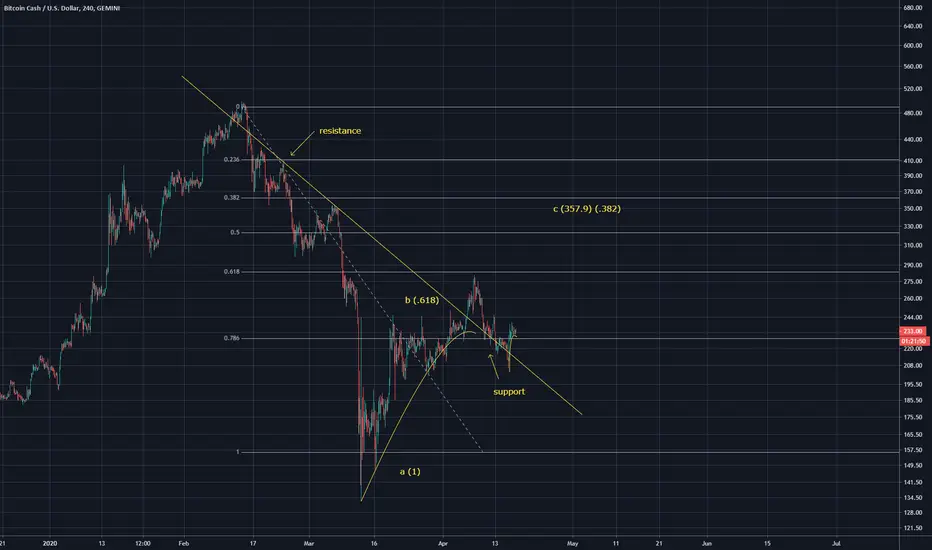
Bitcoin cash bullish breakBCH bullish break
Resistance turned support
Looks good
C represents a bulish wave from the ascending scallop breakdown that occurred and formed the new support
Bitcoin Cash Is Forming Bullish BAT For Upto 24% Profit SoonFormation of harmonic bullish BAT pattern:
The Bitcoin Cash with Bitcoin pair is forming a harmonic bullish BAT pattern and soon it will be entered in potential reversal zone to give chance to earn more gains.
Let’s dig the pattern deeper to see how perfect it has been formed.
After initial leg (X to A) the A to B leg is retraced between 0.382 to 0.50 Fibonacci and then B to C leg is projected between 0.328 to 0.886 Fib of A to B Fibonacci projection area now the last leg (C to D) should be retraced between 0.786 to 0.886 Fibonacci level.
Buying And Sell Targets:
The buying and sell targets according to harmonic BAT pattern and its Fibonacci sequence should be:
Buy between: 0.0296 to 0.0286
Sell between: 0.0320 to 0.0356
So this short term 12 hour chart based idea has capacity to produce upto 24% profit.
Stop Loss:
The potential reversal zone area that is up to 0.028646 sats can be used as stop loss in case of complete candle stick opens and closes below this level.
Note: This idea is education purpose only and not intended to be investment advise, please seek a duly licensed professional and do you own research before any investment.

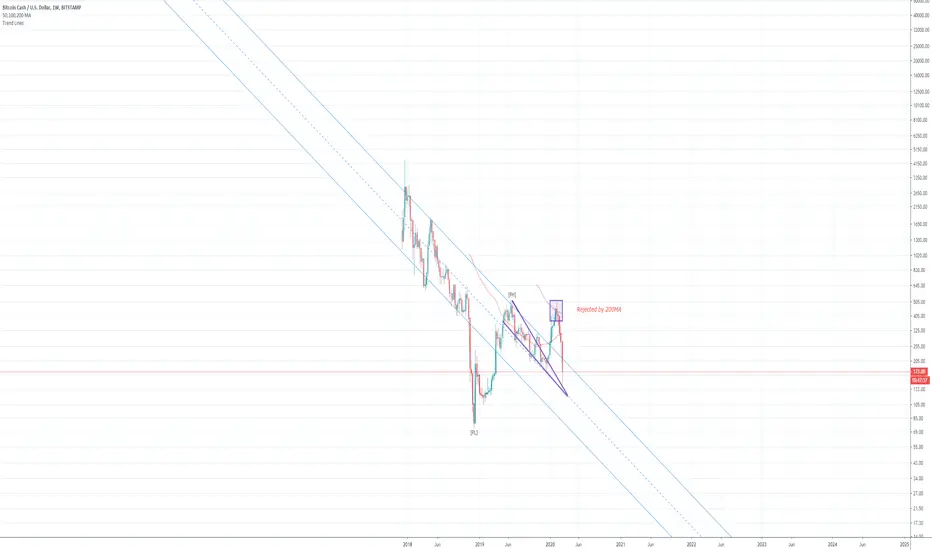
Bitcoin cash returns to parallel channelBitcoin cash has returned to the descending parallel channel it has formed, this could be interpreted as a bump and run and likewise with fall below the parallel channel. Rejected by 200MA as said on chart, weekly chart.
BCHBTC Has Formed Bullish Shark | Upto 20% Bullish MoveBitcoin cash is the world largest digital asset ranked at 4th position as per coinmarketcap data.
This digital asset is one of my favorite crytpocurrencies that gives us trading opportunities on daily basis.
From December 28th to 18th February 2020 this cryptocurrency this cryptocurrency was being traded above the exponential moving average 21 but at this time this coin is being traded below the EMA 21 but likely to cross up this exponential moving average soon we have a second green candlestick with heiken Ashi setup having spikes beyond 21 exponential moving average.
The Formation Of Shark:
This time on 12 hour chart the Bitcoin cash with Bitcoin pair has formed a bullish shark pattern and entered in the potential reversal zone of this pattern.
Let's dig this pattern deeper to examine how perfect this bullish Shark harmonic pattern is formed.
The initial leg was started on 31st of January and completed on 7th of February 2020 then the price action has been retraced between 0.382 to 0.618 Fibonacci levels and that is as required for a perfect bullish Shark pattern’s A to B leg and after the completion of A to B leg the priceline is projected between 1.13 up to 1.618 Fibonacci projection of A to B leg and completed the B to C leg of this bullish Shark pattern. Then finally the C to D leg is retraced between 0.886 to 1.13 Fibonacci level and at this time the price action is floating in the potential reversal zone of this bullish pattern and ready to move up at any time.
The Targets:
The buying and sell targets according to harmonic BAT pattern should be:
Buy between: 0.040225 to 0.038417 sats
Sell between: 0.042242 to 0.046270 sats
Stop Loss:
The potential reversal zone of this pattern can be used as stop loss in case of complete price action closes below this level.
This is short term trading idea not a long term idea; I will be keep posting more trading ideas as soon as I will find more.

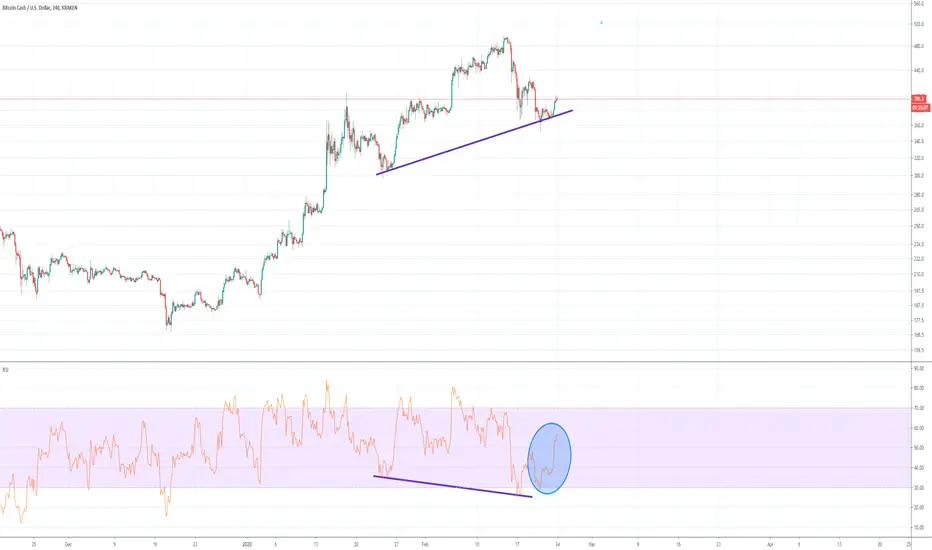
BCH Classic Bullish DivergenceA classic bullish divergence has formed on the BCHUSD pair, a rise in RSI can already be seen to be occurring, bullish divergences are reliable ways to identify trend continuations. This will produce further upsides for the pair. A lot of divergences lately!
Bitcoin Cash Goes Up By a Little Then Down By a LotMy outlook for BCH/BTC is bullish in the short-term but bearish in the medium-term.
I am looking at a possible bounce at this support area, which could serve to validate the ascending support line as resistance, after which I think the price will decrease to the second support area at ₿0.0325.
My main reason for this belief is the RSI and the previous breakdown:
The RSI was above 50 for the entire ascending support line, and dropped below right at the time of the breakdown, suggesting that the upward move has ended.
So, the proposed bounce would also likely cause the RSI to validate the 50-line as resistance and go down afterwards.
The ₿0.0325 are should offer very strong support, since it is the previous breakout level and also supported by the 200-day MA.
Ideally, I would look to short near ₿0.0425, with the aim of re-entering lower near ₿0.0325, in anticipation of the continuation of the move.

BCHUSD Possible Short Term TopPossible top point, don't try and pick tops and bottoms when entering exited a trade, exit when happy with profit, enter when price is 'cheap' for you.

BCHUSD Smashes DowntrendBullish breach of falling wedge has led to a breaking of the current downtrend on BCHUSD, expect some resistance at 200MA (green fractal is indicative of this)

BCH/BTC Inverse H&S SymmetryAn inverse H&S has formed on BCH/BTC, which has turned the pair quite bullish. However it is currently at its mirror H&S level, so price moves may be unexpected, or bearish. I expect this to fall as BCH/USD is currently at a strong resistance trendline.

Bitcoin cash perfect touchesPracticing sketching fractals. Perfect touches along the down trend line, looking to find a bottom.

BCHABCBTC forming bullish Shark | A good long opportunity aheadThe priceline of Bitcoin Cash / Bitcoin cryptocurrency is forming harmonic bullish Shark pattern and soon it will be entered in potential reversal zone to hit the sell targets soon insha Allah.
This PRZ area should be used as stop loss point in case of complete candle stick closes below this zone.
Volume profile is showing less interest of traders here, but Stochastic is oversold and did not give bull cross and MACD is strong bearish so for secure trade we can wait for MACD to turn weak bearish or for stochastic to give bull cross then buy.
I have used Fibonacci sequence to set the targets:
Buy between: 0.026831 to 0.026414
Sell between: 0.027202 to 0.028036
Regards,
Atif Akbar (moon333)

BitcoinCashABC/Bitcoin (July 18) #BCHABC $BCHABC #BTC $BTCBCHABC touched the 2.618 Fibo level and bounced back up to now. It will come back 0.0278 before keep pumping. Wait there and take profit at 0.0365-0.0444
Careful if price is lower than 0.0255
