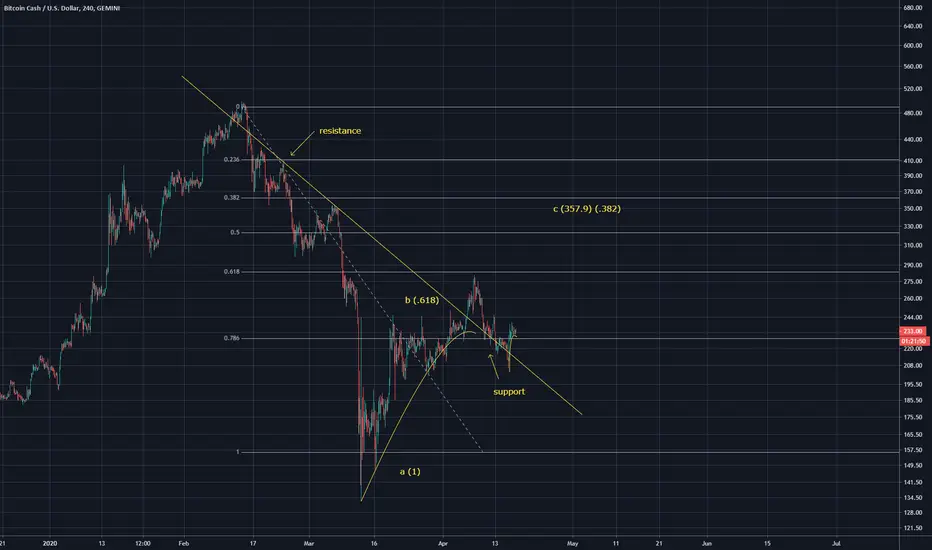
BCHUSD | A Downward Correction Rally Before Bullish MoveHi friends hope you are doing good and welcome to the new update of Bitcoin cash. After the strong best trend that was started from Feb to March 2020. The price action of the BCH completed the final bearish leg of bullish Shark pattern on the 4 day chart. And on 19th March I posted an idea on this move of Bitcoin cash. I predicted as per Fibonacci sequence of this bullish Shark the price action should move up and enter in the Fibonacci projection area of C to D leg from 0.382 to 0.786 Fib projection. And finally after mid of March the price action moved up and as per prediction it entered in this Fibonacci projection area. And so far it has produced more than 56% bullish rally.
Wedge formation and moon phases are giving bearish signals:
Now on the daily chart the price action of Bitcoin cash is moving in a wedge since March 2020. The Bitcoin cash has several touches at the support and the price action has also made several attempts for the breakout. But so far the BCH is not able to break out the resistance of this wedge. Here I have placed the moon phases indicator. On upside you can watch the full moon and on the downside the dark moon can be seen. The distance between one full moon to another full moon and from one dark moon to other dark moon is called synodic cycle that is 29.5 days long. Now after the completion of the recent synodic cycle we can see that the new full moon was appeared down than the previous full moon. And the new full moon is inside the wedge below the resistance. And the recent dark moon was appeared below the support and it down than the previous dark moon. So here the moon phases indicator is giving the bearish signal and indicating that the price action might be moved down from here. Moreover I've also placed bollinger bands indicator and we can see that the upper bands of the bollinger bands is below the resistance of the wedge pattern and the price action is not able to cross up the resistance of bollinger bands and can start another downward move up to the suppor. here I have also implemented the volume profile indicator on the complete price action moving within this pattern that is showing that trader’s interest is strong up to the support that is around $225. Therefore a possible move up to the support is expected. However we take a look at volume indicator then even though there is not a big volume but buying volume is being appeared with the continuity and consistently, therefore the buying volume can cancel these bearish signals.
Now if we take a look at the balance of power indicator then it can be clearly observed that the balance of power is equally distributed between the bears and bulls. On the chart there are 6 obvious downward moves and 6 openly upward moves by this indicator. And the price action is also following the moves of the balance of power. At this time this indicator has made its 6th upward move and the price action has reached at the resistance. Therefore we can expect the seventh downward move by this indicators.
Consistent formation of BATs:
Now let me show you the formation of different harmonic BATs with the continuity. On the daily chart the price action of BCH has completed the formation of third BAT pattern and it is forming these harmonic patterns consistently. Let’s dig these patterns out to watch the how perfectly they are formed:
After initial leg the A to B leg is retraced between 0.382 to 0.50 Fibonacci. And B to C leg is projected between 0.382 to 0.886 Fib projection of A to B leg. And the final leg has been retraced between 0.786 to 0.886 Fibonacci retracement level. And all these BATs has followed the same Fib sequence. Therefore after the completion of third bearish BAT pattern we can expect a downward move from here.
Simple moving averages and resistance of 200 SMA:
Now if we watch the simple moving averages with the time period of 25, 50, 100 and 200 then the price action has crossed up all the moving averages. But only 200 SMA is left to crossed up and if we take a closer look on the chart then it can be easily observed that since April 2020 the price action has made several attempts to break out this simple moving average but so far it is unsuccessful. And at this time the priceline of BCH is struggling at this 200 SMA resistance level again. However this time the priceline of Bitcoin cash has the support of 100 simple moving average, therefore if price action will be dropped from here then it may re-test the 100 simple moving average as a support before any other move to the upside.
Support and resistance levels:
I the month of Feb 2020 the price action was very strong bullish and reached very close to the key level resistance of $500 but unfortunately after reaching at $497 a strong bearish trend was started that leaded the priceline to the first support at $147. After getting bounced from this support level the priceline of BCH broke out the next resistance of $220 and re-tested the previous resistances as support and moved up to breakout the next resistance at $260. So far it is moving between these support and resistance levels between $220 and $260 and now it has formed a parallel channel between these levels. Once the price action will breakout this resistance then it can go to the next resistance at $304 and after breaking out $304 the next resistance would be at $355 and in case of breaking out this hurdle the key level resistance would be at$ 500. If the priceline will breakout $500 then it can reach the highest right ever in the history of Bitcoin cash very soon.
Ichimoku cloud and directional movement:
On the long-term weekly chart the Bitcoin cash is never able to cross up the ichimoku cloud since this cloud is appeared in the history of BCH as per coinbase exchange. We have witnessed several attempts since may 2019 to break out this cloud but unfortunately so far the price action is moving below the cloud. This time the cloud is turned very weak and the lagging span of the ichimoku is crossing up the candlesticks. This is the first bullish signal that we have received now we can wait for the conversion line to cross up the baseline. And once it will be happened then the ichimoku cloud will be turn bullish and it will be easy for the priceline to breakout this cloud and breaking out this cloud will become a very strong support for the price line of Bitcoin cash to start a very long term bullish rally.
If we take a look at directional movement indicator then positive directional indicator has crossed up the negative direction indicator. That is the bullish signal indicating that on the long-term the Bitcoin cash can started a bullish rally. Before this in April 2019 when the positive directional indicator crossed up the negative directional indicators then Bitcoin cash produced 330 % bullish rally. And after that in January 2020 when again +DI crossed up the –DI then the price action of Bitcoin cash started a bullish rally up to 138%. Now the wait is only for the ADX to move up to assign the power to the bulls.
Big bullish Gartley a firm signal for long term bullish move soon:
Now I would like to recall a very big bullish Gartley pattern that is formed on the monthly chart by the price action of Bitcoin cash. I also a posted this pattern in my previous post as well. After entering in the potential reversal zone now the price action is moving just above this PRZ level and it can start movement to the upside very soon. This bullish Gartley can be very helpful for the priceline to start a long term bullish move.
Conclusion:
On the daily chart the bearish signals are more than the bullish signals. Therefore we can expect a correction rally up to the support of the wedge that has been formed on the daily chart. But on the long-term chart the Bitcoin cash is turning very strong bullish specially after the completion of very big bullish Gartley pattern on the monthly chart. So the countdown for a very big upward move has begun.
Note: This idea is education purpose only and not intended to be investment advice, please seek a duly licensed professional and do you own research before any investment.
Bitcoincashusd

BCH/USD Great Buy Opportunity in Parallel Ascending ChannelWhen looking at a pair that has a positive bullish momentum, we get the risk of entering out of FOMO.
Make sure that you don't enter when the price is really high and hasn't retraced yet. For instance, keep an eye on the RSI and don't buy when it's above ~70.
Here in this parallel channel we can see that currently we have a nice opportunity for a buy, because the price is reaching the bottom support line of the channel.
This is a great moment to enter Bitcoin Cash in this bullish market.
Follow me for consistent high quality updates, with clear explanations and charts.
Please like this post to support me.
- Trading Guru
--------------------------------------------------------------
Disclaimer!
This post does not provide financial advice. It is for educational purposes only!

BCHUSD formed bullish Shark | Upto 187% move expectedFailed in breaking out the key level resistance:
The Bitcoin cash had started is very powerful bullish rally in December 2019 after breaking out the first resistance level at $304 the price action used this resistance as support and using this support the price action moved up to make an attempt to breakout the key level resistance of $501. After reaching at $497 the price action turned very strong bearish and broke down all previous supports and at this time the price action of Bitcoin cash is at $182 support.
Head & Shoulder pattern and breaking down the SMAs supports:
If we closely examine the 2 day chart then it can be clearly seen that the main reason for this drop was the formation of Head and Shoulder pattern. This pattern was started with the strong bullish rally of Bitcoin cash in Dec 2019. The left shoulder was completed on January 3rd 2020 and the head was completed on Feb 28. After hitting the key level resistance of $501 the price action formed the right shoulder from 28th February to 7th March 2020 and even broke down the neckline of the Head & Shoulder. While forming the right shoulder we had strong supports of 100 and 200 simple moving averages but the sell off was so much strong that the price action easily broke down these two supports as well.
The priceline is using the support of resistance of previous pennant:
Here I would like to take you back on 23rd December 2019 when I reveled in my post that the price action of Bitcoin cash was moving in a pennant. This movement in the pennant was started on 21st June 2019. And when I published that article the priceline was getting bounced from the support of that pennant and based on some more indications I predicted that this time the BCH will breakout the resistance of the pennant. And on January 2020 the price action broke out the resistance of the pennant. This trade Idea produced more than 154 % massive profit.
Formation of new harmonic Shark pattern a bullish reversal signal:
But now we can examine that priceline is retraced 100% and this time the price action of Bitcoin cash is also having the support of previous trend line that was the resistance of the pennant.
If we observe on 4 day chart then it can be clearly seen that the priceline of Bitcoincash has formed bullish Shark on the support. The formation of this pattern was started in December 2019 when the Bitcoin cash started its rally. The first leg was completed on 17th January 2020 at that time the priceline of BCH retraced between 0.382 to 0.6 18 Fibonacci level. That was the 1st confirmation of bullish Shark. From here the Bitcoincash was the suppose to be projected between 1.13 to 1.618 Fibonacci level of A to B Fibonacci projection area for the completion of B to C leg of this shark pattern move. At C leg’s level we have some extra spike that I have ignored because all other legs are formed as required for the perfect bullish Shark pattern. After the completion of C leg on 14th February 2020 the priceline of BCH faced strong sell off and this bearish move helped the priceline in completion of final leg of shark pattern. And now we can see that the priceline of Bitcoin cash has retraced between 0.886 to 1.13 Fibonacci level and moving in the potential reversible zone of this pattern. From this potential reversal zone the price action of BCH is suppose to take the bullish divergence in the Fibonacci projection of between 0.382 to 0.786 Fibonacci projection of C to D leg.
The ranges of potential reversal zone and Fibonacci projection are as below:
Potential reversal zone is from: $ 196.83 to $ 139.48
The Fibonacci projection area is from: $ 266.47 to $ 401.14
Above range depicts that this pattern can produce upto 188% massive profit rally.
Stop loss:
The volume profile of complete price action of Shark pattern is showing the traders interest even in the PRZ level therefore we need to take care of stop loss strongly in this case we can use the maximum extent of potential reversal zone that is $ 139.48.
Because if this potential reversal zone will be broken down then priceline can turn more bearish.

BITCOIN CASH BULLISH ?BCH looks good to flip the 200 sMA on daily and start a new bullish trend
First targets are those resistance, +15% and +32% from the current price.
Depending on the behavior of BTC we can expect a bigger rally


Will Bitcoin Cash Breakout $500 Key Level Resistance???A double top at resistance level:
Hi friends hope you are well and welcome to the new update on bitcoin cash in today's technical analysis will will try to find out the different bearish and bullish signals and patterns. First of all I would like to take you to the daily chart where we have the different support and resistance levels and if we take a look back in the month of March 2020 then we can see that after the waterfall crash the priceline has hit at the support at $147. And from this support the priceline recovered and broke out the $200 resistance again. And after breaking out the 200 resistance level it has re-tested the previous resistance as support and moved up to break out the next resistance level at $260.But here we have some critical situation cause after a hard attempt for breakout in April 2020 the priceline dropped down again and moved up to re-attempt for the breakout from $260 resistance level. But again the price action is dropping down. So if this drop will be continued then we will have a double bottom formation that can produce more strong bearish rally to the downside.
The priceline is being rejected by the SMAs:
Now if we take a look at the different simple moving averages with the time petiod of 25, 50, 100 and 200 on the same daily chart then it can be easily observed that first priceline broke out the 25 and 50 simple moving averages but when the price action attempted to break out the 200 simple moving average then it is rejected by the 200 SMA. The 200 SMA is almost at the same level where we have the $260 priceline resistance. So the priceline is being rejected at the same time by the $260 priceline resistance level and the 200 simple moving average resistance level as wel. And the Bitcoin cash is forming a double top formation on the chart of the moving averages as wel. Now it can be easy for the price action of Bitcoin cash to break down the 25 and 50 simple moving average supports. Because the pressure from the upside is stronger than the pressure from the downside. As we have bigger moving averages above the price action and those are 100 in 200 SMAs and smaller moving averages below the priceline and those are 25 and 50 simple moving averages.
Priceline could not reach the resistance of up channel:
The BCH has also formed an up channel on the daily chart but this time the Bitcoin cash could not reach up to the resistance of this up channel. If the price action will break down the support of 25 and 50 simple moving averages then it can also break down the support of this channel as well . Because we have the 25 simple moving average at the same level where we have the support of this up channel and in case of breaking down the support of the channel the priceline can easily reach at the support of $200.
The bullish harmonic move on long term chart:
Now I would like to take you to the very long term monthly chart and here we have a very positive move by the price action of Bitcoin cash. And that is the priceline of BCH has formed a very big bullish gartley pattern same as like the Bitcoin has formed on the monthly chart. Even though the price action has spiked beyond the support of the potential reversal zone of this pattern. But within very next cande stick it has been retraced back in the potential reversal zone. Therefore we can ignore the extra spike.
Here I would like to recall a bullish shark harmonic move of the Bitcoin cash that I posted on the 19th of March 2020 in my previous article. This was the pattern that helped the priceline to re-enter in the potential reversal zone of the big bullish Gartley pattern that has been formed on the monthly chart. As we can see that after entering in the buying zone of the bullish shark pattern on the 4 day chart the BCH took a powerful bullish divergence that produced more than 102 percent profit. Now from the buying zone of the bullish Gartley pattern we can expect up to 163% profit spike. So if you want to take it as a single trade then you can buy it within the potential reversal zone of this big gartley pattern and sell it within the Fibonacci projection or sell area as I have defined on the chart but in this case you should make your stop-loss the potential reversal zone that is up to $168.
But if you want to hold it for the long term then you need to watch out for the breakout from the different resistance levels as we have discussed on the short-term daily chart. And if you are looking for that Bitcoincash achieve the highest price ever in its history then we need to watch out for the breakout from $500 resistance level. That is the strongest key level resistance for the Bitcoin cash.
Bullish Shark on 4 day chart:
Ichimoku cloud:
Now I would like to take you to the weekly chart where long term bullish signal can be appeared in the future by the ichimoku cloud. As we can see that so far the price action of Bitcoin cash is not able to cross up the ichimoku bearish cloud. Once in the month of February 2020 the price action crossed up this cloud but during re-testing the cloud resistance as a support it was filled and drop down again. Once the priceline of Bitcoin cash will be able to cross up the ichi moku cloud successfully then the Bitcoin cash can turn bullish on the long-term for the next 2 or 3 years.
Conclusion:
If the price action will be not able to break out the next resistance levels on the daily time period chart. then we can witness further downside rally. But on the long-term the Bitcoin cash has formed is very big bullish patterns therefore on the long-term it is bullish.
Note: This idea is education purpose only and not intended to be investment advise, please seek a duly licensed professional and do you own research before any investment.

Bitcoin Cash: Descending Channel Consolidation 4H (Apr.23)X FORCE GLOBAL ANALYSIS:
In this analysis, we take a look at the technicals demonstrated in the chart of Bitcoin Cash (BCHABC)
Bullish Evidence
- Previously, we have seen parabolic breakouts for Bitcoin Cash after consolidation phases
- It could be said that we are currently consolidating within a downwards parallel trend
- This could turn out to be a textbook bullflag pattern
- We are still above the 0.236 Fibonacci Support
- The Relative Strength Index (RSI) shows higher lows
Bearish Evidence
- We are in a downtrend, creating techincal lower highs and lower lows
- We have broken down from the 0.5 Fibonacci resistance, the 0.382 Fibonacci resistance, and now possibly the 0.236 Fibonacci resistance
- The RSI also shows lower highs
- The Moving Average Convergence Divergence (MACD) demonstrates mixed signals and a lack of momentum to drive a bullish breakout
What We Believe
We believe that Bitcoin Cash will continue its bullish rally only given that it breaks through and closes above the descending parallel channel trend line resistance.
Trade Safe.

Bitcoin cash bullish breakBCH bullish break
Resistance turned support
Looks good
C represents a bulish wave from the ascending scallop breakdown that occurred and formed the new support
Bitcoin Cash: A potential setupBitcoin cash seems to be in a huge falling wedge. It is testing to the top of the wedge and may even break out to the upside. Bitcoin looks really indecisive right now. I am closely monitoring my Ethereum position as well. If this doesn't break out now and bitcoin decides to take a fall we might have a very good trade on our hands. I will long the bottom of the wedge. Let's see how things develop.

Cash?Bitcoin cash has formed a descending broadening wedge
This formation will likely lead to a break to the upside with the positive momentum that is occurring within the wedge
Top cap indicator can be use to observe the potential of such a coin
Gann analysis also included for XBT pair
Bitcoin cash has a very strong presence within social crypto climate

BCH - OVERBOUGHTBitcoin Cash (BCH) broke out of $250 on April 6, which caused our purchase proposed in an in advance analysis. Today, the bulls scaled the fee above the 50-day SMA ($266) but are struggling to maintain on to the intraday gains.
This indicates that the bears are lively at higher levels. If the BCH/USD pair dips back beneath the 20-day EMA ($236), a drop to $two hundred is possible. Below this level, the pair will flip negative. Therefore, the traders can hold the stop loss on the lengthy positions at $197.
Conversely, if the pair surges above $281, a rally to $350 is likely. Therefore, the buyers can path the forestall loss to $220 after BCH sustains above $281 for four hours.

BCH ANALYSIS: CURRENT ACCUMULATION PHASE IN PLAY!BCH ANALYSIS:
BCH is ranging strong inside the zone of 200 to 230, and currently making its way back UP. The current long is entry at 217, scalp UP to T1 at 224.65. This is followed by a sell, and a short back down to T2 at 207.00. These are two short term scalp plays in progress for people who want to short term scalp. BCH hourly resistance will overextend buyers into overbought. The leg up will also give sellers a chance to step in at the top of resistance. I dont believe volume is strong enough to push BCH out of this accumulation phase YET. With that said, any break below support is bearish and will push BCH down to 175. Keep S/L tight in both directions!


How To Trade Moving Averages In a Volatile MarketCryptohopper Newsletter
Chart
Bitcoincash has made a swift recovery of over 70% from its lows this year on the 13th of March. The markets have been very volatile over the past month, and Bitcoincash is no exception. Over the past days however, the price has entered in a consolidation phase between $180 and $225. Trend following indicators tend to work very well in volatile markets. Moving averages are a good example of a trend following indicator.
Let’s dive into how you could have used moving averages to trade this volatile market!
Different Types of Moving Averages
As you probably know there are many types of moving averages, but what are the best ones, and how to use them? This is what we will explore in this week’s technical analysis.
Generally the slower and longer moving averages are used in order to catch the bigger moves in the markets. The slower and longer a moving average is, the more reliable its signal is considered. The disadvantage however is that you may enter positions too late, or that you exit positions too late as well giving back most of your profits. The slowest moving average usually used by traders is the SMA (simple moving average) . This moving average gives the same weight to all of the past closing prices.
Faster and shorter moving averages are then used in order to catch every movement of the price. The advantage of the faster and shorter moving averages is that you will be able to capture all of the market moves early on; at least earlier than the slower moving averages. However the disadvantage to these is that they give a lot of fake signals, so a trader may enter positions on trades that never comes to fruition. The fastest-moving average that is generally used by traders is the TEMA (triple exponential moving average) . This moving average reacts faster to price movements as it gives a lot more weight to the most recent data.
So, how can we create a trading system based only on moving averages, that works? This is what we will explore in the next section.
Moving Average trading system
As slower moving averages tend to give fewer and more reliable signals we can use one in order to time our entries in the market. This way we will limit the number of fake signals and as such our % of winning trades should increase. We can thus use the cross between the 10 EMA and the 30 EMA for this purpose. The EMA is slightly faster than the simple moving average as it gives more weight to the most recent data.
We can then use the TEMA in order to time our exits in the market. A TEMA can be useful as a sell signal, as it reacts faster than the other moving averages and will thus take the profit sooner. The advantage of using a TEMA is that you will exit the trade sooner, and as such you will not be giving as much profit back.
Both the EMA and the TEMA are available at Cryptohopper, along with many other different types of moving averages. Create your fully automated trading system with moving averages today, by joining us on Cryptohopper!

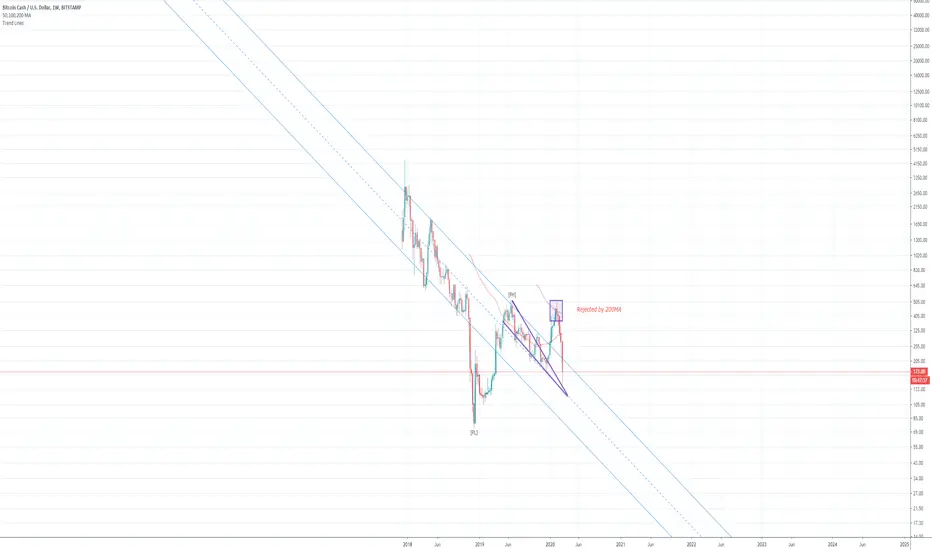
Bitcoin cash returns to parallel channelBitcoin cash has returned to the descending parallel channel it has formed, this could be interpreted as a bump and run and likewise with fall below the parallel channel. Rejected by 200MA as said on chart, weekly chart.
BCH | After Being Rejected By $501 Getting Ready For Next MoveBounced Back From Key Level Resistance $501:
Hi friends welcome to the new update on Bitcoincash. Guys if you remember I posted an article on 2nd Feb 2020 where I told you that the BCH is going to hit its key level resistance at $501 at that time the price of Bitcoin cash was $378 and then it moved up to $497.53 that was very close to resistance level as I predicted in my previous post. And as I have been telling you that this is the key level resistance for the Bitcoin cash as the Bitcoin cash is not able to break out this resistance level since November 2018 once this resistance level will be broken out then Bitcoin cash can start more stronger rally towards achievement of the highest price in the history of Bitcoin cash for which many traders are waiting.
But unfortunately this time again the priceline of Bitcoincash is pushed down by the resistance of $501 in very powerful manner that this time price action even broke down the previous support of $355 and after breaking down this support the Bitcoincash moved back to the next support at $304 again.
At this support level the price action started consolidation and now it is likely to move up again towards the resistance level of $355. Here we also have 100 simple moving average support just beneath the 304 dollar support.
Simple Moving Averages Are In Good Order:
If we see the simple moving averages with the time period of 25, 50, 100, and 200 then sofar they are in good order the 25 simple moving average is above all other moving averages then just below 25 moving average we have 50 moving average after that we have 100 moving average and 200 SMA is just below all these moving averages. Sofar no moving average has formed any death cross with other moving averages. At this time we can see the 25 moving average is showing the tendency to move down to form a death cross with 50 moving average. But this death cross cannot produce the pressure that can lead to breakdown the support.
If we place the Fibonacci retracement to from the recent lowest price of $170 up to recent high of $497.53 then we can examine that the price action is retraced up to the golden ratio of Fibonacci level that is 0.618 Fibonacci then it is likely to up from here.The 100 simple moving average is also playing is very important role here as it is just below this golden ratio of 0.618 Fibonacci level to provide a strong support to priceline of Bitcoin cash.
Oscillators And Indicators Are Turning Bullish:
If we see some other oscillators and indicators then we can observe that on daily chart all oscillators and indicators are also turning bullish. For example the price action is getting bounced from the lower bands of bollinger bands and Reletive strength inex (RSI) has already visited the oversold zone and turned bullish now. If we see the stochastic then it can be clearly seen that the stochastic has given bull cross from the oversold zone and moving average convergence divergence indicator (MACD) was strong bearish but now it has also given weak bearish signal and that is also another bullish sign.
We Need The Priceline To Cross Up The Exponential Moving Averages To Back In Rally:
On 2 day chart above exponential moving averages with the time period of 10 and 20 we can see that price action was moving above these EMAs from January 7th up to 18th Feb 2020. But now the priceline has crossed down these eponential moving averages and both EMAs have formed bear cross now it is really very important for the Bitcoin cash to cross up these moving averages again in order back in bullish rally.
A Bullish Harmonic Pattern Is Always Helpful To Move The Priceline Back To Bullish Trend:
Here a very strong bullish continuation signal is appeared and that is the formation of bullish Cypher pattern let's dig this pattern deeper and see how perfect this pattern is formed. Initial leg was started from 25 December 2019 up to 17th of January 2020 then B leg is retraced between 0.382 to 0.618 Fibonacci. Then priceline started B to C leg and projected up to 1.414 Fibonacci projection of A to B leg. Then C leg is retraced between 0.618 0.786 Fibonacci. And this is the Fibonacci projection of X to C leg here formation of bullish cypher pattern is completed and the priceline is moving up. Guys this pattern can be great help for price action of Bitcoin cash to break out $355 resistance.
Ichimoku Cloud Turned More Bullish:
In my previous article we have seen that the ichimoku cloud was turned bullish up to 4 days chart. But now it has turned bullish up to 1 week chart. After crossing up the cloud now the candlesticks are retesting the bearish cloud as support. The lagging span is above the price action and did not cross down the priceline but once it will cross down the priceline then we can see e a bearish trend.
Here I have placed the chop zone indicator and we can see that the chop zone is turned weak bullish before that is was strong bullish from 13th of January upto 24th of February but this week it has turned weak bullish. We need to observe this indicators for next couple of days if it will be turned bullish again then candle sticks with lagging span and conversion and base lines cross up the cloud and then we can see the ichimoku even more bullish.
But if this chop zone will be turned bearish from here then the BCH can face bearish trend.

BCHBTC Has Formed Bullish Shark | Upto 20% Bullish MoveBitcoin cash is the world largest digital asset ranked at 4th position as per coinmarketcap data.
This digital asset is one of my favorite crytpocurrencies that gives us trading opportunities on daily basis.
From December 28th to 18th February 2020 this cryptocurrency this cryptocurrency was being traded above the exponential moving average 21 but at this time this coin is being traded below the EMA 21 but likely to cross up this exponential moving average soon we have a second green candlestick with heiken Ashi setup having spikes beyond 21 exponential moving average.
The Formation Of Shark:
This time on 12 hour chart the Bitcoin cash with Bitcoin pair has formed a bullish shark pattern and entered in the potential reversal zone of this pattern.
Let's dig this pattern deeper to examine how perfect this bullish Shark harmonic pattern is formed.
The initial leg was started on 31st of January and completed on 7th of February 2020 then the price action has been retraced between 0.382 to 0.618 Fibonacci levels and that is as required for a perfect bullish Shark pattern’s A to B leg and after the completion of A to B leg the priceline is projected between 1.13 up to 1.618 Fibonacci projection of A to B leg and completed the B to C leg of this bullish Shark pattern. Then finally the C to D leg is retraced between 0.886 to 1.13 Fibonacci level and at this time the price action is floating in the potential reversal zone of this bullish pattern and ready to move up at any time.
The Targets:
The buying and sell targets according to harmonic BAT pattern should be:
Buy between: 0.040225 to 0.038417 sats
Sell between: 0.042242 to 0.046270 sats
Stop Loss:
The potential reversal zone of this pattern can be used as stop loss in case of complete price action closes below this level.
This is short term trading idea not a long term idea; I will be keep posting more trading ideas as soon as I will find more.

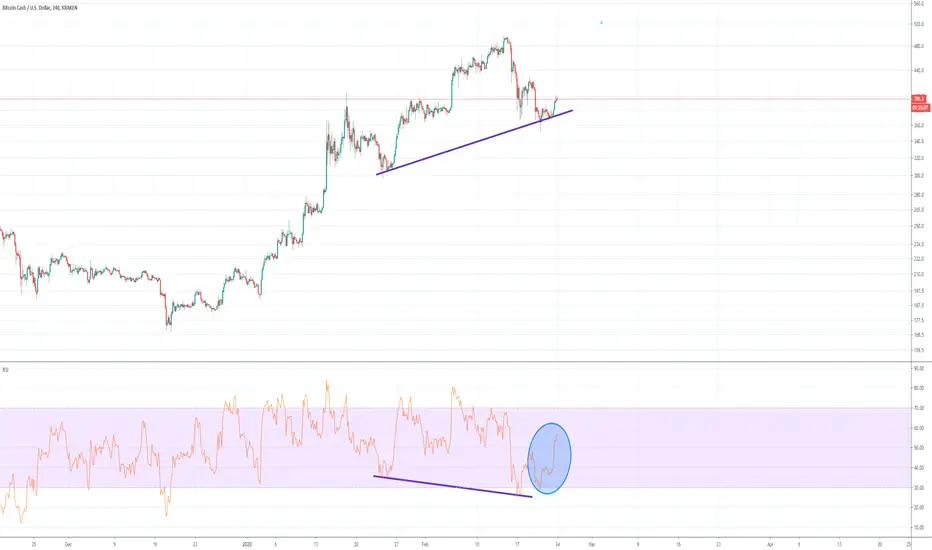
BCH Classic Bullish DivergenceA classic bullish divergence has formed on the BCHUSD pair, a rise in RSI can already be seen to be occurring, bullish divergences are reliable ways to identify trend continuations. This will produce further upsides for the pair. A lot of divergences lately!
BCH/BTC IdeaBCH did not hold 4300-4400 area as support. Once broken we retested the 3600-3700 area and retested the previously broken support in the 4400 area. We are now retesting the new support in the 3600-3700 area and if we hold this area then i expect bullish continuation. I recommend waiting on the breakout and retest once we break the downward trend

BCHUSD Possible Short Term TopPossible top point, don't try and pick tops and bottoms when entering exited a trade, exit when happy with profit, enter when price is 'cheap' for you.

Bitcoin Cash A Journey From $77 to $501In my previous post we finally witnessed that the Bitcoin Cash had broken out the resistance of the pennant and produced more than 43% profit in 1st rally:
In previous article the exponential moving average 10 had formed bull cross with exponential moving average 20 up to 3 day chart but now this bull cross is reflected upto week chart which is really a very strong bullish indication and we are seeing this bull cross 1st time since after May 2019:
Previously the ichimoku cloud was turned bullish upto 1 day chart but now it has turned bullish upto 4 day chart and this time lagging span has crossed up the bullish cloud with bull cross formation between conversion line and base line, and candle sticks likely to cross up the cloud very soon.
Previously the MACD upto 1 week chart was weak bearish and stochastic had given bull cross but now upto 3 weeks chart the MACD has turned strong bullish and Stochastic has given bull cross 1st time since after 19 Mar 2019.
In Oct 2019 I posted an idea on tradingview where I predicted that the Bitcoin Cash has formed Gartley pattern and it can move upto 133% from the potential reversal zone of this gartley pattern now you can see the price action has taken powerful bullish divergence and so far it has produced more than 110% profit.
But if the candle sticks will be closed above 133% level which is the 0.786 Foibonacci projection of A to D leg of this Gartley pattern then we can witness more powerful bull rally which can lead to break out from the key level resistance at $501.
In may 2019 the simple moving averages 200SMA, 100SMA, 50SMA and 25SMA on day chart formed a complete opened alligator mouth which leaded the price action from 76 dollar to 517 dollars.
Now the these simple moving averages are likely to form same alligator's mouth very soon.
Now lets move to previous post again as we have already seen that we have 3 resistance levels one above another.
1st Resistance at: $304.48
2nd Resistance at: $355.43
3rd and Key level Resistance at: $501
Now lets have a look at price action move from $170 up til now since I am posting the predictions of Bitcoin Cash. 1st the price action broke the 1st resistance at $304.48 and then moved down and retested this resistance as support now in next rally the price action has broke out the 2nd resistance level at $355.43 and now the candle sticks are consolidating and likely to make a same move of price correction again and soon the priceline will retest the previous resistance of $355.43 as support and in case of successful retest the price action will take the bullish divergence and may hit the 3rd and key level resistance at $501 and this one will be approximately 40% bullish move and we will be up by 194% from $170, and if the $501 resistance will be broken out then we can see a massive powerful bull rally.
Sofar my stop loss is still $304.48 that is the 1st resistance and now working as a very strong support specially after successful retest.
Regards,
Atif Akbar (moon333)

BitcoinCashIt is probable that the range of 358 corrections will continue and then climb
If we break the 358 range, we will have a further decline
