BCHUSD formed bullish Gartley | Upto 17% move expectedWorld's 4th ranked crypto token Bitcoin Cash (BCH) has formed bullish Gartley pattern and entered in potential reversal zone and ready for bullish reversal soon.
This potential reversal zone should be used as stop loss in case of complete candle stick closes below this zone.
Lets have a look on the dimensions of SNGLS priceline's move:
After initial leg (X to A) the A to B leg is retraced between 0.618 to 0.786 Fibonacci and then B to C leg is projected between 0.382 to 0.886 of A to B leg's Fibonacci projection and final (C to D) leg is retraced between 0.618 to 0.786 Fibonacci as perfectly required for Gartley pattern and now the price action is moving in potential reversal zone of this Gartley pattern, now we can expect bullish divergence at any time which will lead the priceline between 0.382 to 0.786 Fibonacci projection of A to D leg, but after this bullish divergence if the candles sticks will be closed above the 0.786 Fibonacci levels then it can also lead to the long term bullish move.
So as per Fibonacci sequence method we can set our targets as below for mid term trade:
Buy between: $345.97 to $329.91
Sell between: $358.59 to $388.78
As per above targets this very short term 3hr chart based trade has potential to produce upto 17% gains.
Regards,
Atif Akbar (moon333)
The harmonic moves analysis involves hours of hard work and determination however the success of harmonic trading in fiat and cryptocurrencies is around 80% therefore it is always important that you follow any stop loss strategy while trading harmonic patterns I have also shared a stop loss idea in this article, the information in this article is for educational purpose only this is not an investment advice, I have tried my best to catch the harmonic moves as per predefined classical harmonic Gartley pattern if you find any flaw or you have any suggestion feel free to share with me in comments section.
Bitcoincashusd

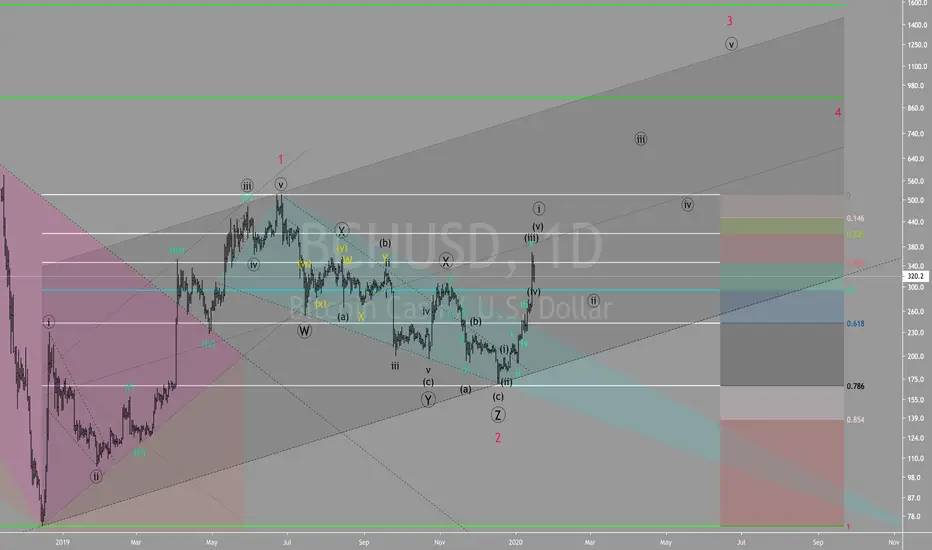
#BCH - Bitcoin Cash - CleanestBeen a while since I took a look at $BCH but it seems that this one is currently one of the cleanest counts out there.
Here is are my short term and long term counts for #BCH.
Will we see a bull market until the second half of 2020?
#CRYPTO #BCH
BCHUSD Smashes DowntrendBullish breach of falling wedge has led to a breaking of the current downtrend on BCHUSD, expect some resistance at 200MA (green fractal is indicative of this)

BCHUSD likely to hit the key level resistance at $501In my previous post I depicted that After taking a powerful bullish divergence in Dec 2018 the price action made upto 608% big move after that the priceline of Bitcoin Cash was going through the price correction period since Jun 2019 Upto Dec 2019 and the most lowest point has hit the 0.786 Fibonacci projection from lowest to highest point, and in the meanwhile the price action had formed a pennant and we were waiting for the bullish divergence which could lead the price action of BCH to breakout the pennant’s resistance.
www.tradingview.com
Now finally we can see that the Bitcoin cash has broken out the resistance of the pennant. So far it this bullish move has produced more than 43% profit but the game is not over coz the indicators and oscillators are still turning bullish.
In previous article we were waiting for exponential moving 10 to form a bull cross with EMA 20 on day chart but now the bull cross is reflected upto 3 day chart and both moving averages has crossed down the priceline and lifting the price action up.
Previously the ichimoku cloud was turned bullish upto 4hr short term chart but now it has turned bullish upto day chart and lagging span has crossed up candles and cloud both and candle sticks has crossed up the cloud with strong bullish rally which is a very strong bullish sign for the future as well.
And before we had bull cross from stochastic on day chart and MACD was turned strong bullish now we have stochastic bull cross upto week chart and moving average convergence divergence is turned weak bearish from strong bearish and turning bullish upto week chart.
On 2 day chart the price action had formed bullish Shark as below:
And now after taking the powerful bullish divergence the price action has hit the Fibonacci projection area of C to D leg and entered in sell zone of mid term trading setup a to watch it you can play the above idea.
Now we have a resistance at $304.48 once the price action will able to cross up the 0.786 Fibonacci projection of C to D leg the definitely the price action will hit at this resistance and if the pricline will be able to breakout this resistance the it will move to hit the next resistance level at $355.43 and this move can be rapid after this resistance we have key level resistance of Bitcoin Cash which is at $501which is not broken since Nov 2018 once it will be broken then a new bull rally will be started.
Moreover the Gartley pattern on week chart is also on the play to give more bullish power to price action as we are in the potential reversal zone of this big bullish Gartley pattern.
Soon I will post more updates with the further developments in the price action of BCH.
Moreover I have shared tradingview link below where you can find my all trading ideas on different assets and I have also shared Binance exchanges link with some other useful links coz Binance has largest volume of every cryptocurrency with minimum trading constraints.
Regards,
Atif Akbar (moon333)

BitcoinCash vs USD Higher short term, then down and strong UP :)Hi Traders,
it might sound a bit complicated but you will find all details while watching video
Enjoy

BCH/BTC Inverse H&S SymmetryAn inverse H&S has formed on BCH/BTC, which has turned the pair quite bullish. However it is currently at its mirror H&S level, so price moves may be unexpected, or bearish. I expect this to fall as BCH/USD is currently at a strong resistance trendline.

BCH follows the King
Bitcoin Trash is bullish with bullish BTC. Pushing up towards 217-220. If breaks above, it will be worth just to let it grow with stop loss moving behind lower high values, although nearest targets would be 226 - 235 - 243.
If breakout won't happen now (which is most probable), then might pullback to year support at 204-208. Good long zone.

BCHUSD (Daily Chart) #BCHUSD (#Coinbase) Resistance $220 if breakout then next Target will be $390, Daily Chart Support at $168

The roaring 20'sBitcoin cash has formed a massive falling wedge, this falling wedge may lead to major upsides as a result of its size. A 0.5 fib extension is the target for this falling wedge. The support range should be a place for SL if the falling wedge breaks down, however caution when doing this as falling wedges may break down just to climb back up further than the wedge. Bitcoin cash has seen many ATMs pop up around the world, this growth is expected to continue.

BCHUSD Has Completed The Bullish Setup For Upto 163% GainsThe price correction and formation of pennant:
After taking a powerful bullish divergence in Dec 2018 the price action made upto 608% big move after that the price action is going through the price correction period since Jun 2019 Upto Dec 2019.
Now the price action is hitting 0.786 Fibonacci projection of lowest point of Dec 2018 to highest point of Jun 2019.
With the price correction the price action has also formed a pennant with four touches at the support of the pennant, this time the priceline has hit the spike beyond the lowest band of Bollinger bands and hit the support of the pennant and like to have a bounce form this point.
The moving averages:
If we see the moving averages then on day chart the exponential moving average 10 is likely to form a golden cross with exponential moving average 20 like it formed in Oct 2019, at this time the EMA 10 is crossing down the price action to lift it up then it might form a golden cross with EMA 20.
It will be 1st golden cross of above said exponential moving averages since after death cross which was formed on 17 Nov 2019 but this time the price action has already hit the support of pennant therefore this time we can have more powerful bullish divergence than the previous move Oct 2019.
The true cloud reversal:
On 4hr after 12 Nov 2019 the ichimoku cloud is proper reversed to bullish 1st time after 12 Nov 2019 when it was turned bearish during this time period the cloud was reversed to bullish on 3 Dec but that was clearly false reversal coz at that time the lagging span was failed to cross up the priceline and conversion line was also not able to proper cross up the base line but this time we can see very clear the lagging span has proper crossed up the candle sticks and conversion line has also crossed up the base line in very obvious manner and the cloud is also turned bullish therefore this time the cloud reversal is likely to be very true.
Oscillators:
The Relative strength index (RSI) was oversold and now it has turned strong bullish on the other hand if we see the stochastic RSI then it was also oversold and now turned strong bullish by giving bull cross from oversold zone and the moving average convergence divergence (MACD) has also given strong bullish signals by giving bull cross.
The harmonic move and Volume profile:
The price action of Bitcoin Cash has also formed a Gartley pattern which was started since Dec 2018.
After initial leg (X to A) the A to B leg is retraced almost upto 0.618 Fibonacci (there is slight difference of 0.027 Fibonacci but all legs are driven perfectly as required for bullish Gartley therefore I have ignored this slight difference and considering it upto 0.618 Fibonacci levels), then B to C leg is projected between 0.382 to 0.886 Fibonacci projection of A to B leg and finally the C to D leg is retraced between 0.618 to 0.786 Fibonacci level and here the Gartley is completed and from this are the potential reversal zone starts.
Now the price action is expected to take bullish divergence between 0.382 to 0.786 Fibonacci projection of A to D leg as it has already projected and again entered in potential reversal zone but the price line may take another bullish divergence to hit the sell zone as if we see the Volume profile of complete pattern then it is still showing very less interest of traders below this potential reversal zone of Gartley pattern.
So according to this pattern we can set our targets as below:
Buy between: 243.03 to 168.34
Sell between: 301.81 to 443.66
So this time the Bitcoin Cash's move has potential to give upto 163% gains, however our stop loss point would be the base of this potential reversal zone in case of complete candle sticks closes below this support level.
Regards,
Atif Akbar (moon333)

BCHUSDT formed bullish BAT | A good long opportunityPriceline of Bitcoin Cash / US Dollar cryptocurrency has formed a bullish BAT pattern and entered in potential reversal zone.
This PRZ area should be used as stop loss point in case of complete candle stick closes below this area.
I have used Fibonacci sequence to set the targets:
Buy between: 204.25 to 202.67
Sell between: 207.90 to 213.55
Regards,
Atif Akbar (moon333)

Bitcoin cash perfect touchesPracticing sketching fractals. Perfect touches along the down trend line, looking to find a bottom.

Bitcoin Cash Analysis: Daily Timeframe Bearish BiasConclusion for today's Bitcoin cash analysis: Lack of a price close above ~324 that is followed by a break below 247 is bearish for Bitcoin Cash.
A log scale of BitcoinCash is presented using Japanese candlesticks on the Daily timeframe. The major bullish trend in the cryptocurrency that lasted over 8 months is highlighed on the chart. A break below the bullish trenline is bearish.
The slope of the 200 Day moving average of BitcoinCash changing from a rising to zero slope also supports the notion that prices are perhaps going to resume further movement to the downside. The 200 day moving average currently coincides with the 324 price level and suggests that the the latest bullish price swing from October 23, 2019 might run into resistance at the aforementioned price level.
382 to 356.88 also present an immediate resistance zone above the 200 Day moving average so that any price movement above the moving average can be expected to stall in the resistance zone, even if temporarily. A break above the upper boundary of resistance at 382 improves the chances of having bullish momentum sustained.
On the other hand, lack of a break above the 200 Day moving average that is followed by price closing below 247 is bearish for BitcoinCash.


BITCOIN CASH - Technical Analysis - 37.4%-518% Profit ExpectedBITCOIN CASH - BCHABCUSD - Technical Analysis - 37.4%-518% Profit Expected
Big Move Coming Up ... 5x Gains Expected.
Based on AB=CD pattern , Time Ratio & Gann Analysis, It's a potential long position with great returns :)
In a lower time-frame (4hrs) this long position has also been confirmed.
Target Profit Range - 158 - 448
(37.4%-518% Profit Expected)
TP - 1 - 158
TP - 2 - 211
TP - 3 - 265
TP - 4 - 325
TP - 5 - 385
TP - 6 - 448
Buying Zone! Long Position
Early Entry Trigger Point - $100-$115
Ideal Entry Trigger Point - $65 - $80
Adjust your Stop Loss according to your lot size,
account equity, strategy & money management.
***If you want to get in this trade from this point 214 you can still make 23.83% profit till TP3 is reached, however, there is a very high probability that price may continue to move down towards my ideal entry point., It is recommended to enter with a smaller lot size if you want to go long right away & manage your stop loss accordingly.
Good Luck.!
Disclaimer - This is not financial advice. This is my personal view and analysis of this chart.
If you follow this idea please plan your trade according to your lot size and account equity.
Don't forget to like, comment & follow , If you agree with my analysis :)

BCHUSD formed Gartley | Upto 133% expectedPriceline of Bitcoin Cash / Bitcoin cryptocurrency has formed a bullish Gartley pattern and entered in potential reversal zone.
This PRZ area should be used as stop loss in case of complete candle stick closes below this zone.
Price action is getting bounced from bollinger bands support.
Volume profile is showing less interest of traders at PRZ level but MACD is strong bearish and Stochastic is oversold and in bear cross so for secure trade we can wait for MACD to turn weak bearish or for stochastic to give bull cross then buy from the potential reversal zone.
I have used Fibonacci sequence to set the targets:
Buy between: 261.41 to 192.04
Sell between: 317.16 to 448.29
Regards,
Atif Akbar (moon333)

BCH Bullish DivergenceTripple bottom formation on 1hr chart.
4hr chart is looking to make a turn around soon.
If this price rise happens, look to the 1D chart for a near drop in price possibly breaking $300 resistance.
Influx of volume today will confirm or cancel out this forecast.
______________________________________________________
Bitcoin and other cryptocurrencies are a very speculative investment and involves a high degree of risk. Investors must have the financial ability, sophistication/experience and willingness to bear the risks of an investment, and a potential total loss of their investment.
Information provided by King Midas is not intended to be, nor should it be construed or used as investment, tax or legal advice, a recommendation, or an offer to sell, or a solicitation of an offer to buy, an interest in cryptocurrency. An investment in cryptocurrency is not suitable for all investors.


BCHUSD has formed a bullish butterfly | Upto 34% potential tradeThe priceline of Bitcoin Cash / US Dollar has formed a bullish butterfly pattern and entering in potential reversal zone.
I have defined the targets as per Fibonacci sequence plz find below:
Buy between: 270.41 to 246.82
Sell between: 288.75 to 333.09
Regards,
Atif Akbar (moon333)

Is Bitcoin Cash Your Best Bet?Bitcoin Cash, like many of the other bigger crypto's is sitting at a critical level. We are receiving short term sell signals, however if BCH can fairly maintain these current levels, it may form a bullish flag pattern on the shorter time frame. I like the recent surge of volume on the shorter time frame! Looking at our daily chart, the MacD is at a critical support level. This is a crucial weekend for not just Bitcoin Cash, but cryptocurrency in general!
The Megalodon indicator uses a machine learning algorithm, combined with data from over 500 buy setups, and over 2000 indicators to produce extremely accurate buy signals on any and all asset classes! You will also receive real time buy and sell signals for the stock market, cryptocurrency, as well as forex markets! We also completed our cryptocurrency automated trade bot. It trades for you, using our backtested indicator with phenomenal results! So try it today!!!

BCHBTC Bottomed out Its about time Bitcoin Cash gave us the opportunity to long those steroidal rallies, this is looking like a safe bet to get in before the storm strikes next week.
- Daily Bullish engulfing
Support Levels:
- Mid Range: .3009 BTC
Resistance levels:
- 25% range : .03115 BTC (Very weak resistance now, hammered 3 times already)
- Range High : .03219 BTC (Strong resistance)
Stop loss: .02919 BTC
Game Plan: Long the test of support, sell half of the position at Range High, if we break through the range high level, we have found the bottom of which should be considered a very strong rally and should be targeting .03540 and higher!!
Stop loss remains intact below the low of previous daily bullish engulfing candle, that base should be defended by the bulls if we are to push higher.
Cheers!!!

Bitcoin Cash ascending triangle, an ideaBitcoin Cash broke the ascending triangle resistance and could potentially fill a 20% gain from here.

