What is bitcoin CME Gap? How to use BTC gap IndicatorWhat is bitcoin CME Gap? How to use BTC gap Indicator
The 'Gap' in the CME (Chicago Mercantile Exchange) futures market, which offers a glimpse into the movements of institutional investors, is one of the key indicators many professional traders watch closely.
1️⃣ What is the Bitcoin CME Gap?
CME is one of the primary avenues for institutional investors to access Bitcoin. However, the CME Bitcoin futures market closes over the weekend (from Friday afternoon to Sunday afternoon, Chicago time, USA). Additionally, there is a one-hour trading break after market close on weekdays.
Conversely, spot exchanges like Binance and OKX, which we commonly see, operate 24 hours a day.
This difference is where a 'Gap' occurs. Especially during weekends, when the break is longer, gaps tend to be larger.
Bearish Gap: Occurs when the opening price after the CME market closes is lower than the closing price. This means that the Bitcoin price fell in the spot market during the off-hours.
Bullish Gap: Occurs when the opening price after the CME market closes is higher than the closing price. This means that the Bitcoin price rose significantly in the spot market during the off-hours.
Abrupt Psychological Shift: This implies that investor sentiment leaned heavily towards one side during the weekend.
Unfilled Order Blocks: The gap area is interpreted as a region where potential unfilled orders (buy/sell pressure) may exist.
Gap Fill Phenomenon: Many traders believe in the adage "gaps get filled" and use it as a trading strategy. This suggests a tendency for the price to move in the opposite direction of the gap, eventually attempting to cover the gap area. However, this phenomenon is not 'mandatory', and whether a gap will be filled immediately or much later must be judged through various analyses.
2️⃣ Easily Find CME Gaps
The Bitcoin CME gaps multi-timeframe auto finder indicator automates CME candle analysis and displays it intuitively on the chart.
⚡Indicator Features and Usage
Multi-Timeframe Gap Detection: 5-minute, 15-minute, 30-minute, 1-hour, 4-hour, and even 1-day candles! It simultaneously detects and displays CME gaps occurring across various timeframes. Whether you're a short-term trader or a long-term investor, you can check gaps according to your trading style.
Automatic Box and Label Display: The detected gap areas are drawn as rectangular boxes on the chart. Bullish gaps are displayed in green tones, and bearish gaps in red tones, making them easy to identify at a glance. The size of each gap (%) is displayed as a label above its respective box.
Highlight Function: Large gaps above a set threshold (e.g., 0.5%) are highlighted with an emphasized color. 'Big gaps' can have a greater impact on the market, so they should be noted.
Chart Price Synchronization: The price of spot charts from other exchanges may differ from the CME futures price. This indicator adjusts the price of the gap boxes to the price level of the chart you are currently viewing via the "Chart_price" mode. By using the "Chart_price" mode, you can more intuitively grasp the price level of the gap box on the spot chart and make direct trading plans on the chart of another exchange you are viewing.
Real-time Alerts: You can receive real-time alerts when a new CME gap is detected. You can also set alerts to notify you only about gaps from a specific timeframe. This is extremely useful when you can't continuously watch the chart during weekends or specific times on weekdays.
3️⃣ Trading Strategies
💡Gap Fill Strategy:
When a Bullish Gap Occurs: If the price breaks above a bullish gap but then falls back into the gap area attempting to fill it, one might consider a long position near the bottom of the gap, or a short position if the price fails to rebound from the top of the gap. Alternatively, a strategy of considering a short position in a resistance zone before the gap is filled is also possible.
When a Bearish Gap Occurs: If the price breaks below a bearish gap but then rises back into the gap area attempting to fill it, one might consider a short position near the top of the gap, or a long position if the price fails to fall from the bottom of the gap. Alternatively, a strategy of considering a long position in a lower support zone before the gap is filled is also possible.
💡Utilizing as Support/Resistance Areas:
Old CME gap areas can act as strong support or resistance lines when the price retests those levels in the future.
Observe whether the price encounters resistance and falls again when it reaches the top of a bearish gap, or if it finds support and rises again when it reaches the bottom of a bullish gap. Gaps that overlap across multiple timeframes can hold even stronger significance.
💡Trend Confirmation and Reversal Signals:
If a strong bearish gap occurs and is not immediately filled, but the price continues to fall, this could indicate the start or continuation of a strong downtrend.
If a strong bullish gap occurs and is not immediately filled, but the price continues to rise, this could indicate the start or continuation of a strong uptrend.
You can use the price movement after a gap occurs to gauge market momentum and apply trend-following or trend-reversal strategies.
For example, if a bearish gap occurs but is quickly filled within a few days and breaks above the top of the gap, this could be interpreted as an early sign that the bearish market has ended.
💡Multi-Timeframe Analysis:
When looking for key support/resistance levels, check not only the gaps of the current timeframe you are viewing but also gaps from higher timeframes (e.g., 4-hour or daily gaps on a 1-hour chart).
Gaps from larger timeframes are areas of stronger market interest. When making trading decisions in smaller timeframes, consider the location of important gaps from higher timeframes for risk management or to set entry/exit targets.
Short-term Gaps (5m, 15m): Most gaps occur within 1% and can be utilized for short-term volatility, high-leverage scalping, or day trading. They are suitable for quick entry/exit strategies, with caution against whipsaws. They tend to be filled before the 4-hour candle closes after the market opens.
Medium-term Gaps (1h, 4h): Can be referenced for swing trading or position trading. They can become significant support/resistance areas depending on price movement after the gap occurs.
Long-term Gaps (1d): Can act as major turning points in market trends or as important support/resistance levels from a long-term perspective. If a 'big gap' occurs, the possibility of a shift in the market's overall direction should also be considered. They usually occur during the weekend off-hours, and sometimes large gaps of over 3% occur.
A weekday short-term gap that was filled 4 hours ago.
A weekend long-term gap that saw a trend increase after a 4% big gap occurred.
4️⃣ Conclusion
The 'Bitcoin CME Gap Multi-Timeframe Auto Detector' indicator is a powerful tool that helps you not miss crucial price fluctuation points in the market.
However, no indicator should be blindly trusted. Gaps may not be fully filled, or the price may immediately break out in the opposite direction after surpassing a gap. Instead of relying solely on gap filling, it is crucial to analyze it in conjunction with other indicators to increase your win rate.
We hope you utilize the information gained from this indicator and combine it with your existing analysis methods (chart patterns, auxiliary indicators, macroeconomic analysis, etc.) to build more sophisticated trading strategies.
📌If this content was useful, please support us with a boost and comments. Your small encouragement is a great strength for creating better analyses and content. By following, you can also receive notifications about our postings
Bitcoinchartpattern

Bitcoin Big Liquidity Till 28.1KBitcoin is crawling back up to 28.1K.can it make it there to take the big liquidity or it will get rejected and collapse to 25.9K at least
thanks for watching

Bitcoin Ready For A Capitulation Candle to 23.8!Bitcoin Holding a good range to sweep both sides for FOMC - to the upside 28.1 and downside 26.5. after that it will make the main move.I didnt mention fibs today but keep them in check.
Thanks for watching

Bitcoin still has room to go lower before a pull back to upsideBitcoin price hit 25.3 on friday but our expectation was at least 25.1 and at best 24.7. still wating for that.
Overall Im looking for long oppurtonities and Im holding my shorts
Thanks for watching and all your support

Bitcoin Trying To Regain 30K For Another LegupBTC yesterday hit our pink trendline and holding a little below it.indicating possible retest or pullback to the origin of the pump.Ive mentioned my previous recordings (XRP ALGO HBAR )
Thanks for watching

Bitcoin Holding Low 30K For A Pull Up Or A Crash!BTC holding 30K after blackrock refiled the application.At the same time BTC looks very weak.will this 30K hold become bullish or bulls are out of breath ?
Thanks for watching

Bitcoin Giving Us Daily Reversal PatternBitcoin Printed An 8H Reversal Pattern Yesterday And Daily reversal pattern Today.The signs are there for a huge reversal. Is it Real or Jebait ?
Thanks for watching

Bitcoin Consolidating For Another Sell Off.25K Imminent!*** DISCLAIMER No Financial Advice ***
Bitcoin can go as low as 25K today
it's important to note that technical analysis and patterns suggests an imminent correction before the next leg up
when we reach 25K then we decide the next level but IMHO 20K is comin slowly but surely and more lows will follow after that
Thanks for watching
Please support the channel by Boost,Follow,Comment and sharing my video

One last dump in our slow recoveryso what I've been trying to do is to find pattern from the first ATH and its dump (Apr 2021) with last time ATH and its dump (Nov 2021)
if you look at the left rectangle , there was a big dump then consolidation then a spike up then more consolidation and the pump started
If this pattern works out ,the right rectangle had a spike and now its time for another lower low (23800) then we start pumping.
Also if you notice , the dump and consolidation of All Time High in Apr 2021 happend in May and July and the same pattern is occurring again after Nov 2021 on May and July but with lower volume due to all the things happening in world ( war, economy, food shortage)...

BTC Perpetual Futures 2week video Four - Seeing planets formingIt is like mapping the big bang of an idea and the universe that evolves around it. Structures form. Gravity. Bonds. Waves of creation rising and falling. Basic stuff.

BTC Perpetual Futures 24hr video Two - Exploring the SystemThere is a little process time between videos which has acted as a nice reflection for myself. I am going to keep trying to find the two parts of my mind that can talk and chart simultaneously. It's like learning to raise one eyebrow or gnarl a lip, you know the ability is in there you just have to find the path from your brain to the specific muscles. Thank you for watching if you have. Feel free to ask questions. I am just an artist exploring a new space.

BTCUSD Bitcoin 15th - 20th - 15 minute patternsThe Pink Line before the 15 - indicates start of new charting.
Here i start with extending the previous trend lines looking for continuation. I then rotate around the lines that have been passed searching for new pattern hubs. I am keeping in mind the current state, the projected state, and the reported state of bitcoin as a mental guide. without AI I'm not sure if any heuristic would be without personal translation. Every translation is different based on the observer. I am hoping it crashes and I can buy more. but I also hope it soars. I guess anything but the same. Like everything.

BTCUSD 4 hour chart 2022 - The lull and impatientThis is an amazing time. I see an almost vigilant push by society to accept the next generation of opportunity. This more than anything drives inspiration ad wealth and ideas ad will fill the pockets of many. Here I watch the BTCUSD pair navigate this sentiment. All aspects included.

BTC/USD Weekly Channel Since 2013BTC/USD Weekly Channel Since 2013
Do you think history repeats itself?
If it happens again, 230k can be the top of weekly channel.
* This is not a financial advice

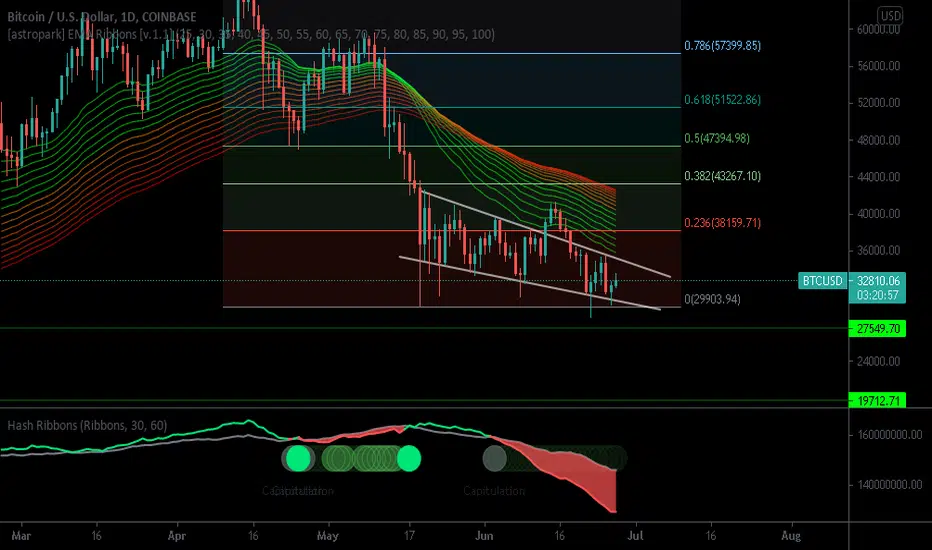
BTC going for 34K again!Bitcoins rallied the past couple days after touching off of the 0 FIB Level or 29K, as we notice we have been in sort of a slight descending channel or wedge and we have been moving sideways pretty accurately in this wedge. We definitely got a bit of room to run here potentially to the top of the wedge or aprx 34-35K. we could see a blast through but that would be kind of unlikely due to our current mini bear market or strong bear trend. One negative indicator i have been talking about recently is the EMA Ribbons we are starting to see the ribbons fully spreading out more and more bearish. the longer this goes on the longer the bear momentum will stay. Ideally we would like to see the ribbons start to compress again and start the whole process of turning back bullish, i say this because it doesn't happen overnight and can be a longer time frame switch. One of the best indicators for BTC in my opinion the.. Hash Ribbons, these don't print very often at all but when they do they do not lie, you can see this by backtesting yourself. right now we are in capitulation like we were recently and we are now looking for that "BUY" signal, we didn't get the signal last time obviously because the market wasn't ready but now this is a top inidacator that i am watching, usually after getting a buy signal we see huge bullish explosions over a longer TF not in a day, but for example a weeks or two weeks time. Not financial advice just my opinion!
Bitcoin Cash $BCHUSD PT 750Bitcoin Cash
Bitcoin Cash is a different story. Bitcoin Cash was started by bitcoin miners and developers equally concerned with the future of the cryptocurrency and its ability to scale effectively. However, these individuals had their reservations about the adoption of a segregated witness technology. They felt as though SegWit2x did not address the fundamental problem of scalability in a meaningful way, nor did it follow the roadmap initially outlined by Satoshi Nakamoto, the anonymous party that first proposed the blockchain technology behind cryptocurrency.
Furthermore, the process of introducing SegWit2x as the road forward was anything but transparent, and there were concerns that its introduction undermined the decentralization and democratization of the currency.
In August 2017, some miners and developers initiated what is known as a hard fork, effectively creating a new currency: BCH. BCH has its own blockchain and specifications, including one very important distinction from bitcoin. BCH has implemented an increased block size of 8 MB to accelerate the verification process, with an adjustable level of difficulty to ensure the chain’s survival and transaction verification speed, regardless of the number of miners supporting it.
In 2018, the maximum block size for BCH was increased 4x to 32MB, but actual block sizes on Bitcoin cash have remained only a small fraction of the 32MB limit.
Bitcoin Cash is thus able to process transactions more quickly than the Bitcoin network, meaning that wait times are shorter and transaction processing fees tend to be lower. The Bitcoin Cash network can handle many more transactions per second than the Bitcoin network can. However, with the faster transaction verification time comes downsides as well. One potential issue with the larger block size associated with BCH is that security could be compromised relative to the Bitcoin network. Similarly, bitcoin remains the most popular cryptocurrency in the world as well as the largest by market cap, so users of BCH may find that liquidity and real-world usability is lower than for bitcoin.
The debate about scalability, transaction processing, and blocks has continued beyond the fork which led to Bitcoin Cash. In November of 2018, for example, the Bitcoin Cash network experienced its own hard fork, resulting in the creation of yet another derivation of bitcoin called Bitcoin SV. Bitcoin SV was created in an effort to stay true to the original vision for bitcoin that Satoshi Nakamoto described in the bitcoin white paper while also making modifications to facilitate scalability and faster transaction speeds. The debate about the future of bitcoin appears to show no signs of being resolved.

Interesting Fractal movesin 14th july bitcoin started to form a inverted head and shoulder-like move until 20 july, then it failed to form right shoulder and started a channel toward downside.
then again it made pretty much exactly the same pattern but a smaller one as i drew in the chart. i've seen these fractal patterns repeat themselves at least 4 times especially in corrections, like one we have in wave 2 after rallying from the 3100 bottom.
take a look at these patterns. you can open a leverage position to play these patterns. it would be nice.
now i expect to break to the upside from the smaller channel.
